

Reading a Kafka cluster you did not build
Somebody else built it, the person who knew why has moved on, and it is yours now. The first hour is for reading, not changing — and the order you read in decides how much of that hour is spent on the questions that matter. This is the order, and what BROKA shows for each.
Register the cluster so that nothing can be changed by accident, then read it from the top: whether it is whole, what version it really runs, how its brokers are configured and loaded, what its topics hold, who reads them and how far behind they are, and who may do what. Every one of those answers is a read.
The questions, and where they are answered
| The question | Where BROKA answers it | What to watch for |
|---|---|---|
| Is it whole? | Overview: the status badge and Under-replicated | Degraded means no controller; a dash means the count could not be taken |
| What does it actually run? | Brokers: the Version tile, Features, Quorum | Upgraded binaries whose metadata version was never raised |
| Are the brokers configured alike — and where does each value come from? | Config drift; a broker's Configuration tab and its Source column | Dynamic values that override the properties file |
| Is the load even? | The broker list's skew percentages; Logs ▸ Directories | Size is what a broker wrote, not how full its disk is |
| What do the topics hold, and what did somebody choose? | Topics; a topic's Config tab, overrides only | Replication factor 1, retention nobody set |
| Is every partition replicated? | A topic's Partitions tab: replicas against in-sync replicas | A broker listed as a replica and missing from in-sync |
| Who reads it, and are they keeping up? | Consumer Groups: lag, time lag and Signal | Groups with offsets and no members |
| Who may do what? | Service Accounts; a topic's ACL tab | Denies, prefix rules, or no authorizer at all |
| Schemas and connectors | Schema Registry and Connect, once registered | A greyed-out entry means none is registered here, not that none exists |
0 — Connect so that you cannot change it
A connection in BROKA is a cluster. When you add the inherited one, turn on the connection's read-only switch until you know what you are looking at. It is enforced by the server, not the browser: a write to a read-only connection is refused, and the attempt is recorded in the audit trail. It is independent of the environment's own policy — either is enough to stop a write.
Once the connection is saved, its page ends with Supported features: the product and version BROKA detected, and every feature it asked the cluster about, each Available or Unavailable with the reason. It is the same answer the sidebar and every screen act on, so it explains in one place why a control you expected is greyed out.
Looking leaves almost nothing behind. Reaching the cluster stamps the connection as reachable, with the round trip it took. In Commercial, with the audit read tier set to record all reads, the topic listing behind the overview is recorded as a read, and reading the ACLs is recorded by default. Nothing else you do in this hour changes anything.
1 — Is it whole?
The Overview counts brokers, topics, partitions, consumer groups, total consumer lag and under-replicated partitions, and lists the brokers with the active controller marked, the five groups with the most lag and — if you may view the audit trail — the last audited actions on the cluster.
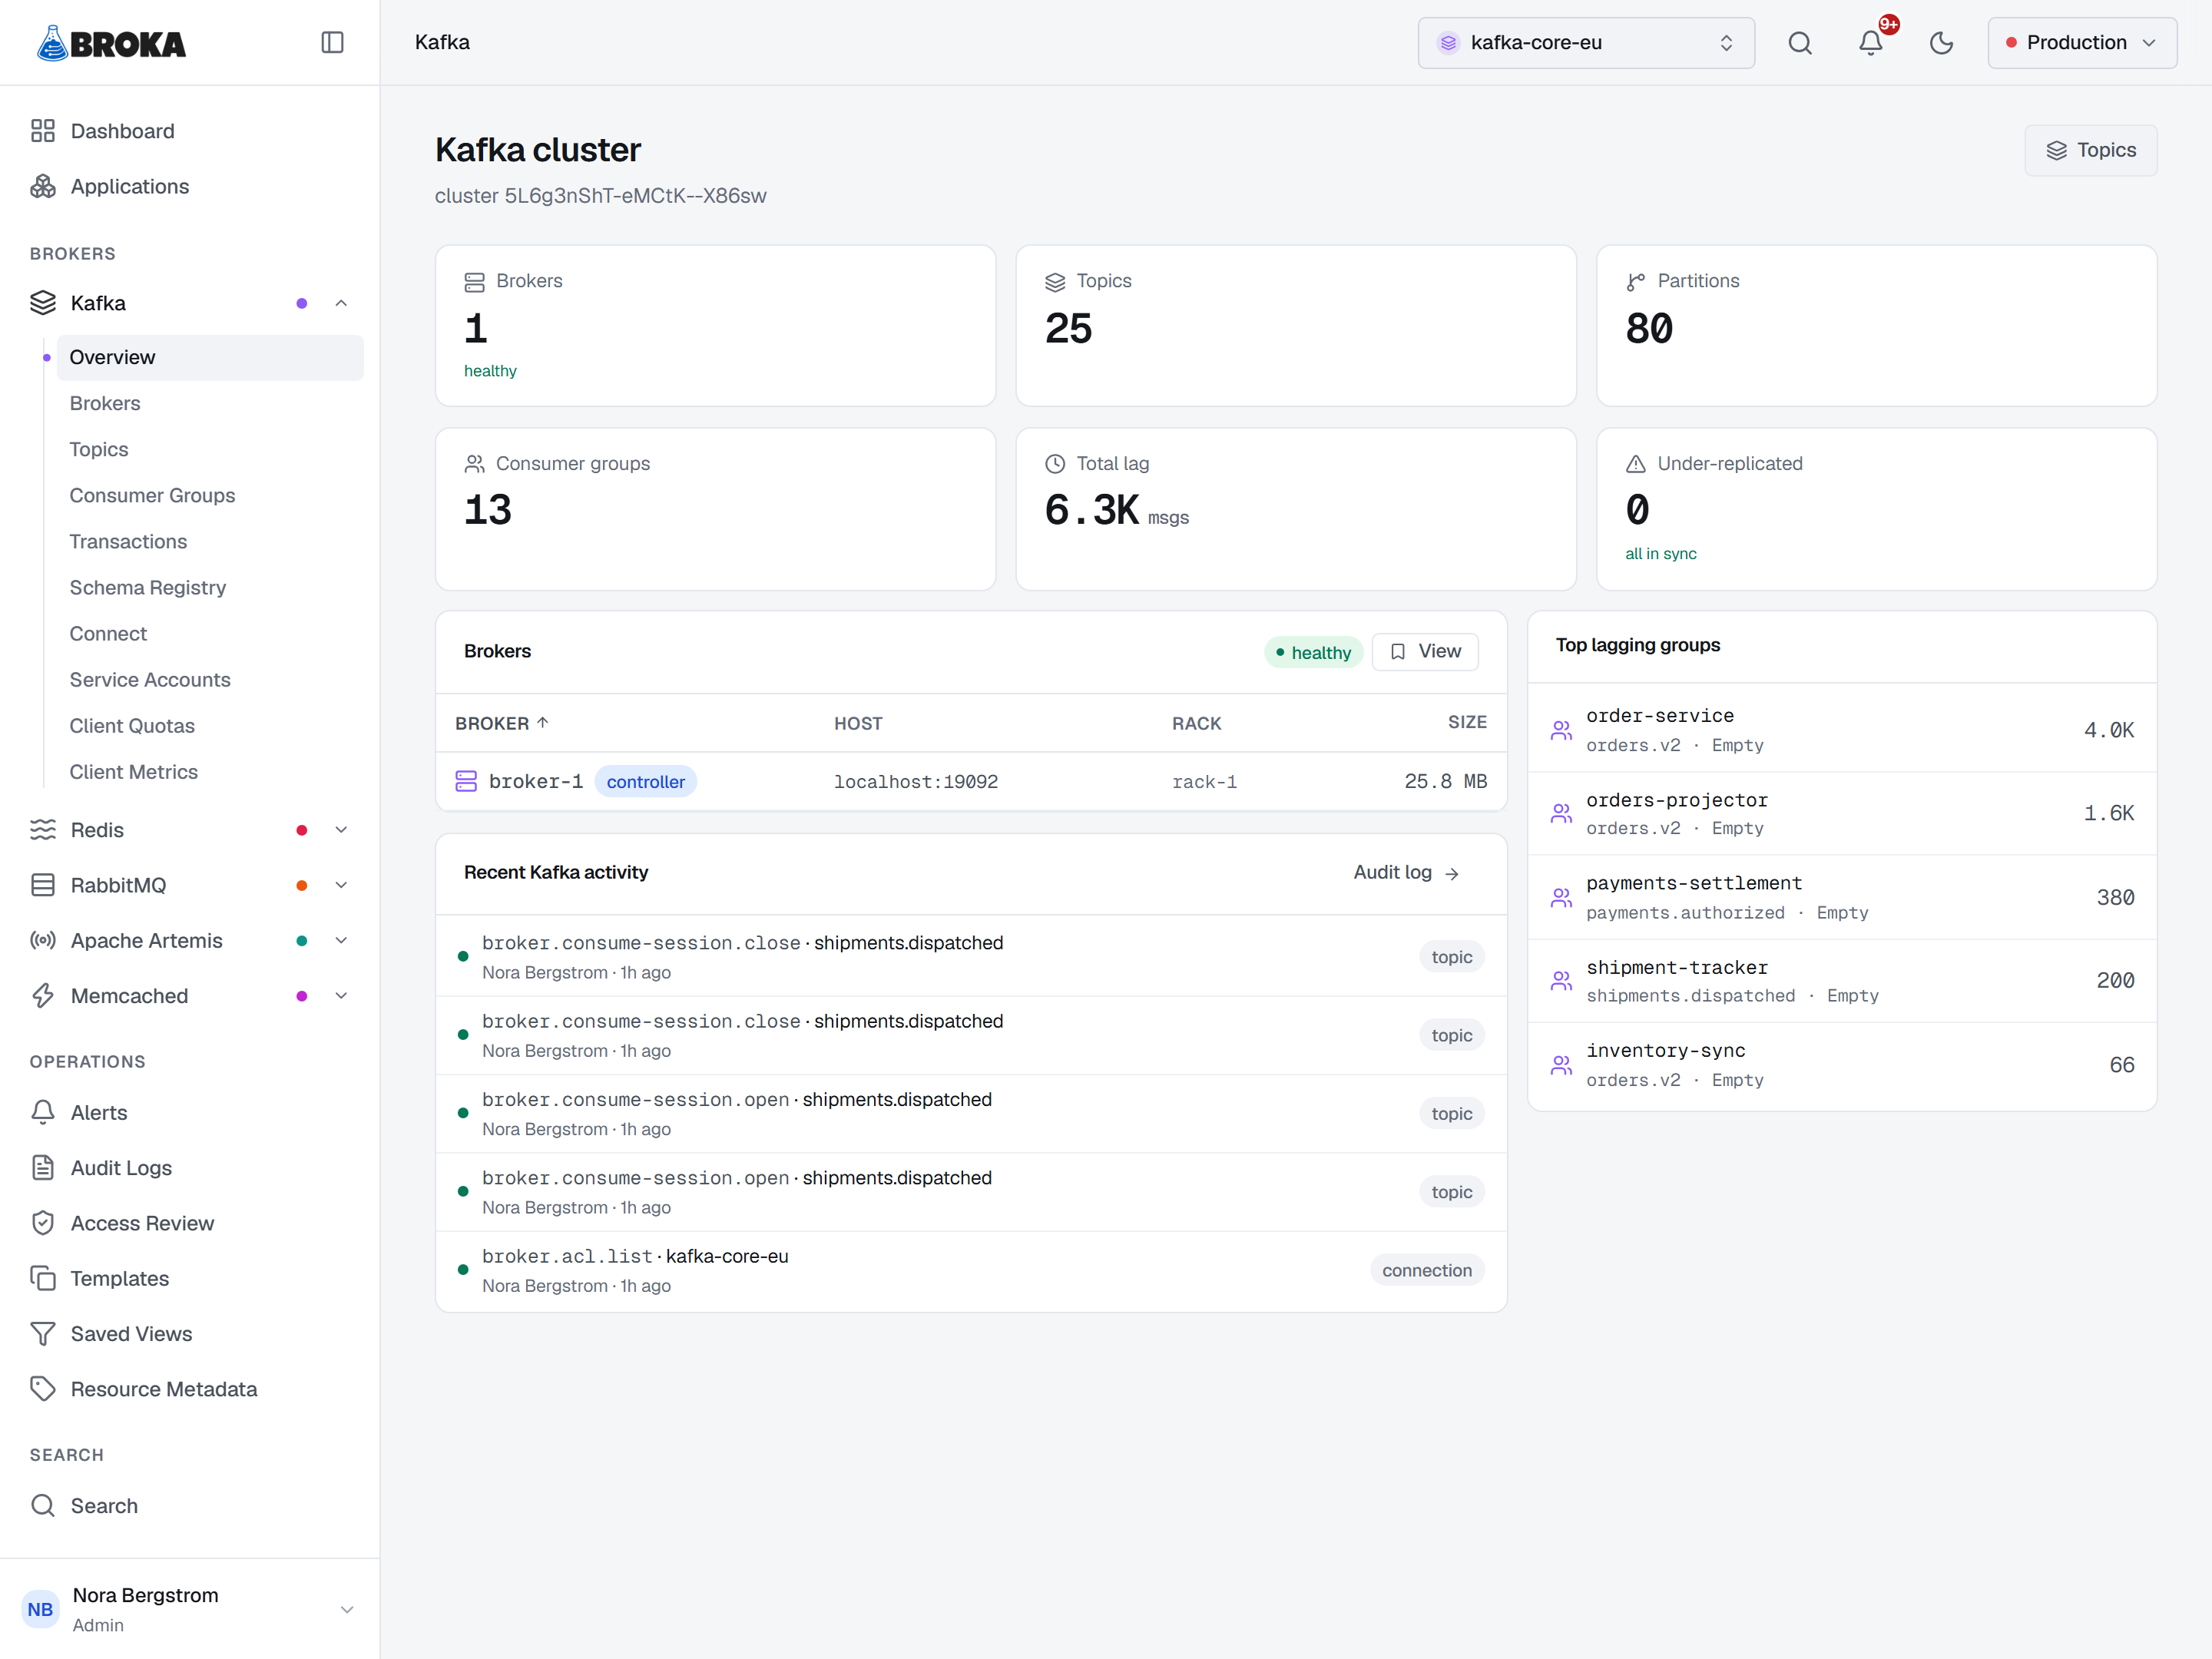
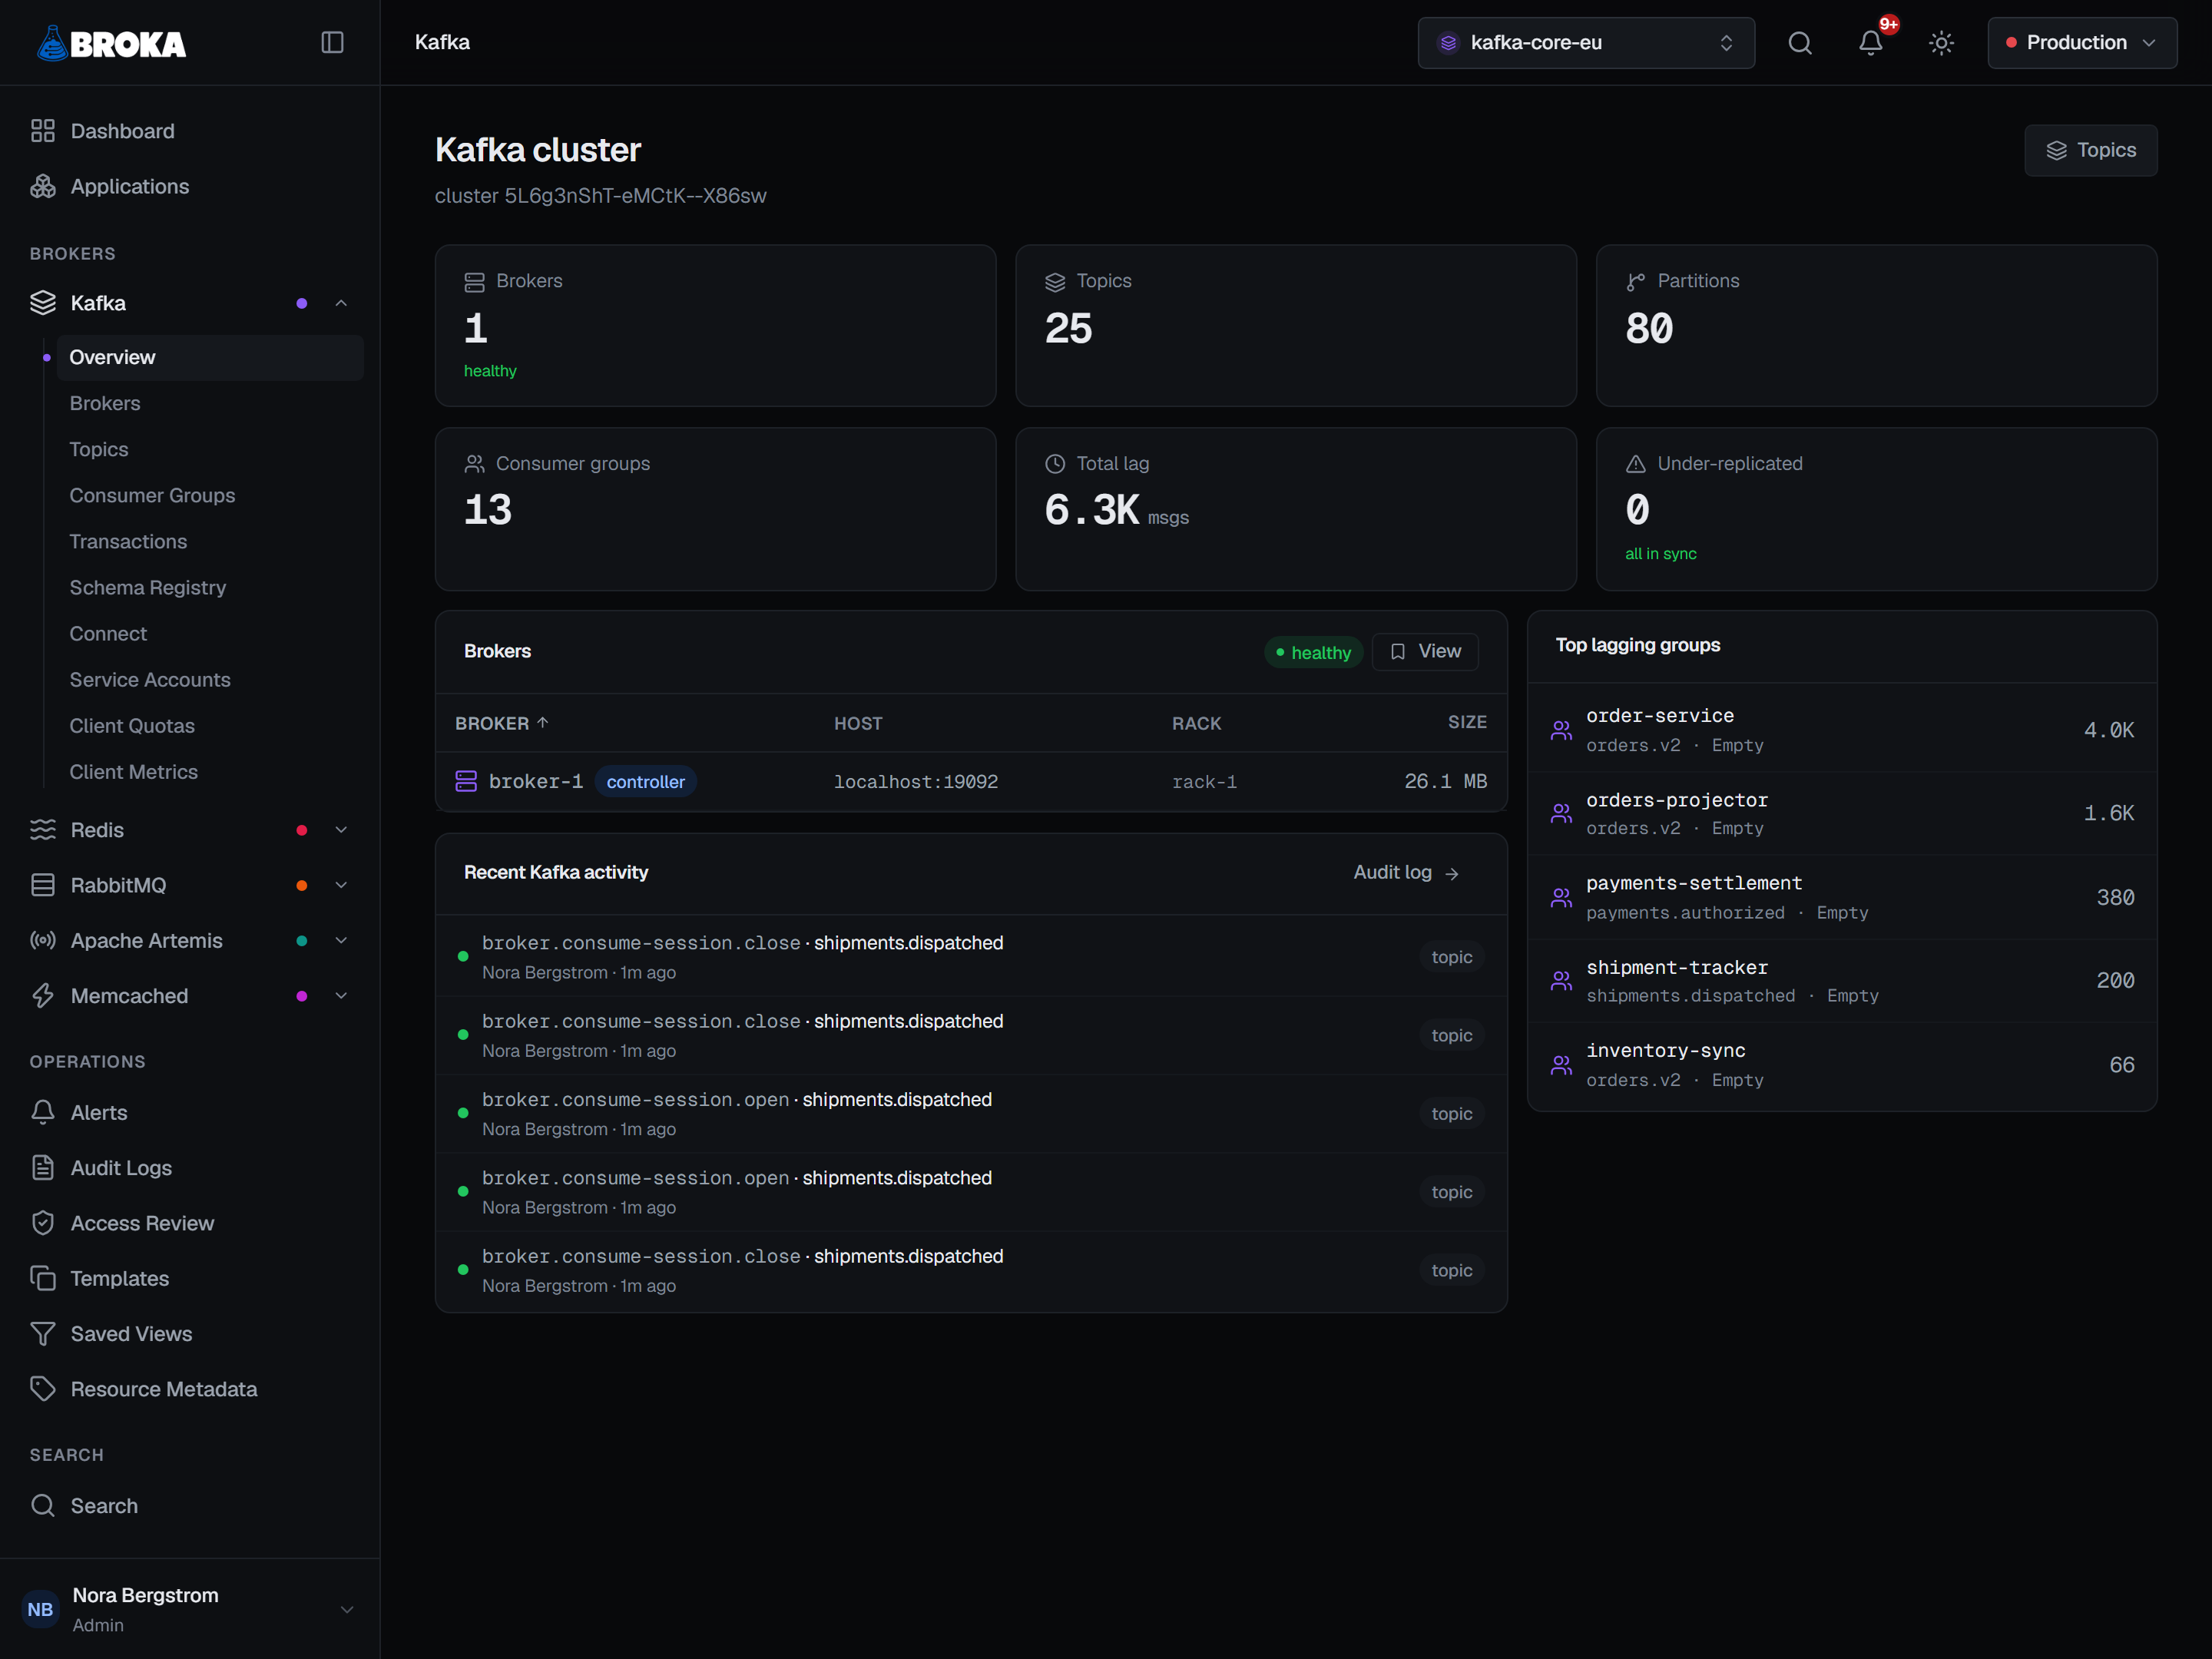
The status badge is deliberately narrow. Healthy means BROKA reached the cluster, saw at least one broker and found an elected controller. Degraded means it saw brokers but no controller — the state that stops most administrative work. Replication is reported beside it, not folded into it: the Under-replicated tile sums what each broker reports for the partitions it leads whose in-sync replicas are fewer than their assigned replicas. It reads a dash, not zero, when the scan could not complete — a zero there is a claim that nothing is under-replicated.
The topic, partition, group and lag figures come from a snapshot BROKA refreshes about every thirty seconds, so they can be up to half a minute old; the Topics and Consumer Groups pages say how old, and their Refresh reads the brokers directly.
2 — What does it actually run?
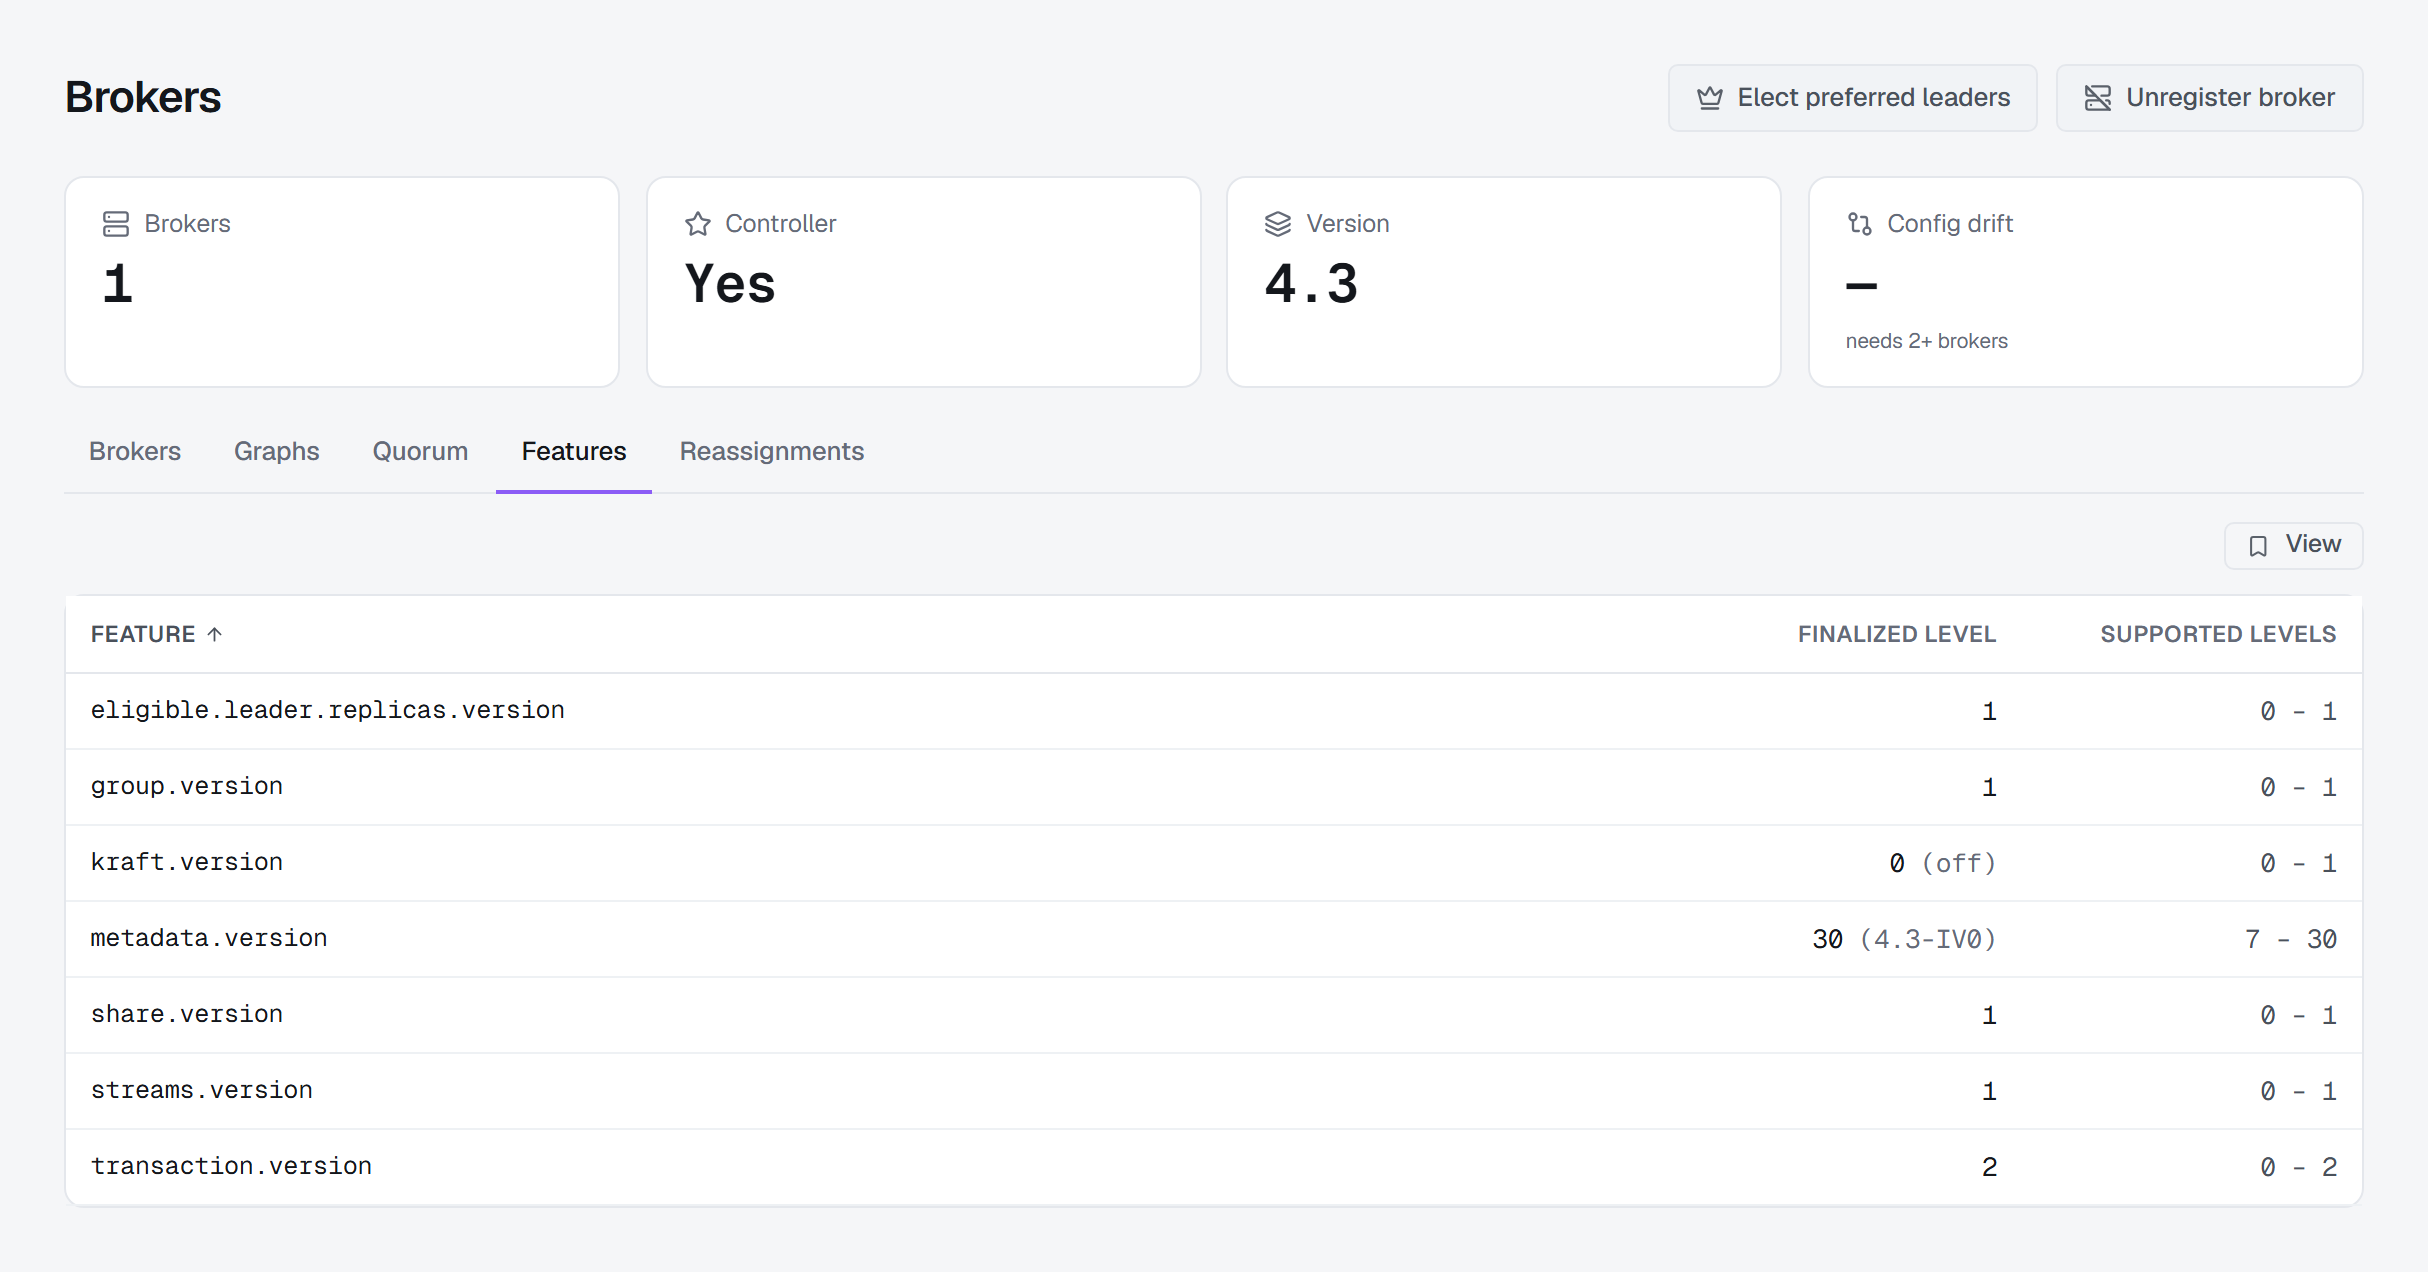
On Brokers, the Version tile is the version the cluster runs, not the one its binaries could run.
On a KRaft cluster it is the finalized metadata.version, named as the release it belongs to; on a
ZooKeeper cluster, the inter-broker protocol version. A cluster whose brokers were upgraded but whose
metadata version was never raised shows the old version here — and behaves like it.
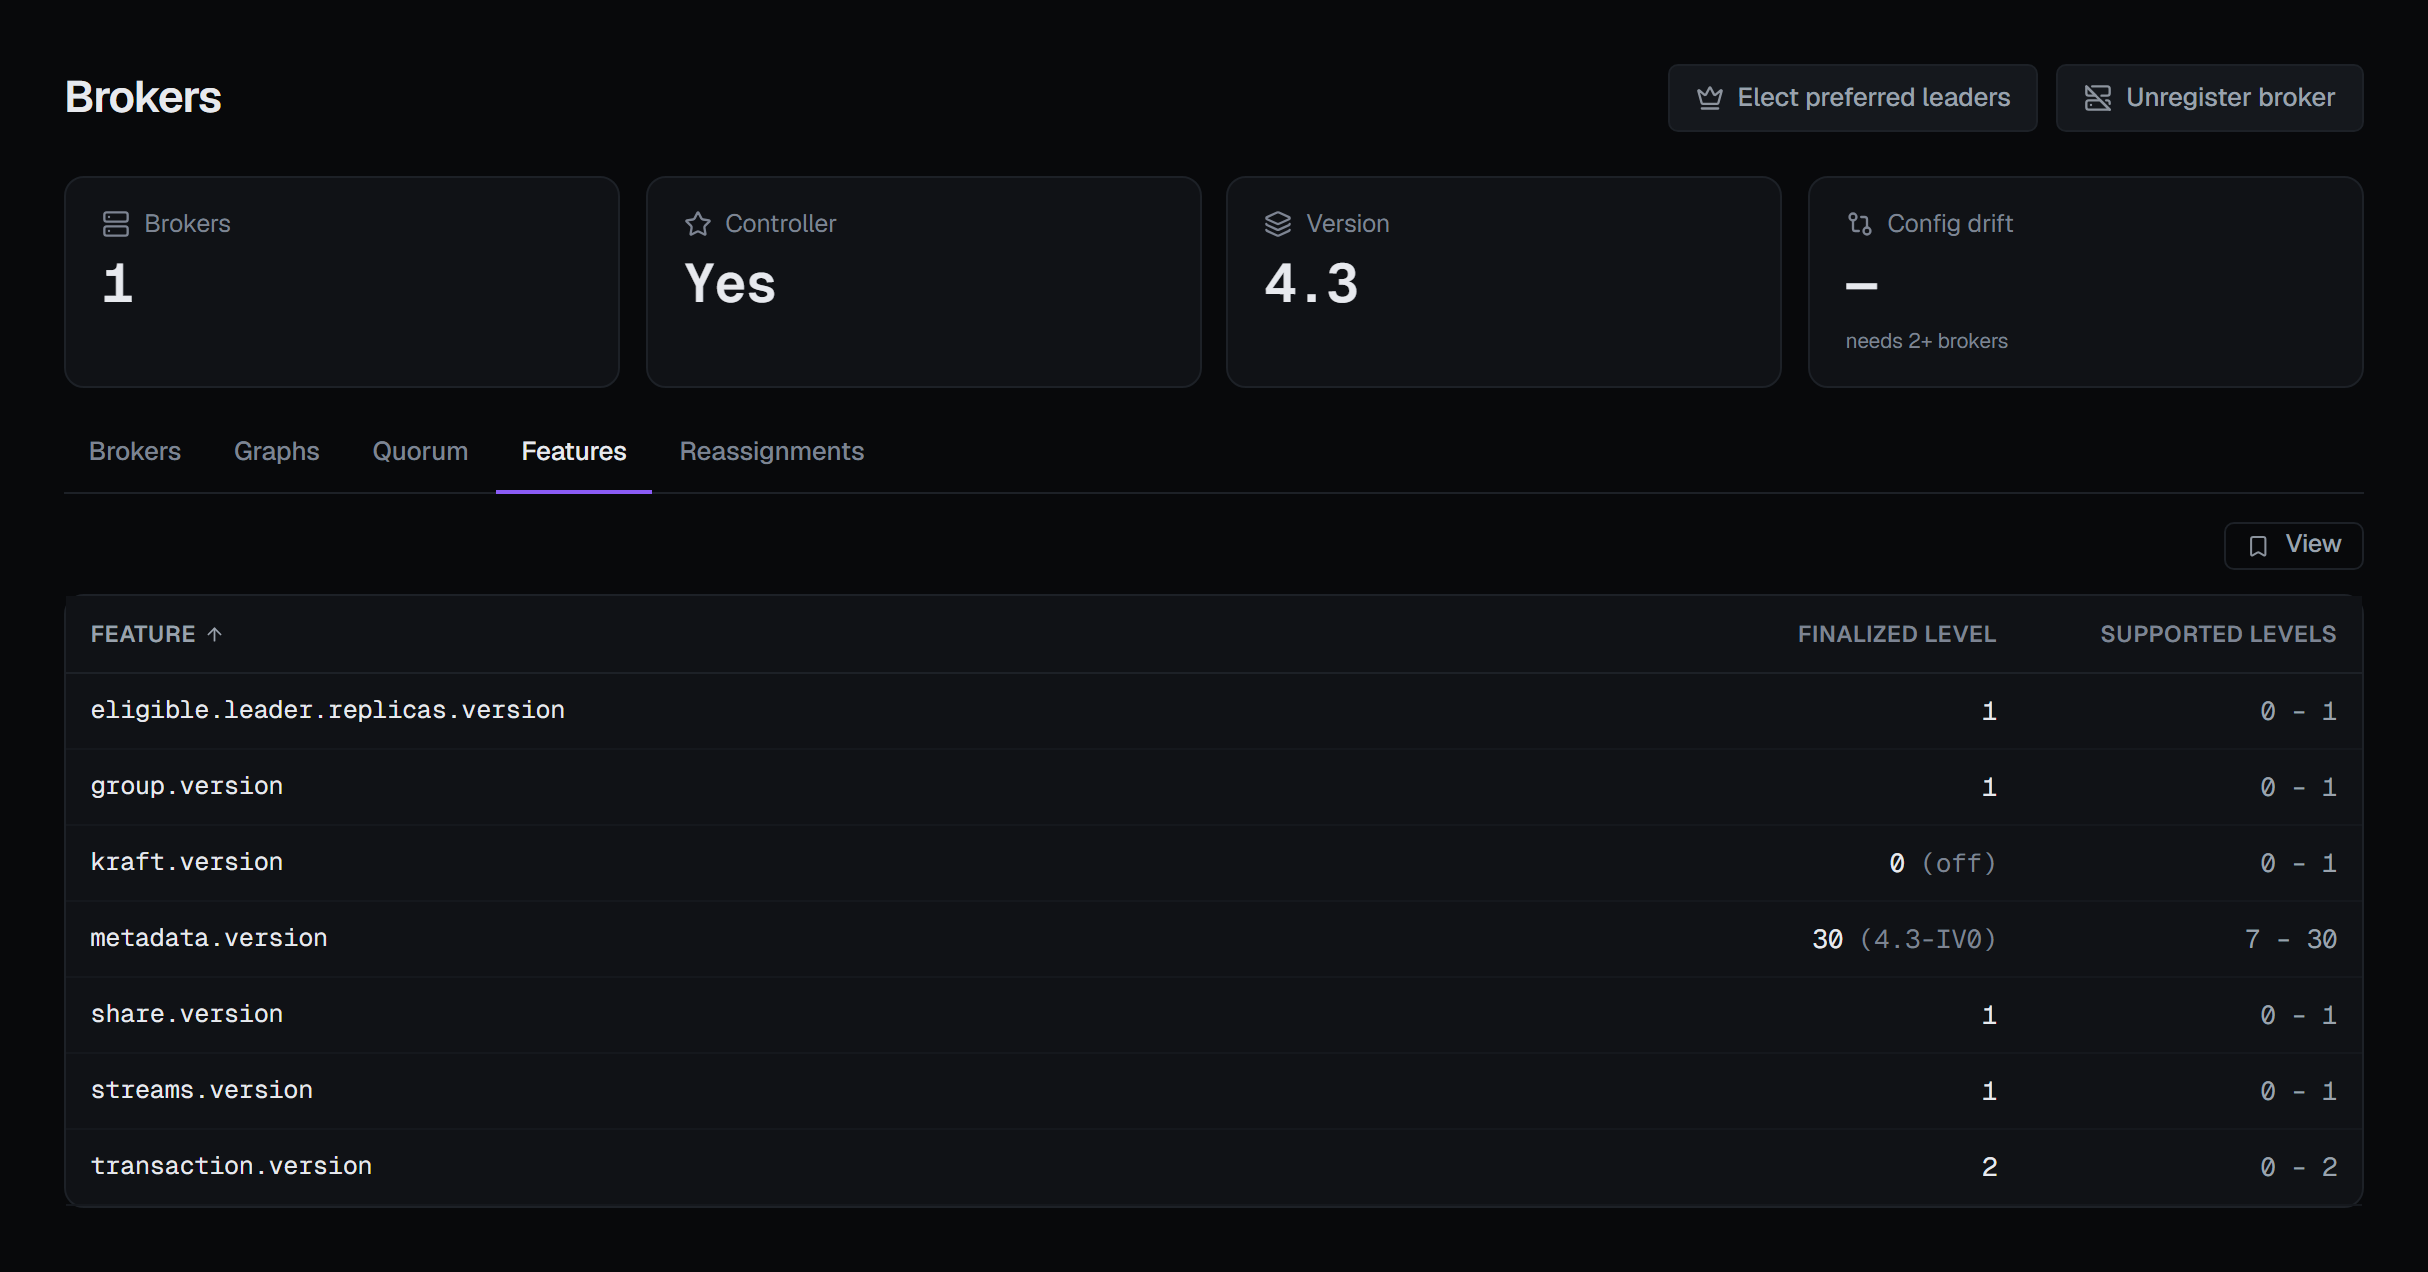
Features lists every feature the cluster names with the level it is finalized at and the levels the brokers support, so you can tell what an upgrade actually switched on. A feature at level 0 reads 0 (off): the brokers support it, and the cluster has not enabled it.
Quorum shows a KRaft cluster's metadata quorum: its leader — the active controller — and every voter and observer with how far it trails the leader. A replica falling behind shows there before it becomes a controller failover. A broker the controller has fenced — registered, but not serving — carries a FENCED badge in the list; before Kafka 4.0 the brokers do not report a fenced broker at all, and the Brokers tile says so rather than letting the count quietly be one short.
3 — How the brokers are set up, and how they are loaded
The broker list gives each broker its rack, address, on-disk size, and the partitions it holds and leads, each beside a signed skew percentage against the cluster average — the figure that turns "broker 3 has 412 partitions" into "broker 3 is carrying 38% more than its share". The remedies, moving partitions and electing preferred leaders, are for later; for now the skew is a fact about the cluster you were given.
Size is what a broker has written, not how full its disk is. How much room is left is on the broker's own detail, under Logs ▸ Directories: each log directory's volume size, free space and share used, and whether it is offline. Logs ▸ Replicas lists the partition replicas the broker holds, with each one's size and how far it trails — the answer to "why is this broker so much bigger than the others".
The Config drift tile compares every property's value across the serving brokers and reads None or Found, leaving out the settings meant to differ — each broker's id, rack, listeners, log directories and keystore. Then open one broker's Configuration tab. Every property carries Kafka's own Source for it: a static value from the properties file, a dynamic one set while the broker runs, or the built-in default.
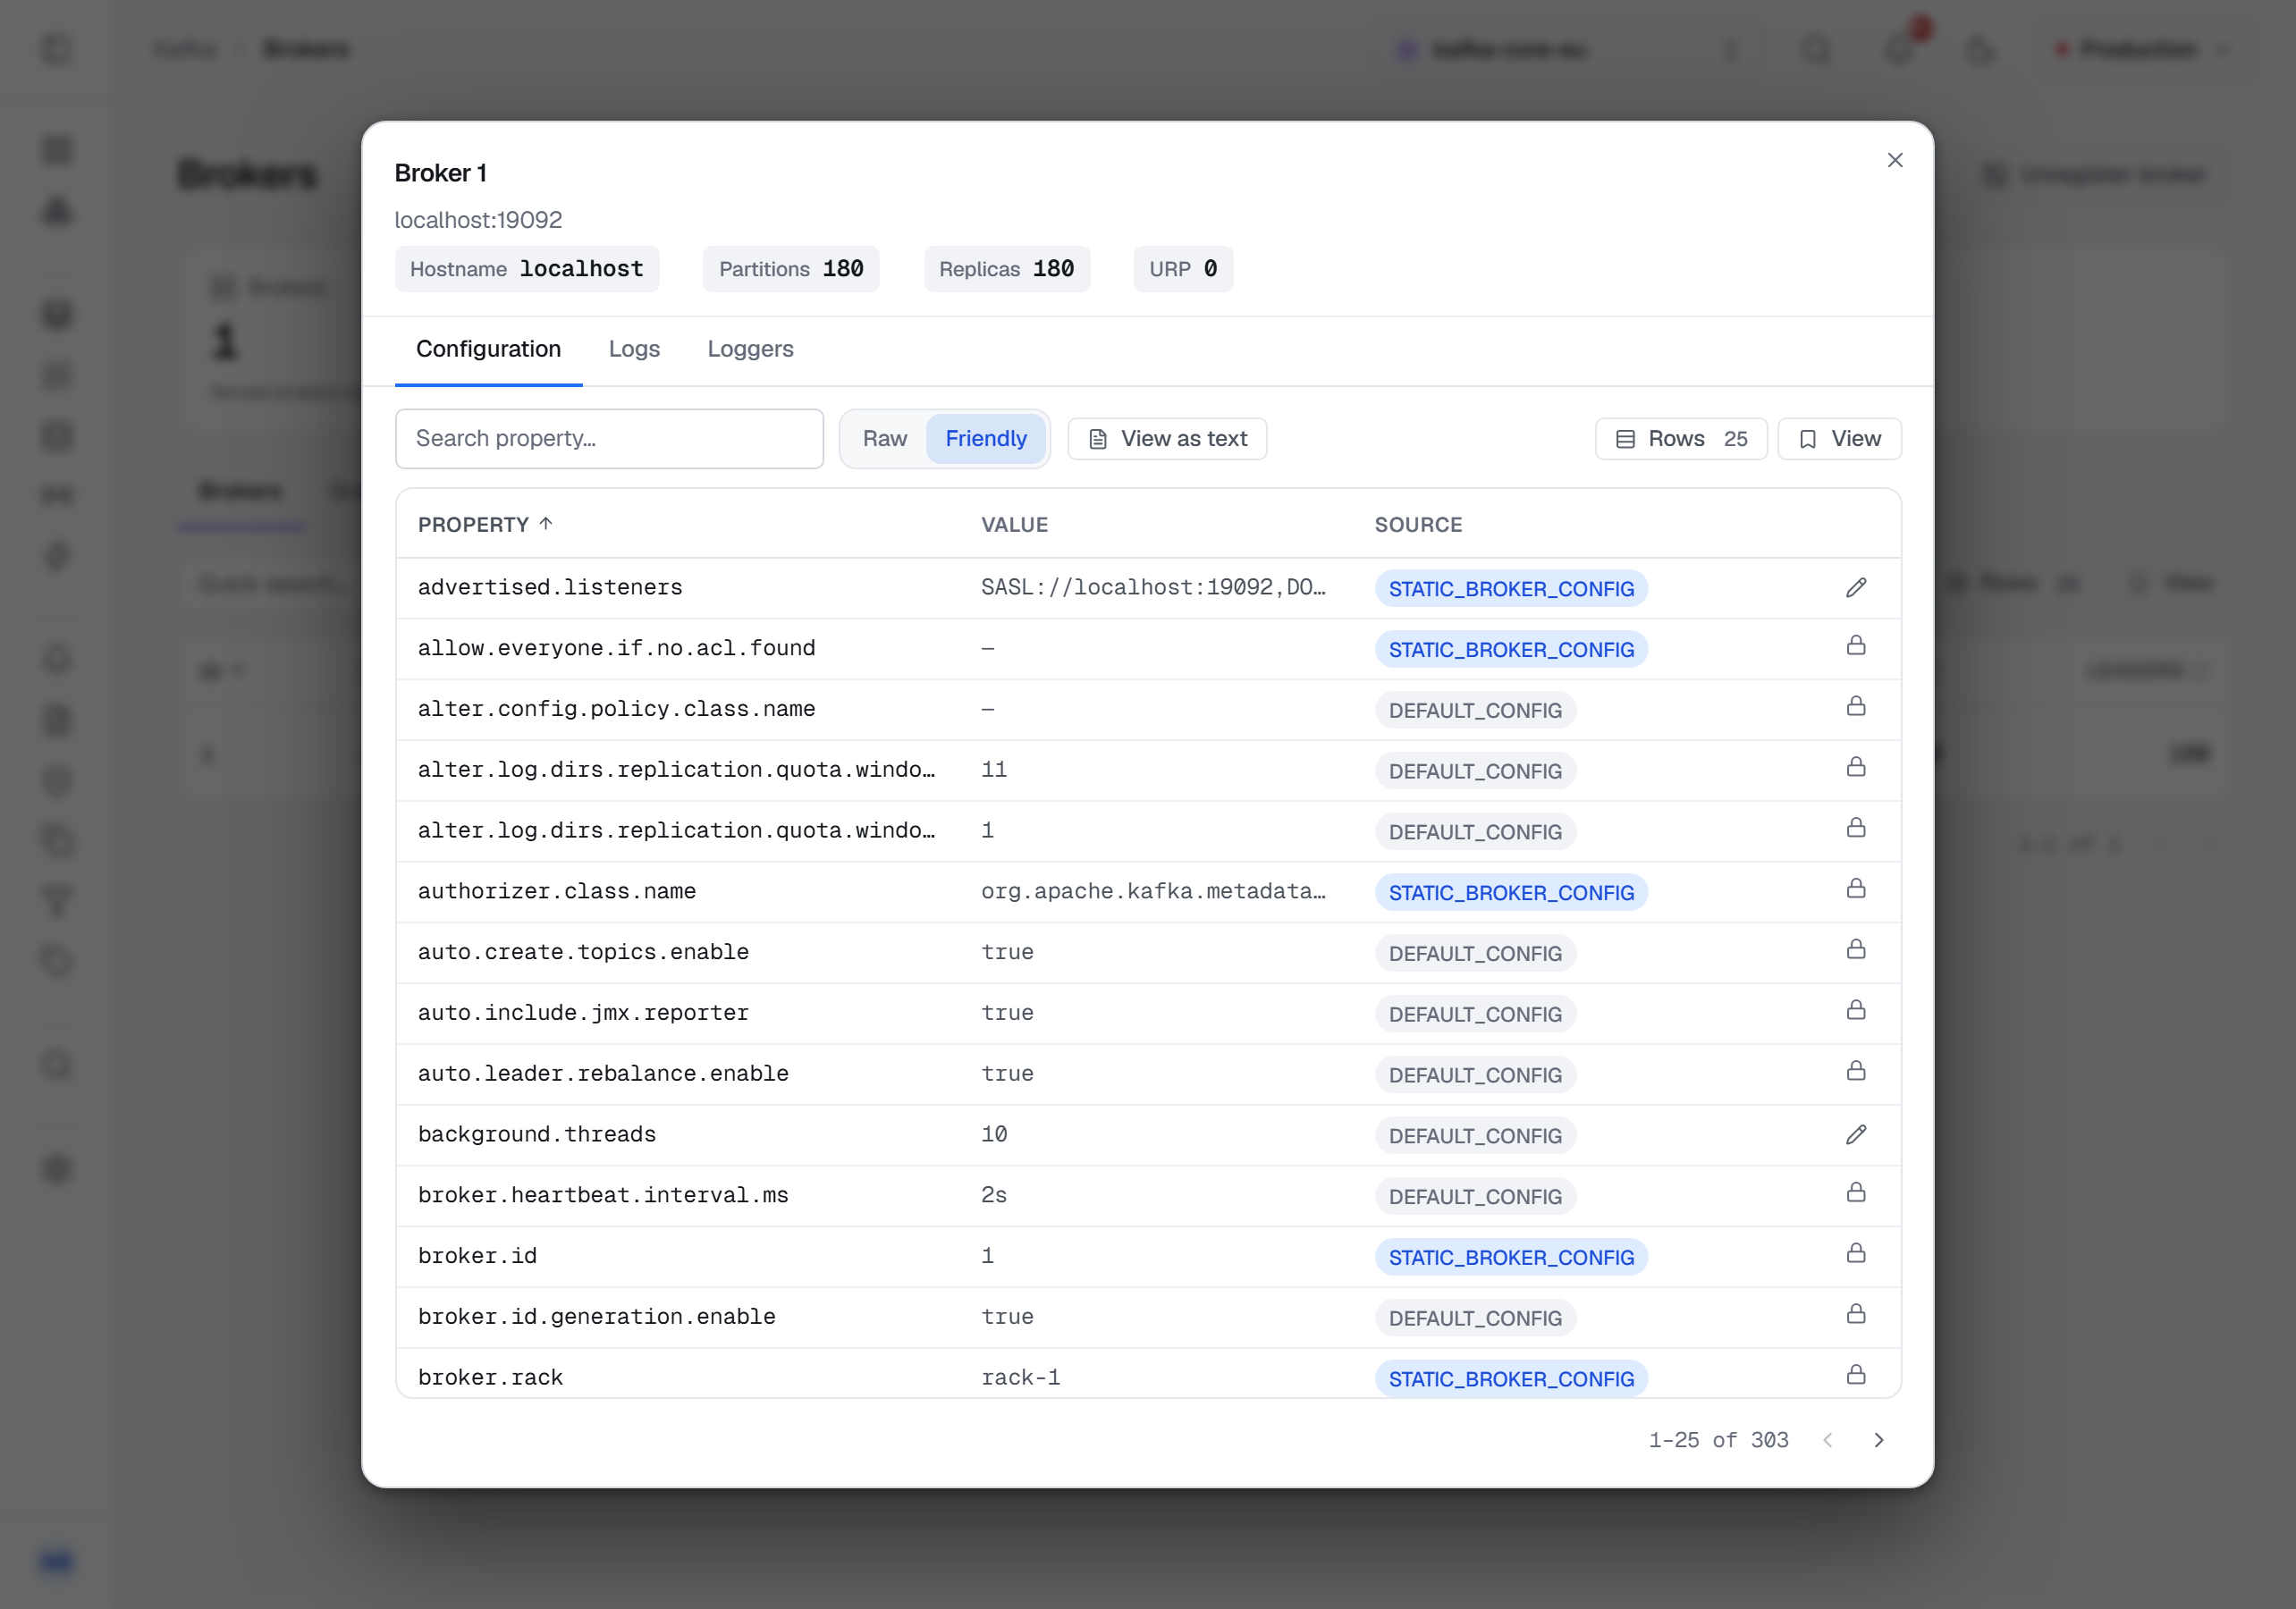
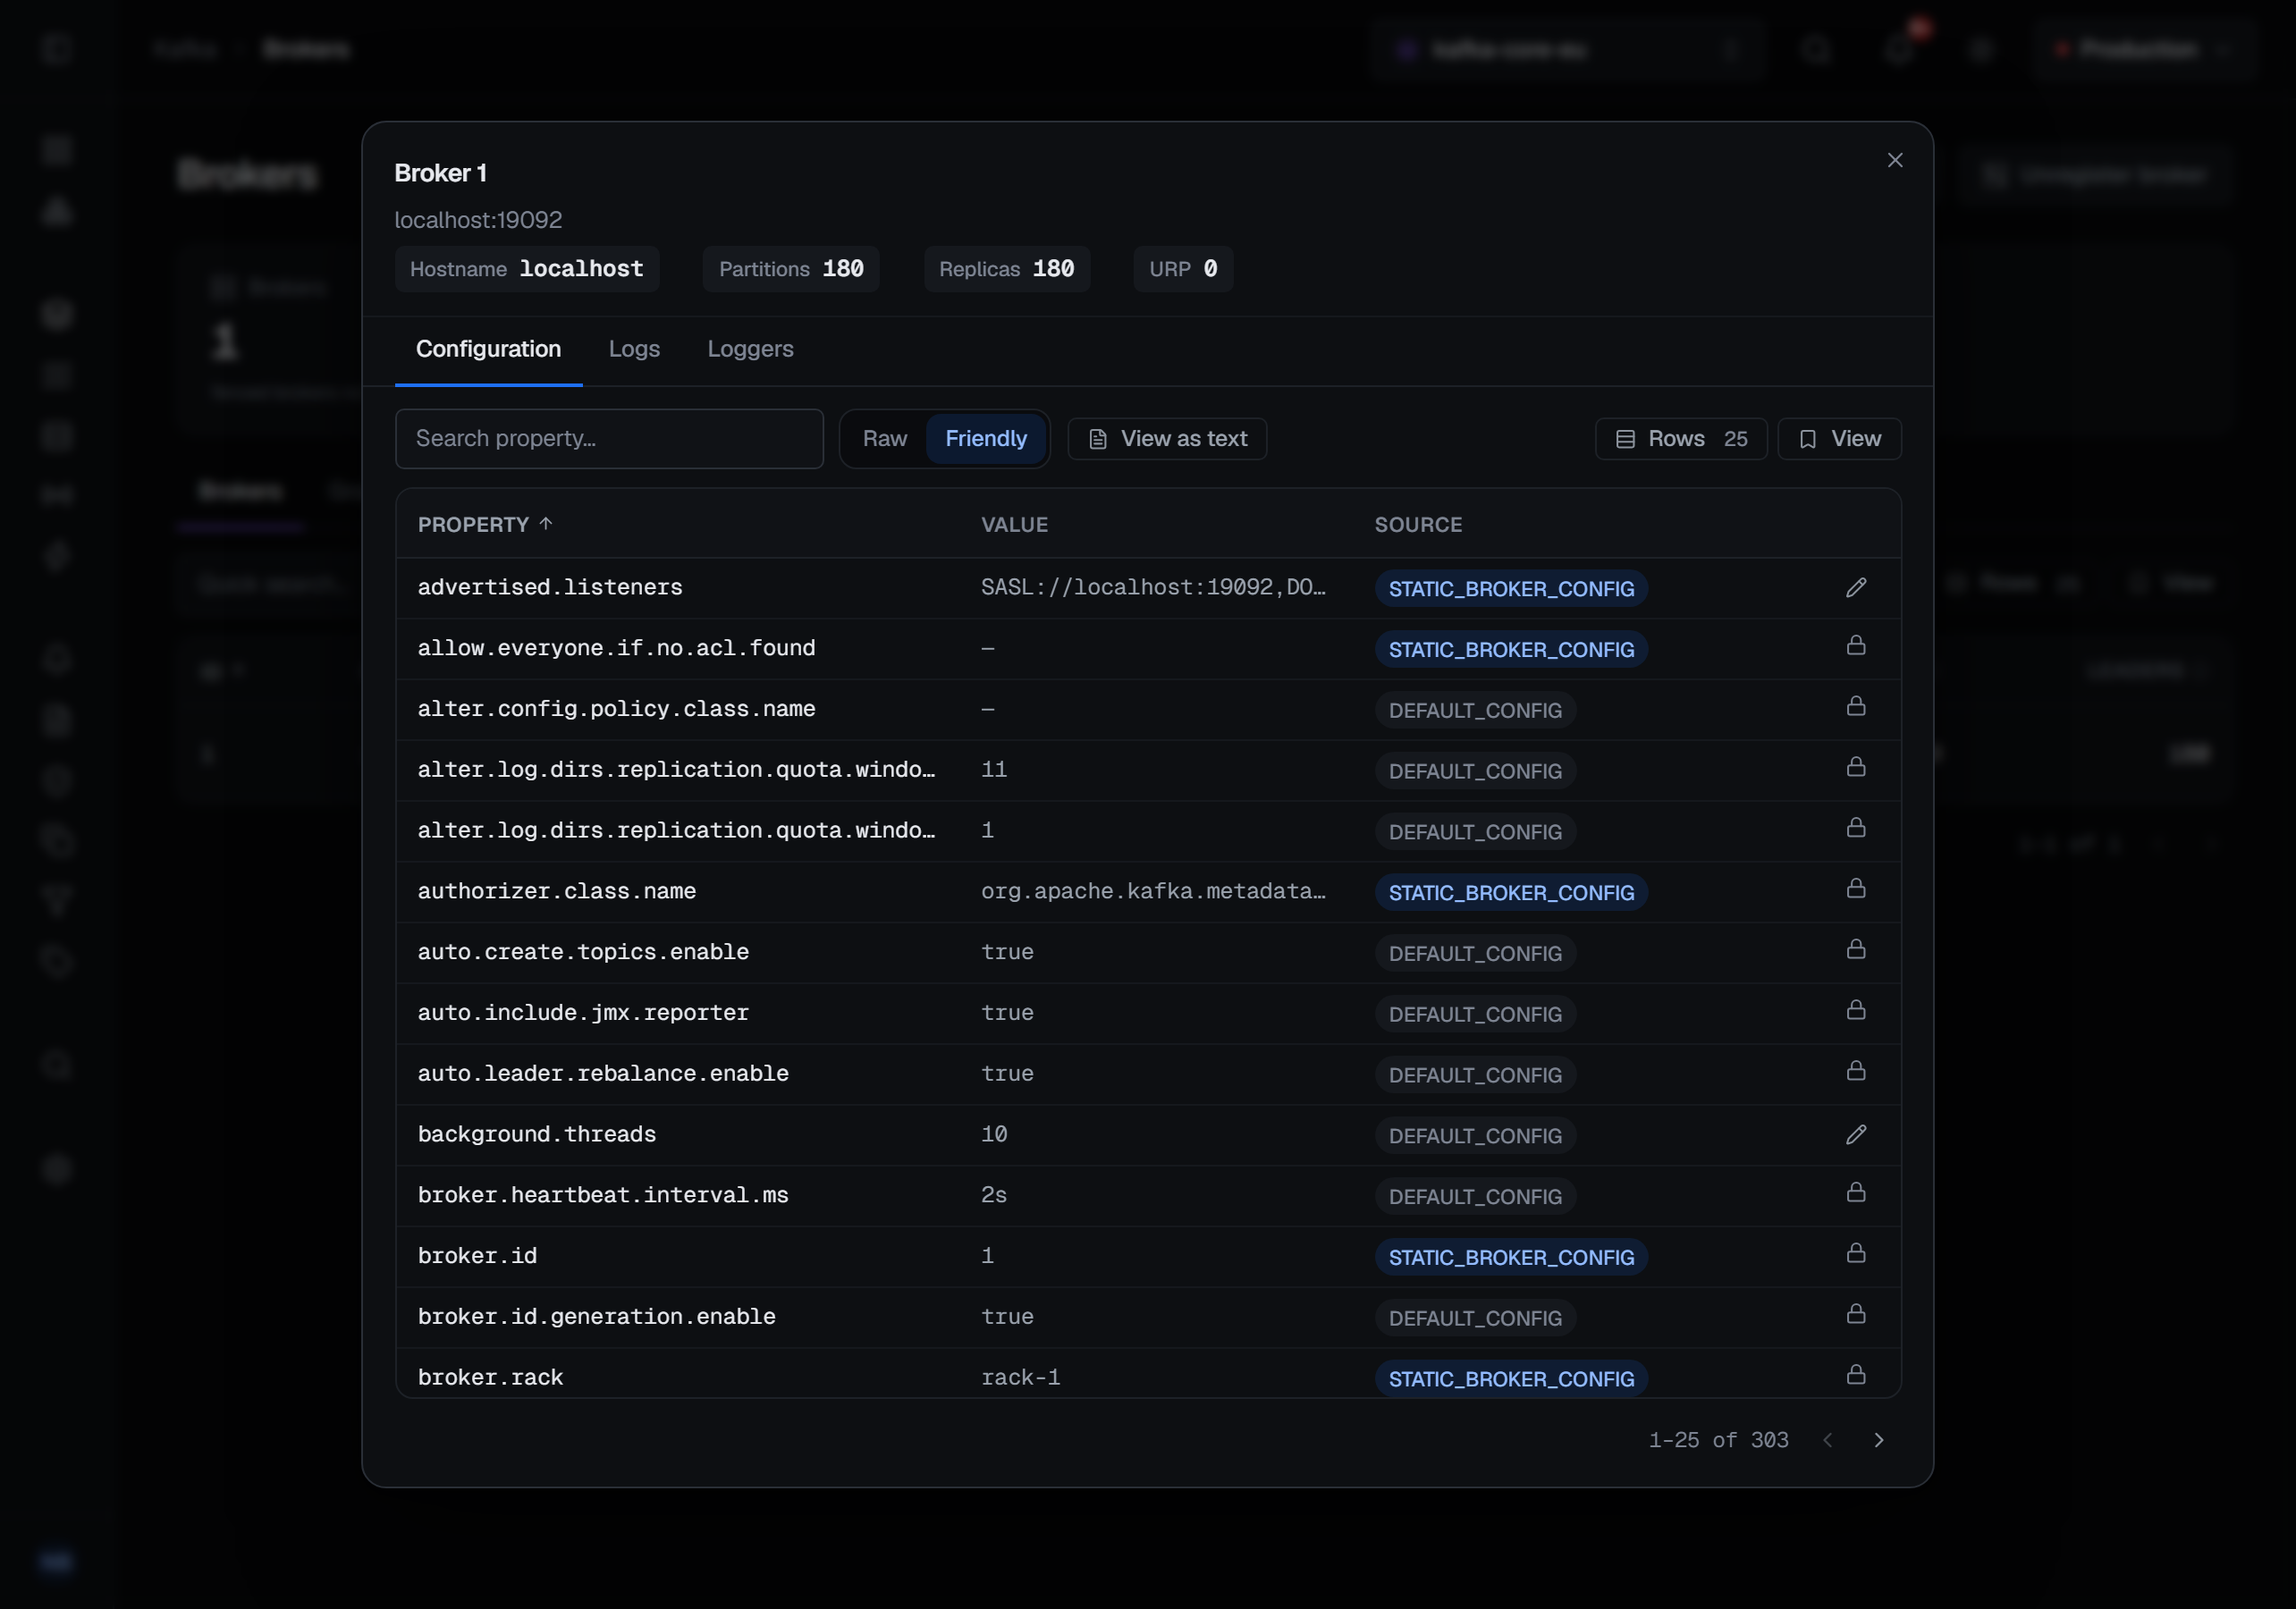
On an inherited cluster that column is the one to read slowly. A dynamic value is kept in the cluster
itself rather than in server.properties, survives a restart and takes precedence over the file — so the
file on the broker's disk is not the whole configuration, and the Source column is how you find what it
leaves out. View as text gives the whole effective configuration as name=value lines, the form for
comparing two brokers or pasting into a ticket.
4 — What the topics hold
Topics lists every topic, with the columns you choose: partitions, replication factor, message count, size, cleanup policy, retention time and bytes, minimum in-sync replicas, produce rate and last activity. A column that could not be measured shows a dash rather than a number. Turn on replication factor and minimum in-sync replicas first: a production topic with a single replica is the kind of decision somebody made once and nobody revisited. The Unavailable tile and the Status filter pick out topics with a partition that has no leader.
On a topic's page, the Config tab opens showing only the properties that have been overridden — on a typical topic, a handful out of ninety, and those are the ones somebody chose. Each row says whether its value is an override or the broker's default.
Two figures on a topic are easy to misread. Size is the sum of every replica, so three replicas of one gigabyte report three gigabytes — what the topic occupies on your disks. Message count is the distance between the earliest and latest offsets, which on a compacted topic is higher than what a consumer reading from the start would receive.
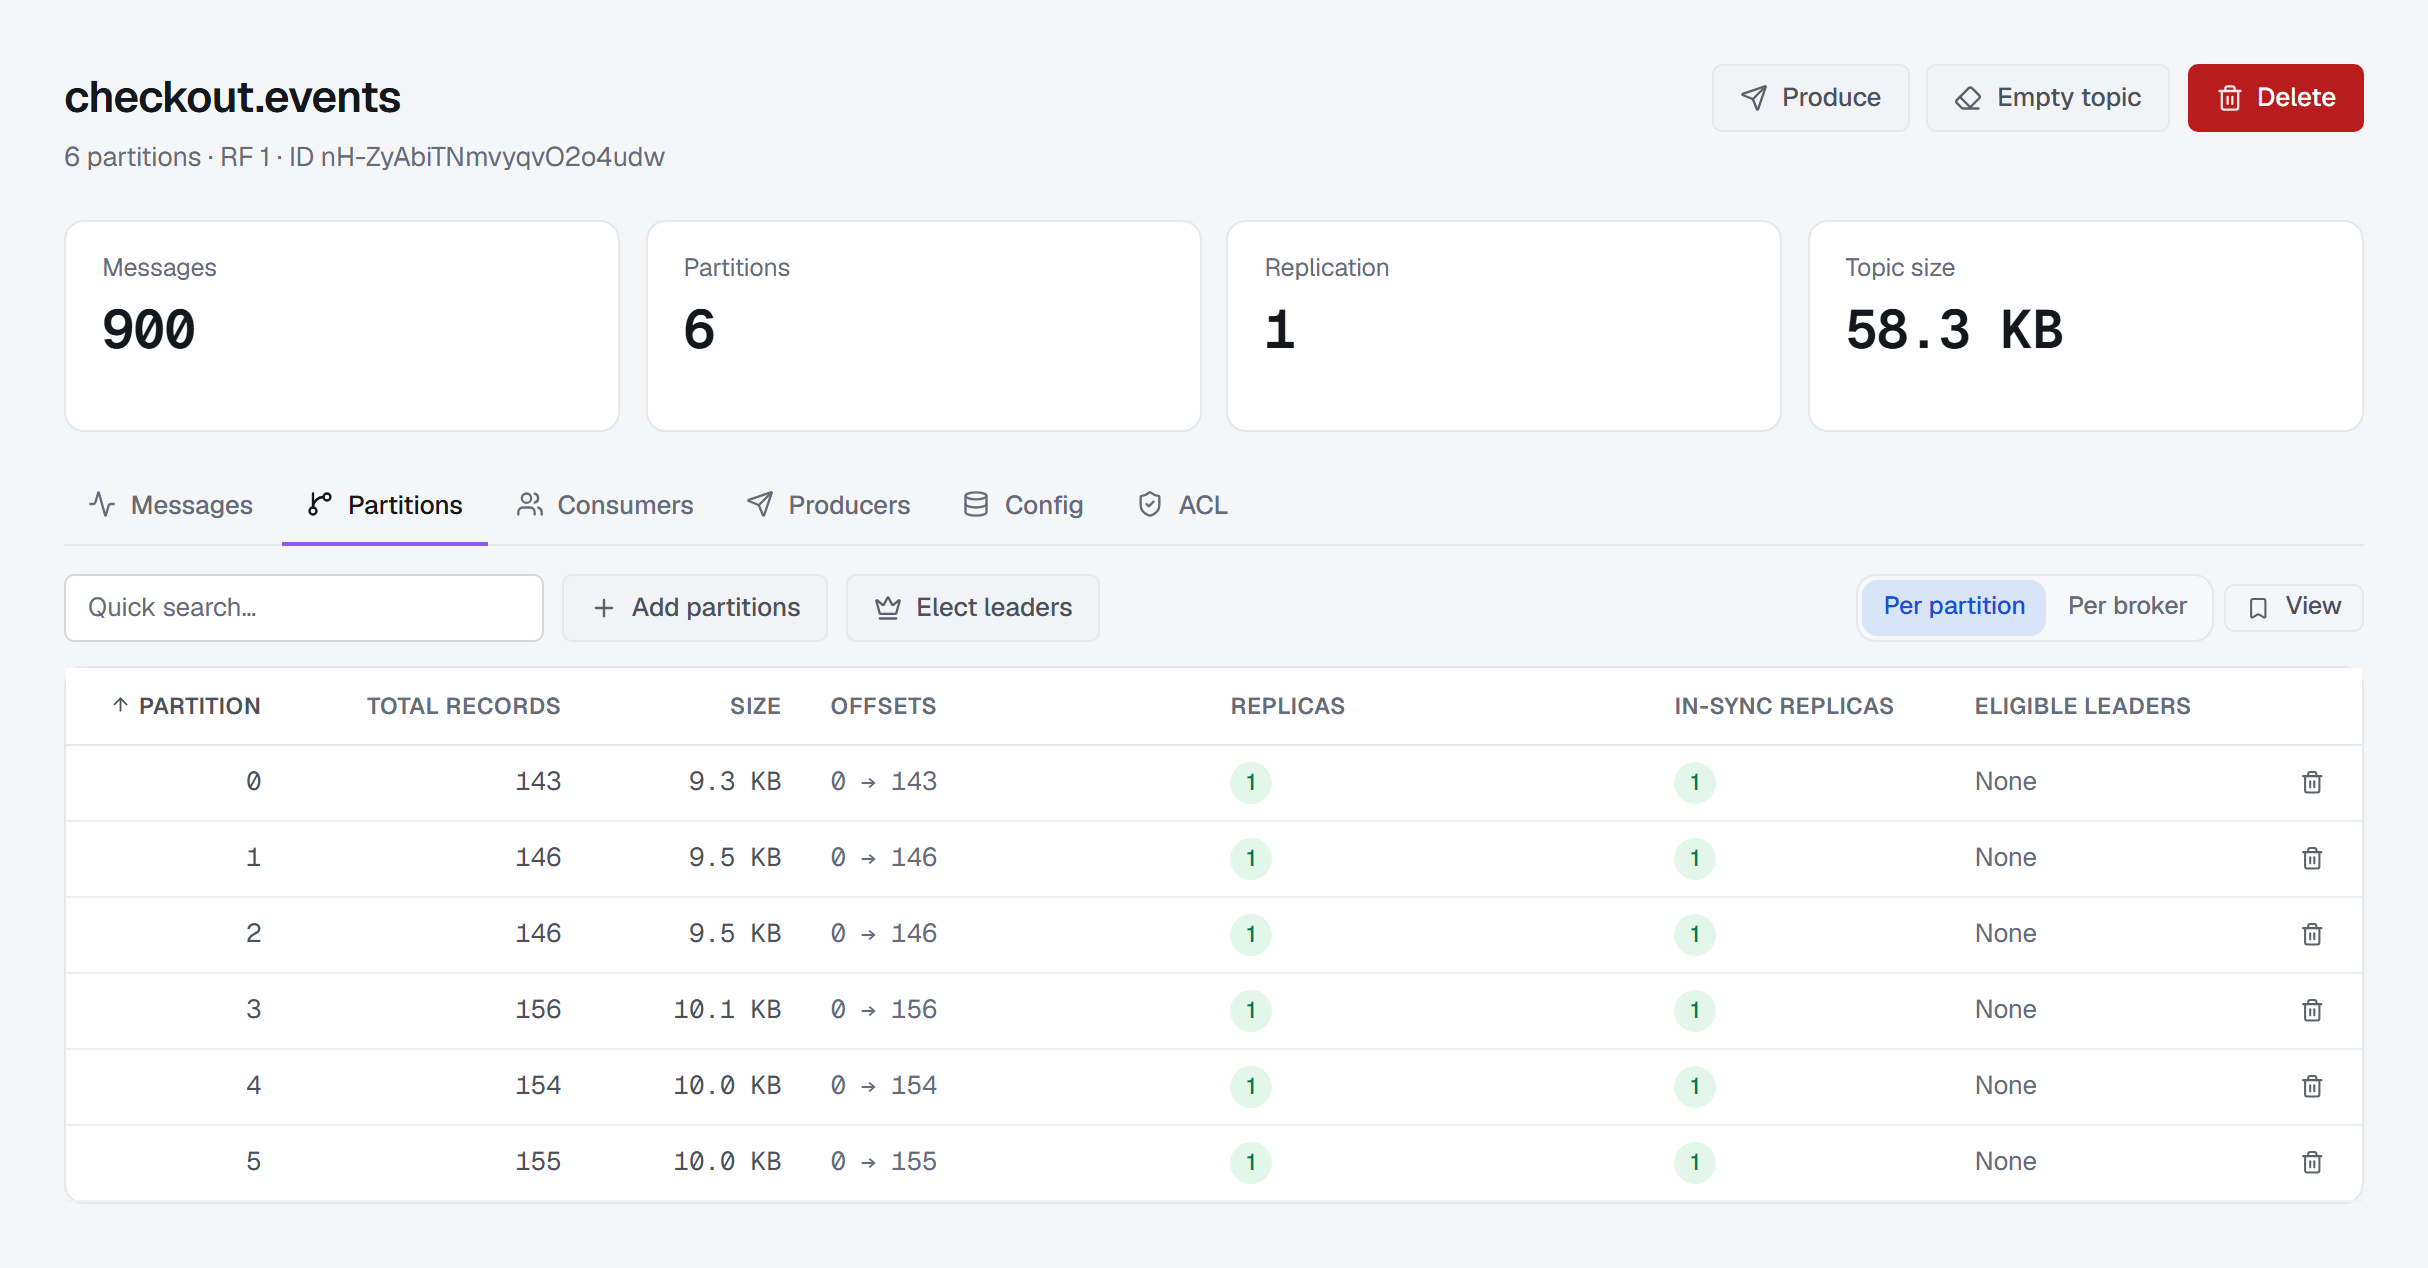
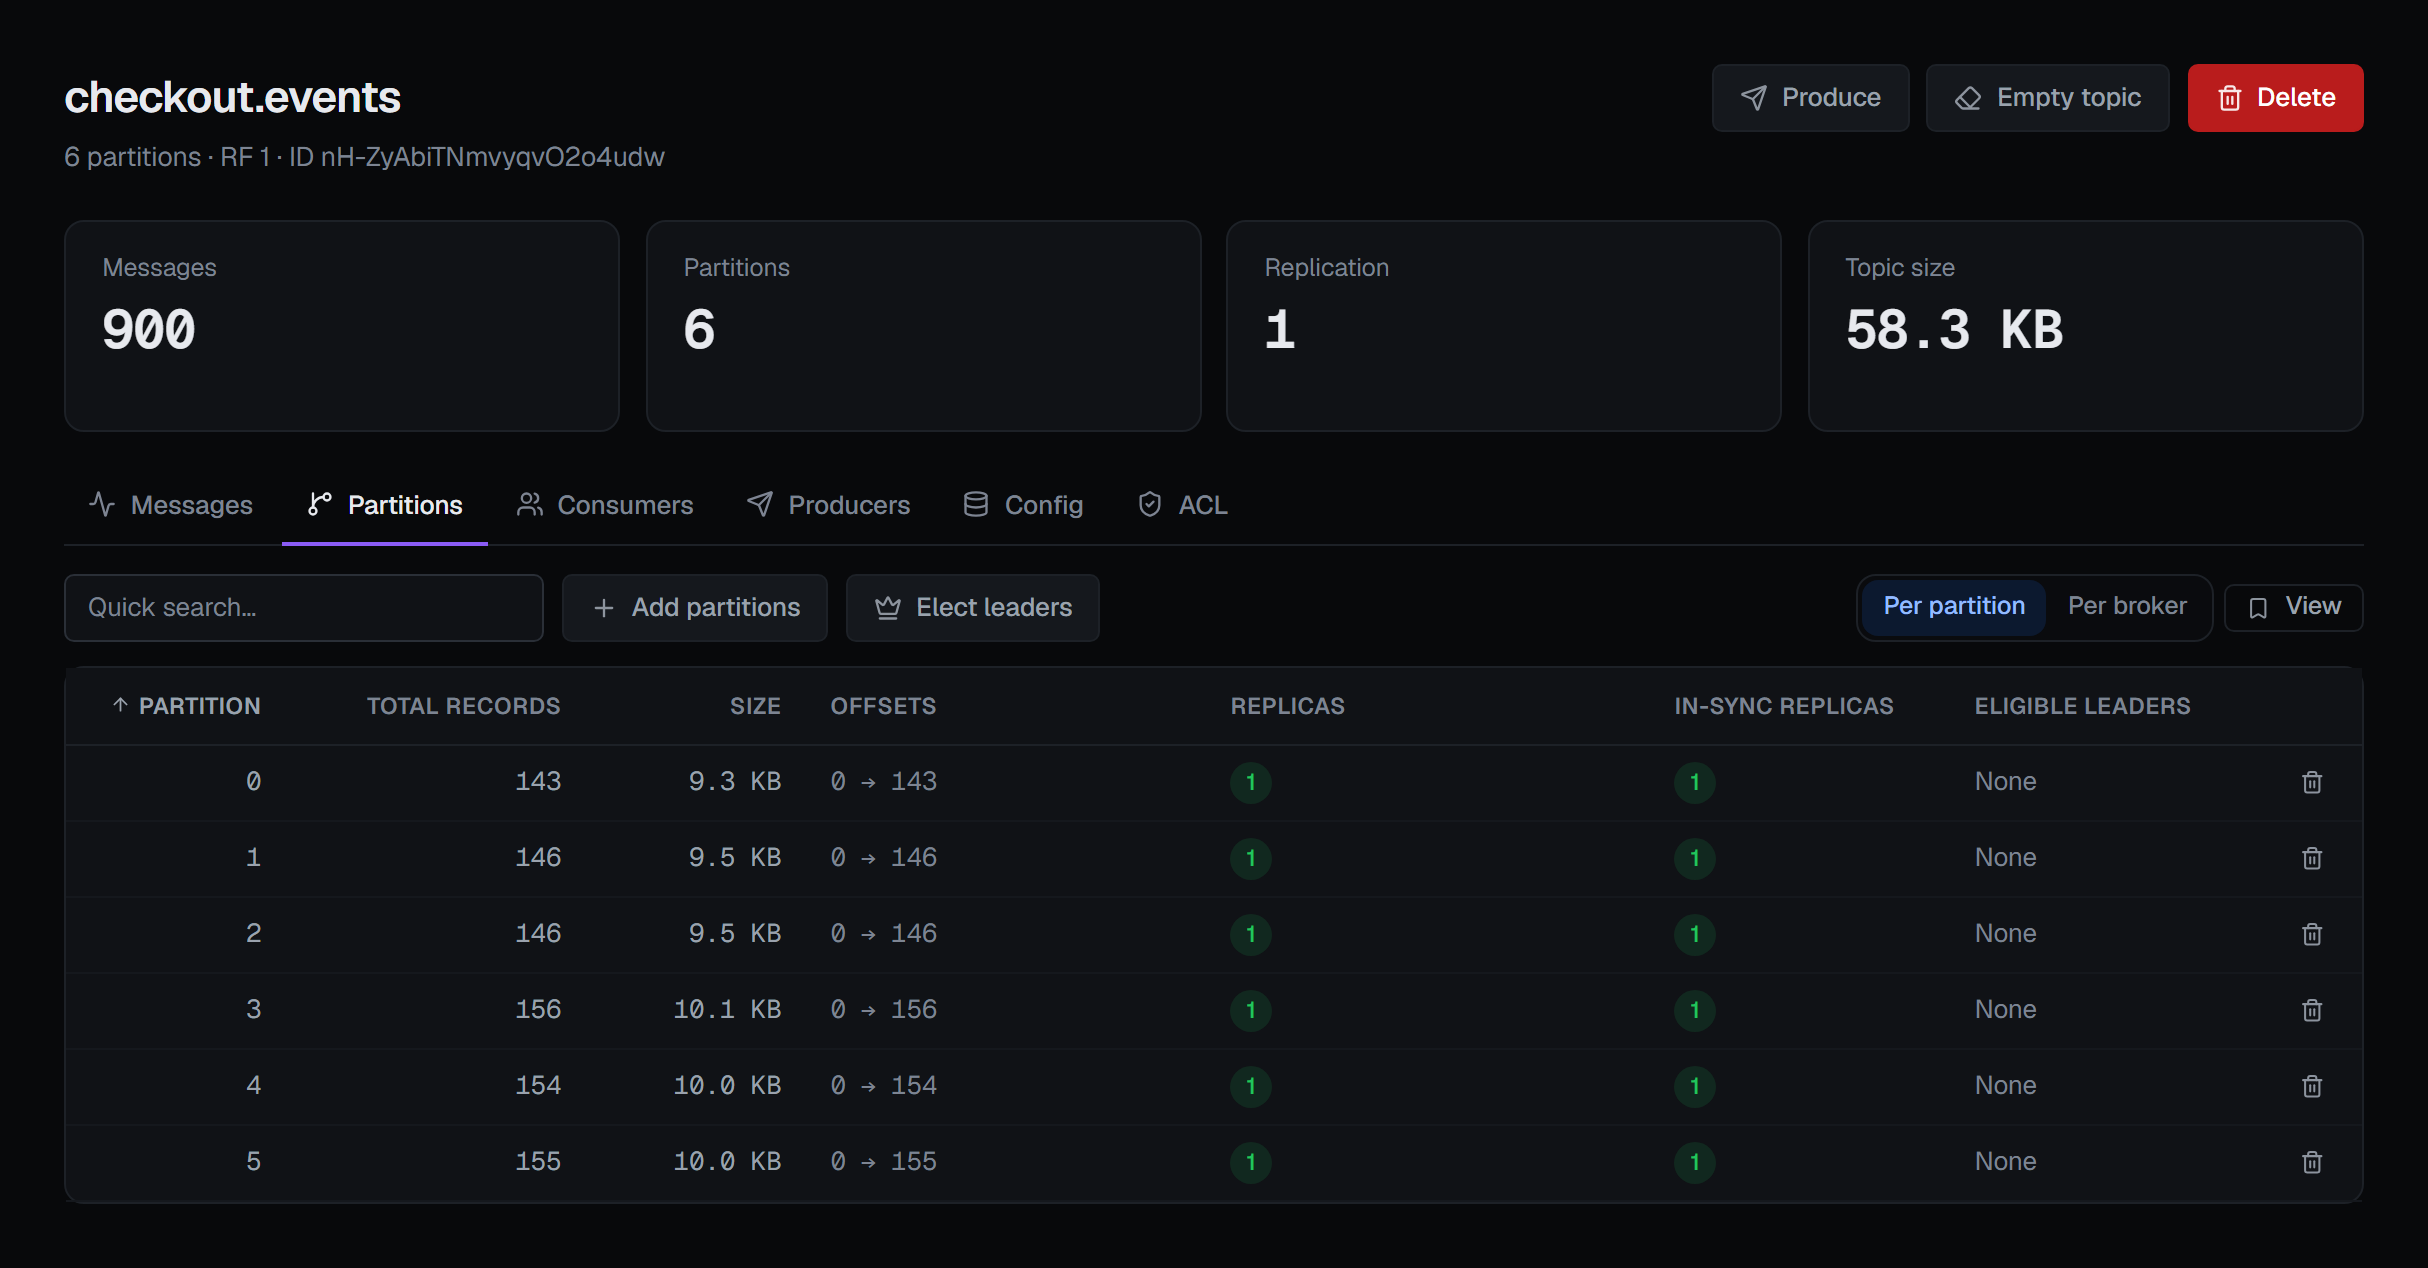
The Partitions tab lists every partition with its Replicas — the leader's id highlighted — and its In-sync replicas. A broker under Replicas and missing from In-sync holds a copy that has fallen behind. Per broker turns the same rows into one per broker, with how many of this topic's partitions each leads and follows: whether the topic is spread evenly, or one broker leads most of it.
5 — Who reads it, and how far behind
Consumer Groups lists every group with its type — ordinary consumer, share or streams — its state, its consume rate, its members and its lag in messages and in time.
Read the lag knowing what it counts. Offset lag sums, over the partitions the group has committed to, the records between its committed position and the end of the log — so a group that has never committed reads zero, which is a zero about nothing. Time lag is the gap between two record timestamps, the newest in the partition and the one at the group's position: how much history is between the group and the end, not how long ago the consumer stopped.
The Signal column flags the two states that look ordinary in every other column. Inactive is a group with committed offsets and no live members: something consumed the topic and nothing is consuming it now — a finished job, a service scaled to zero, or a group left behind by a deployment, and on an inherited cluster usually several of each. Stalled is a group with members whose committed position has not moved while records wait, raised only after readings spanning at least a minute agree.
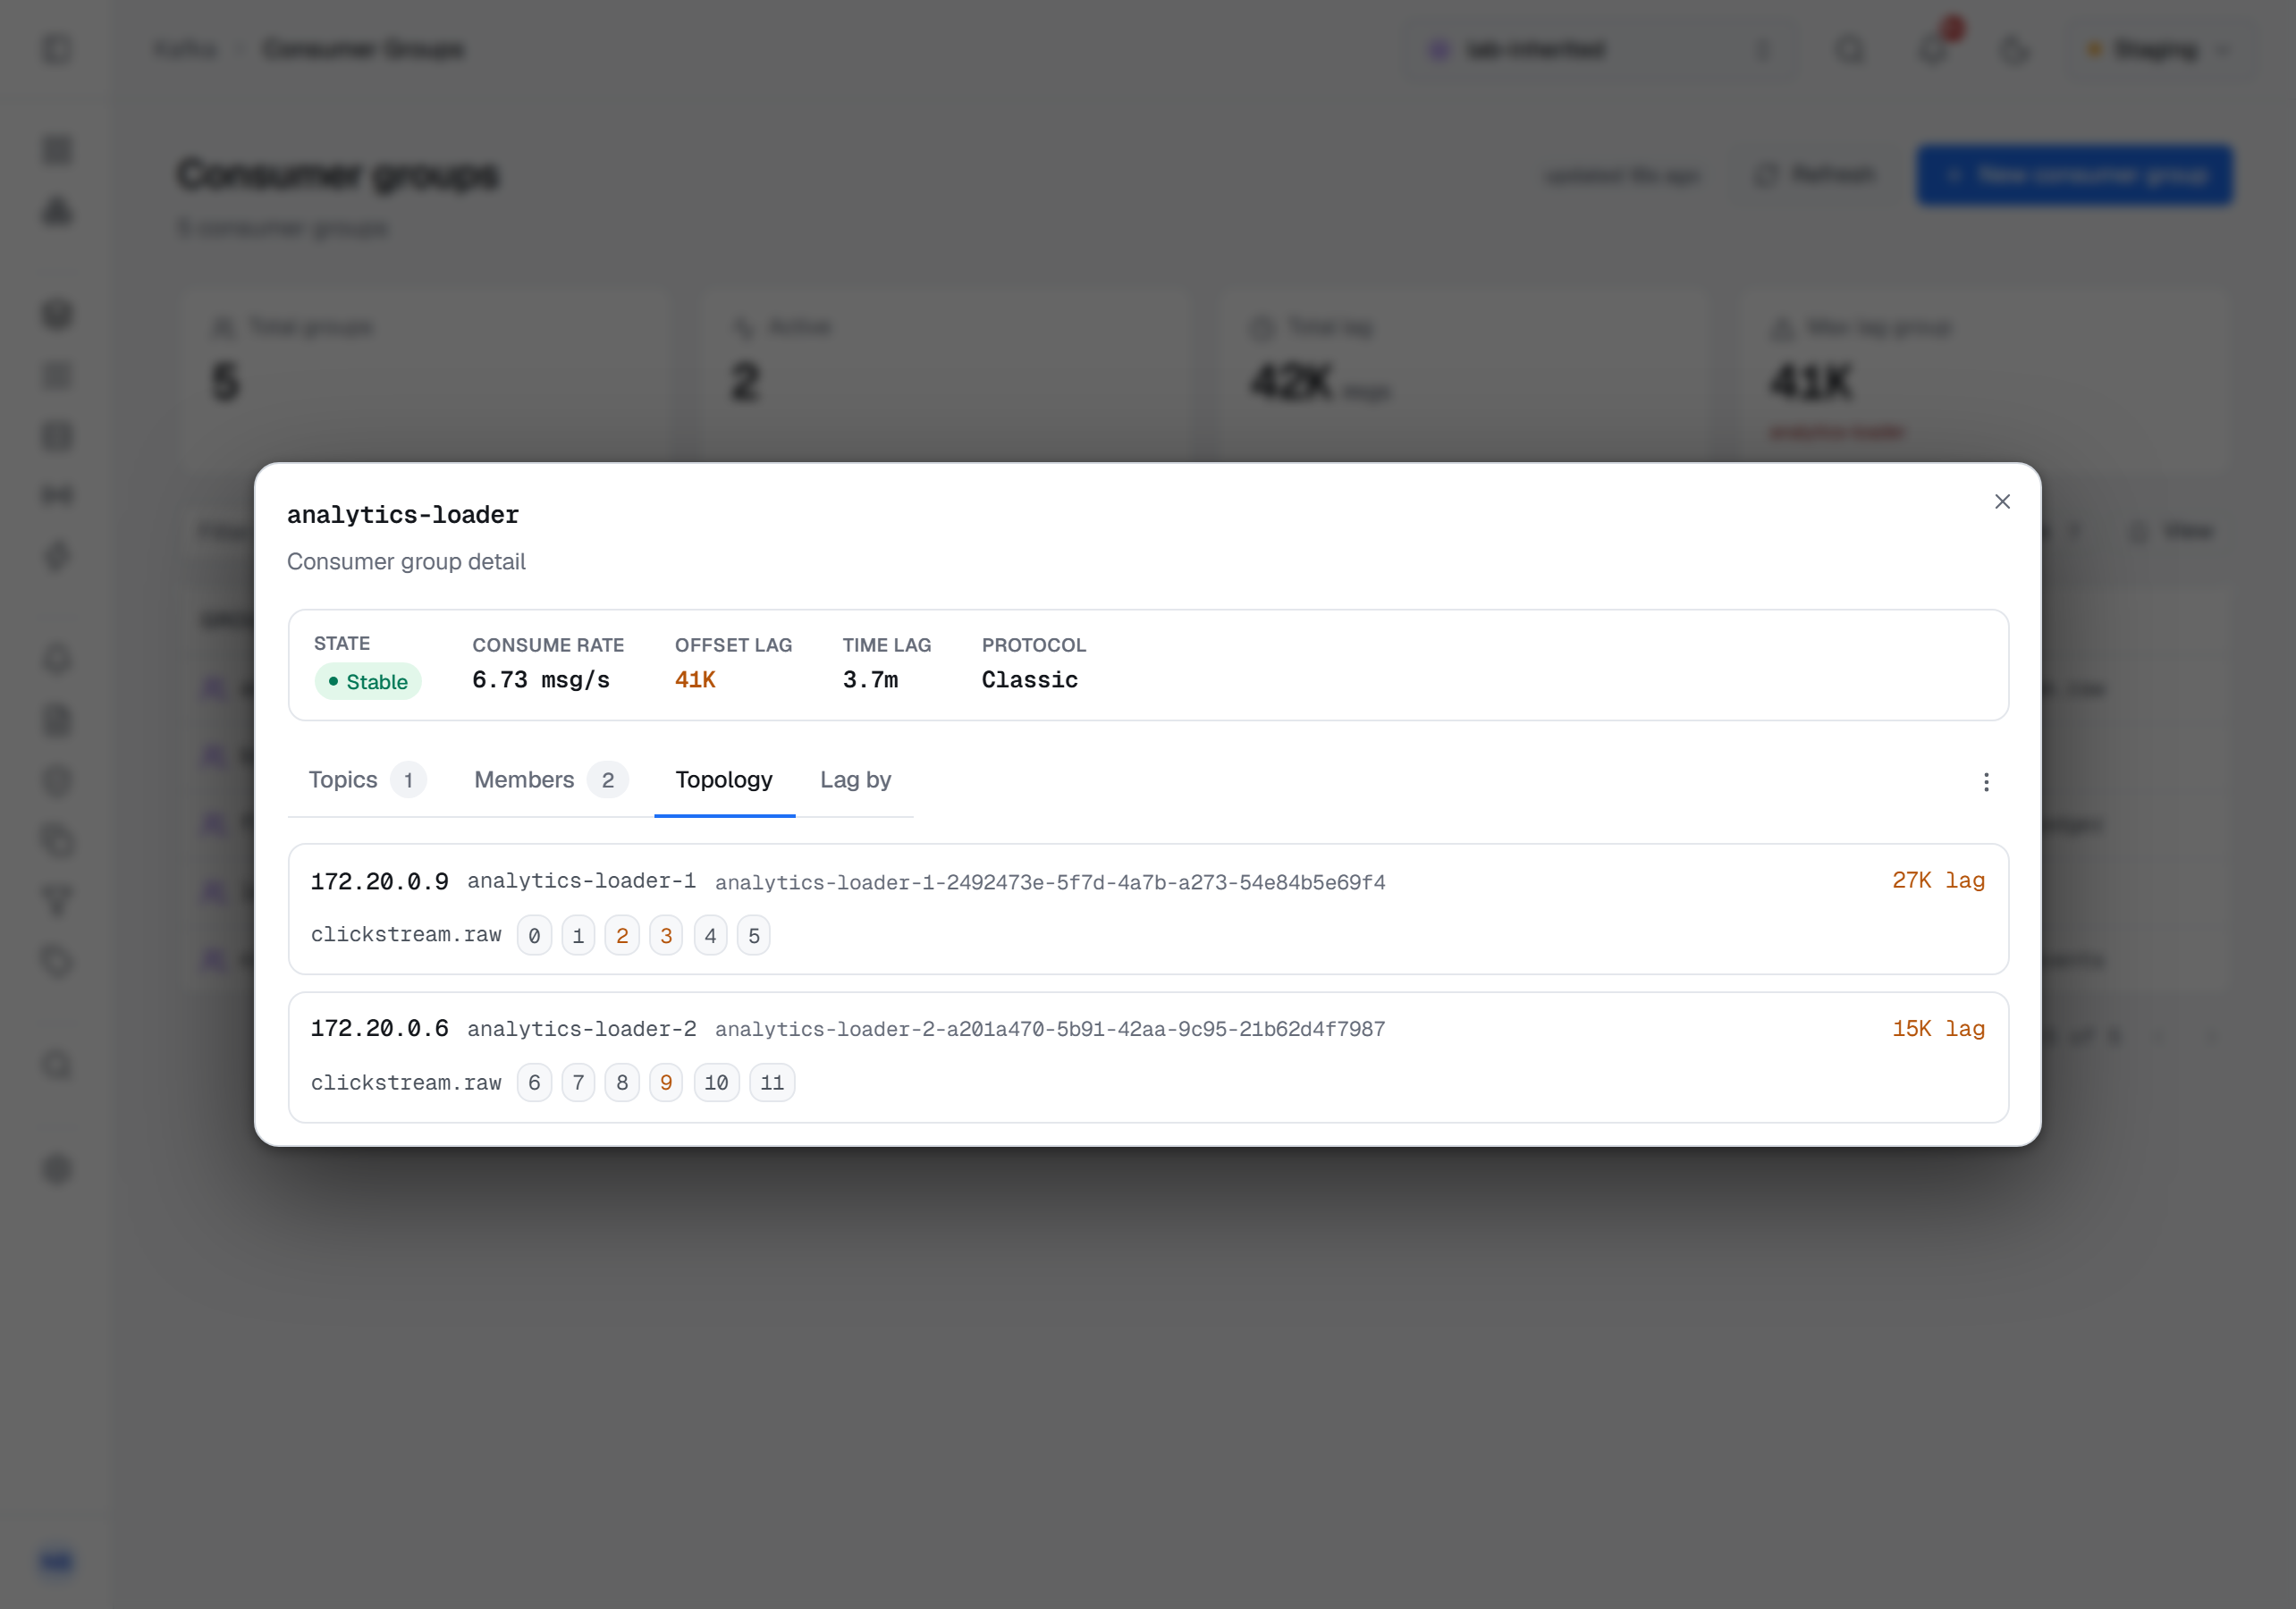
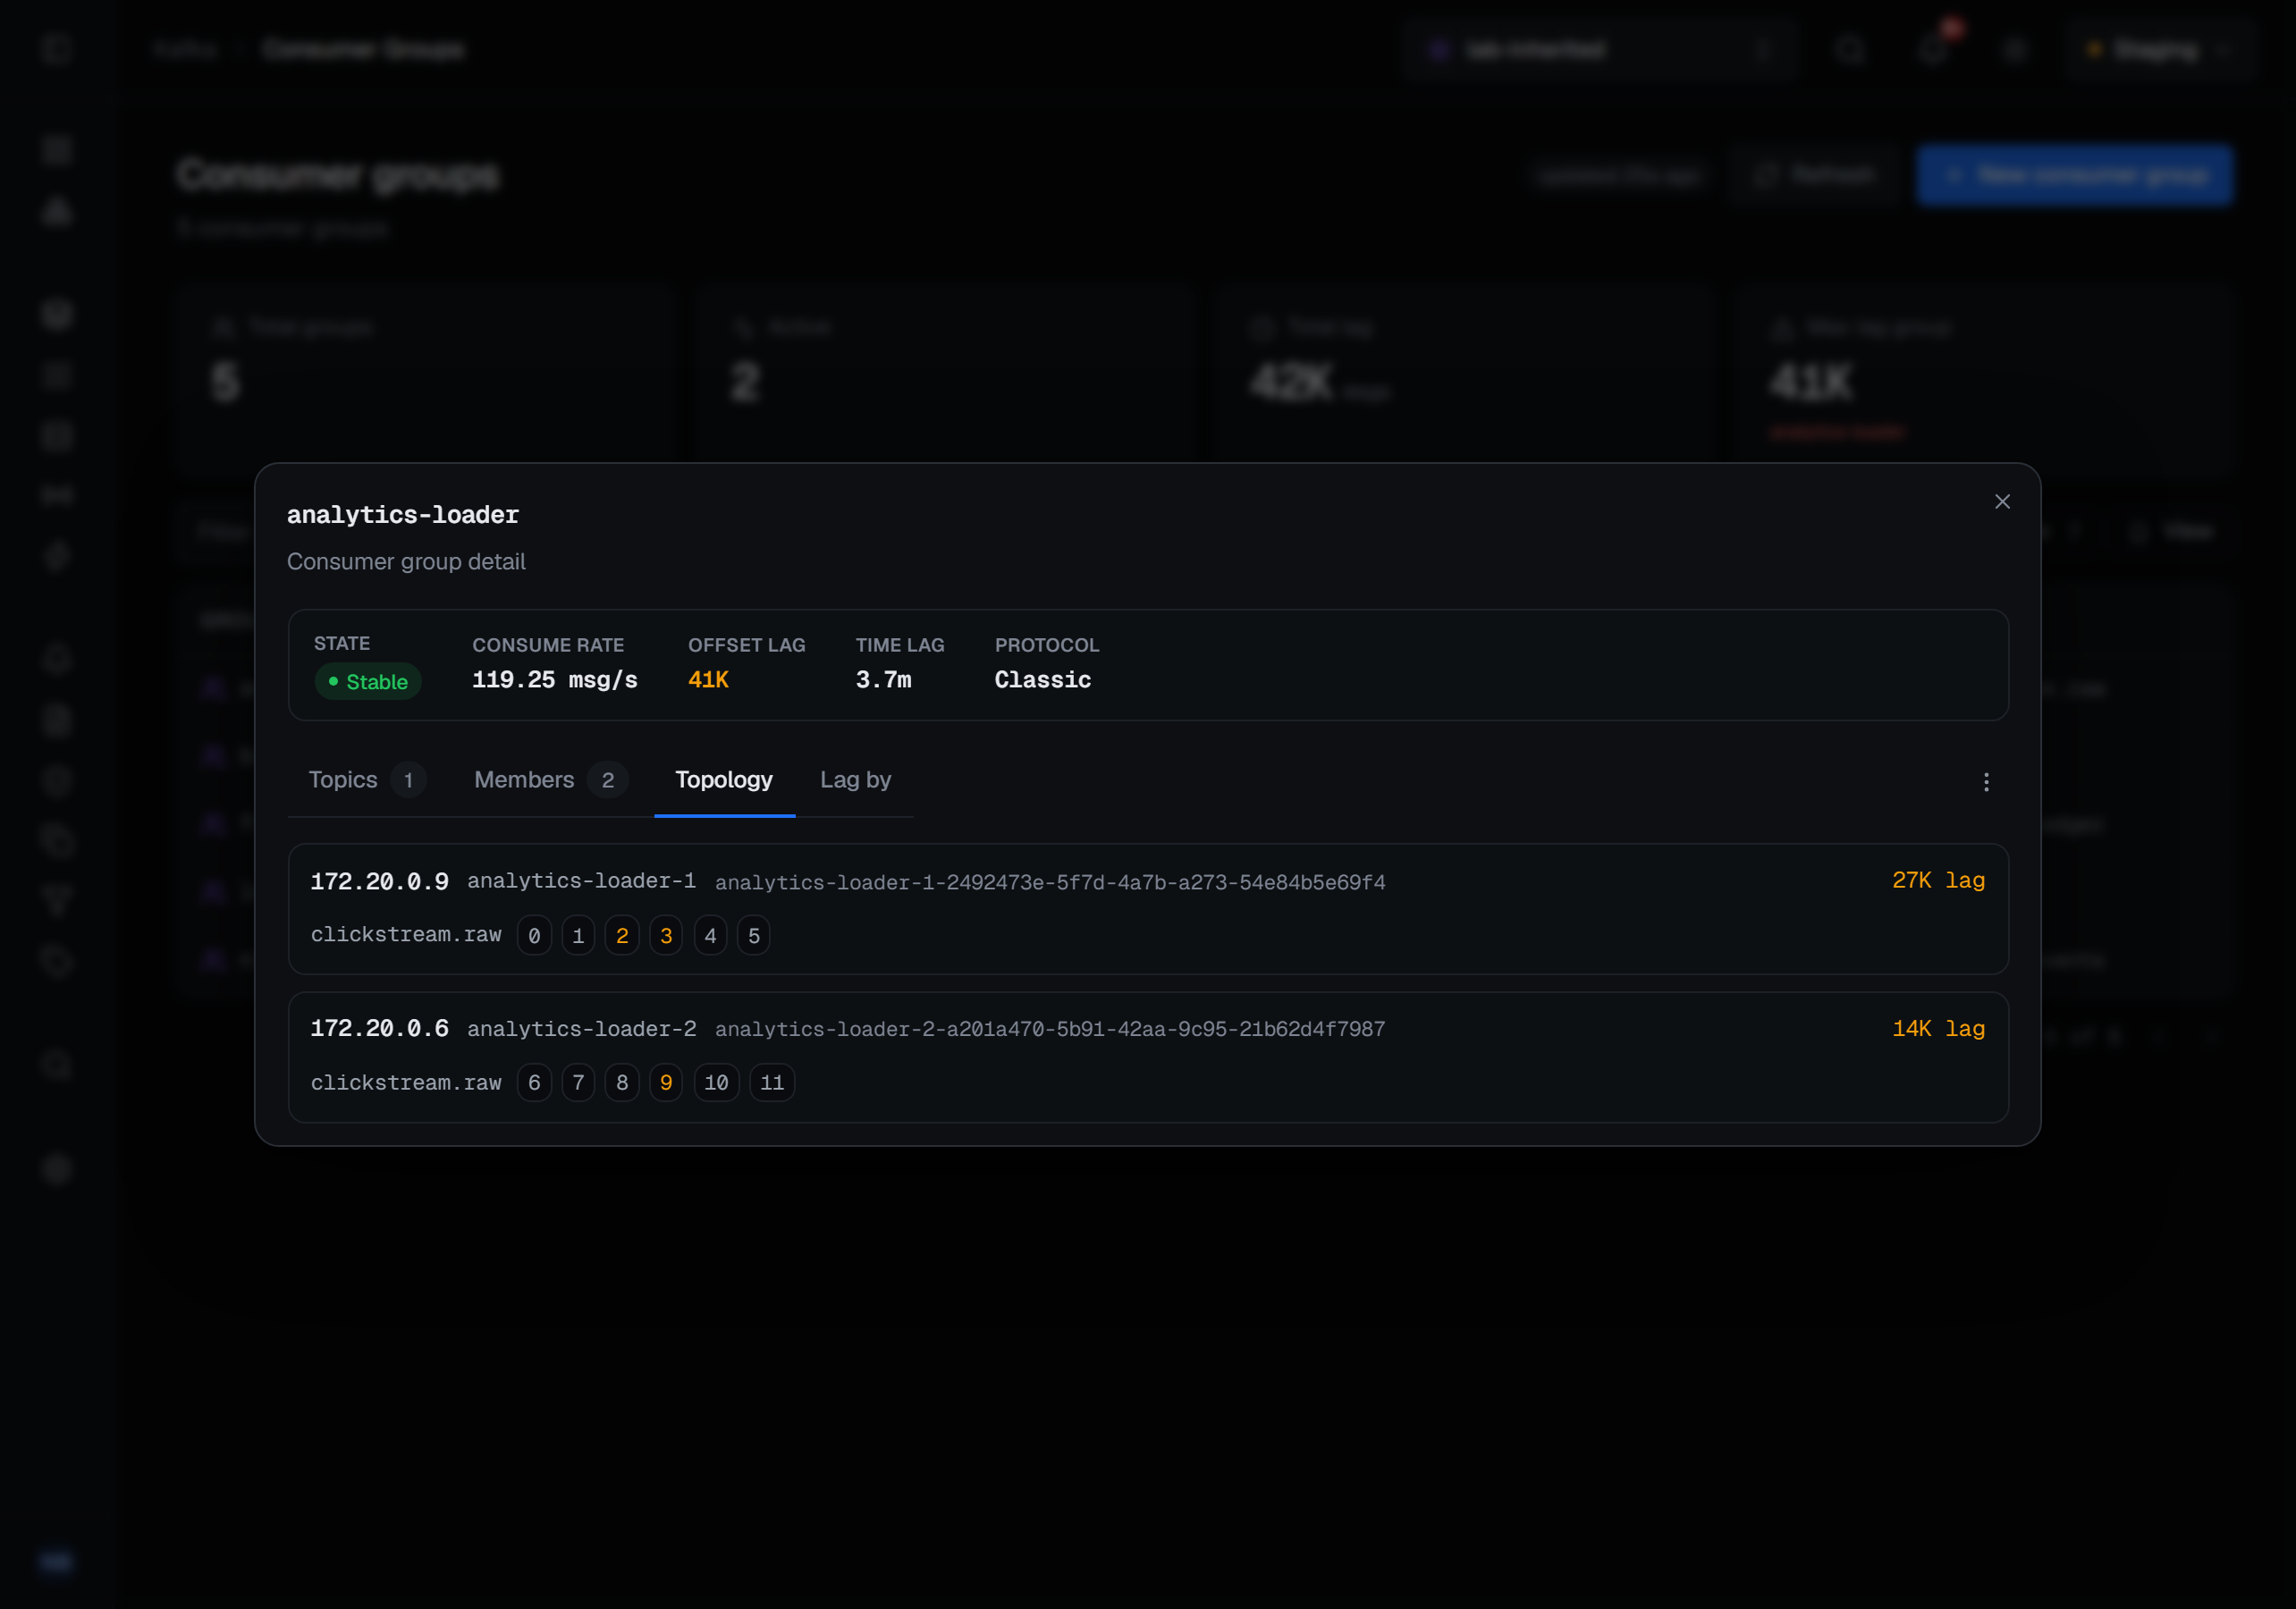
A group's detail shows which consumer instance carries which part of the lag. Members lists each live member with its host and client id; Topology draws one card per member holding the partitions it owns, with committed partitions no live member holds under Unassigned; Lag by sums the same lag by topic, by broker or by member host.
6 — Who may do what
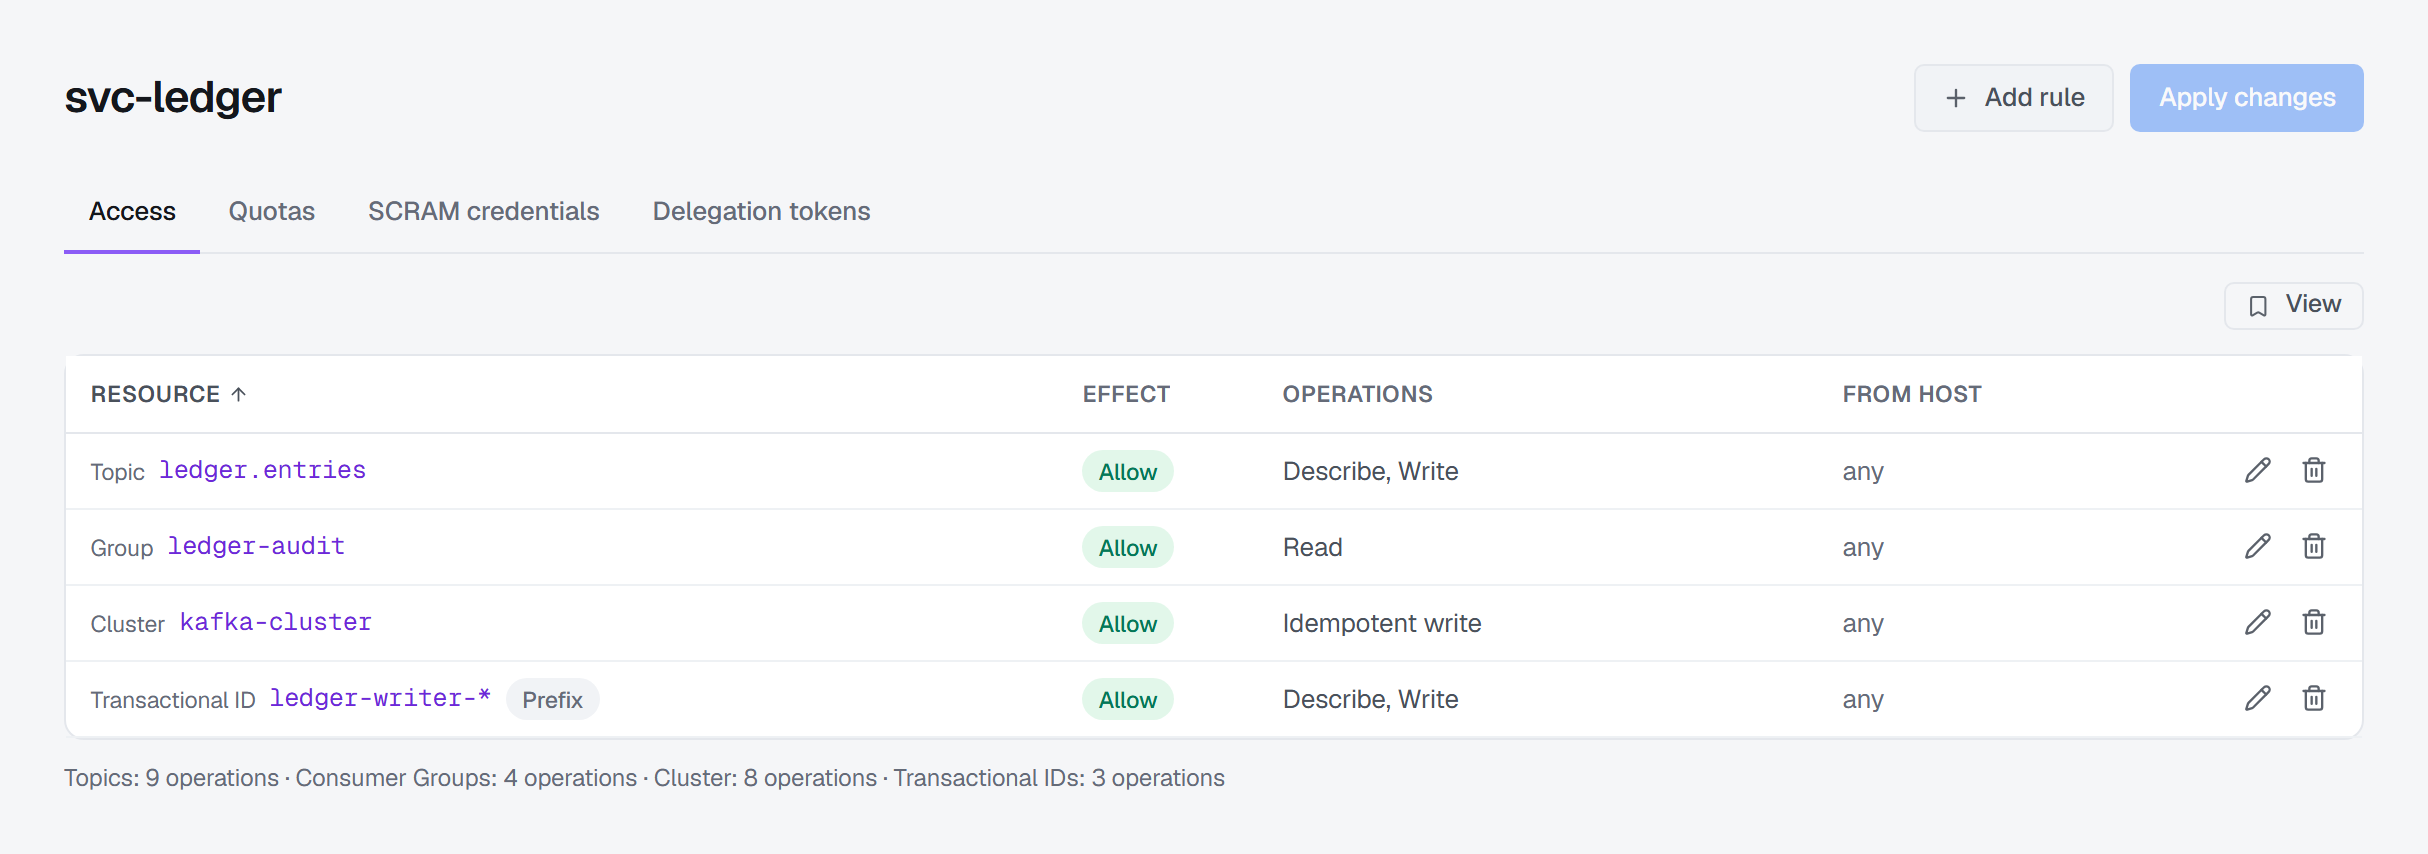
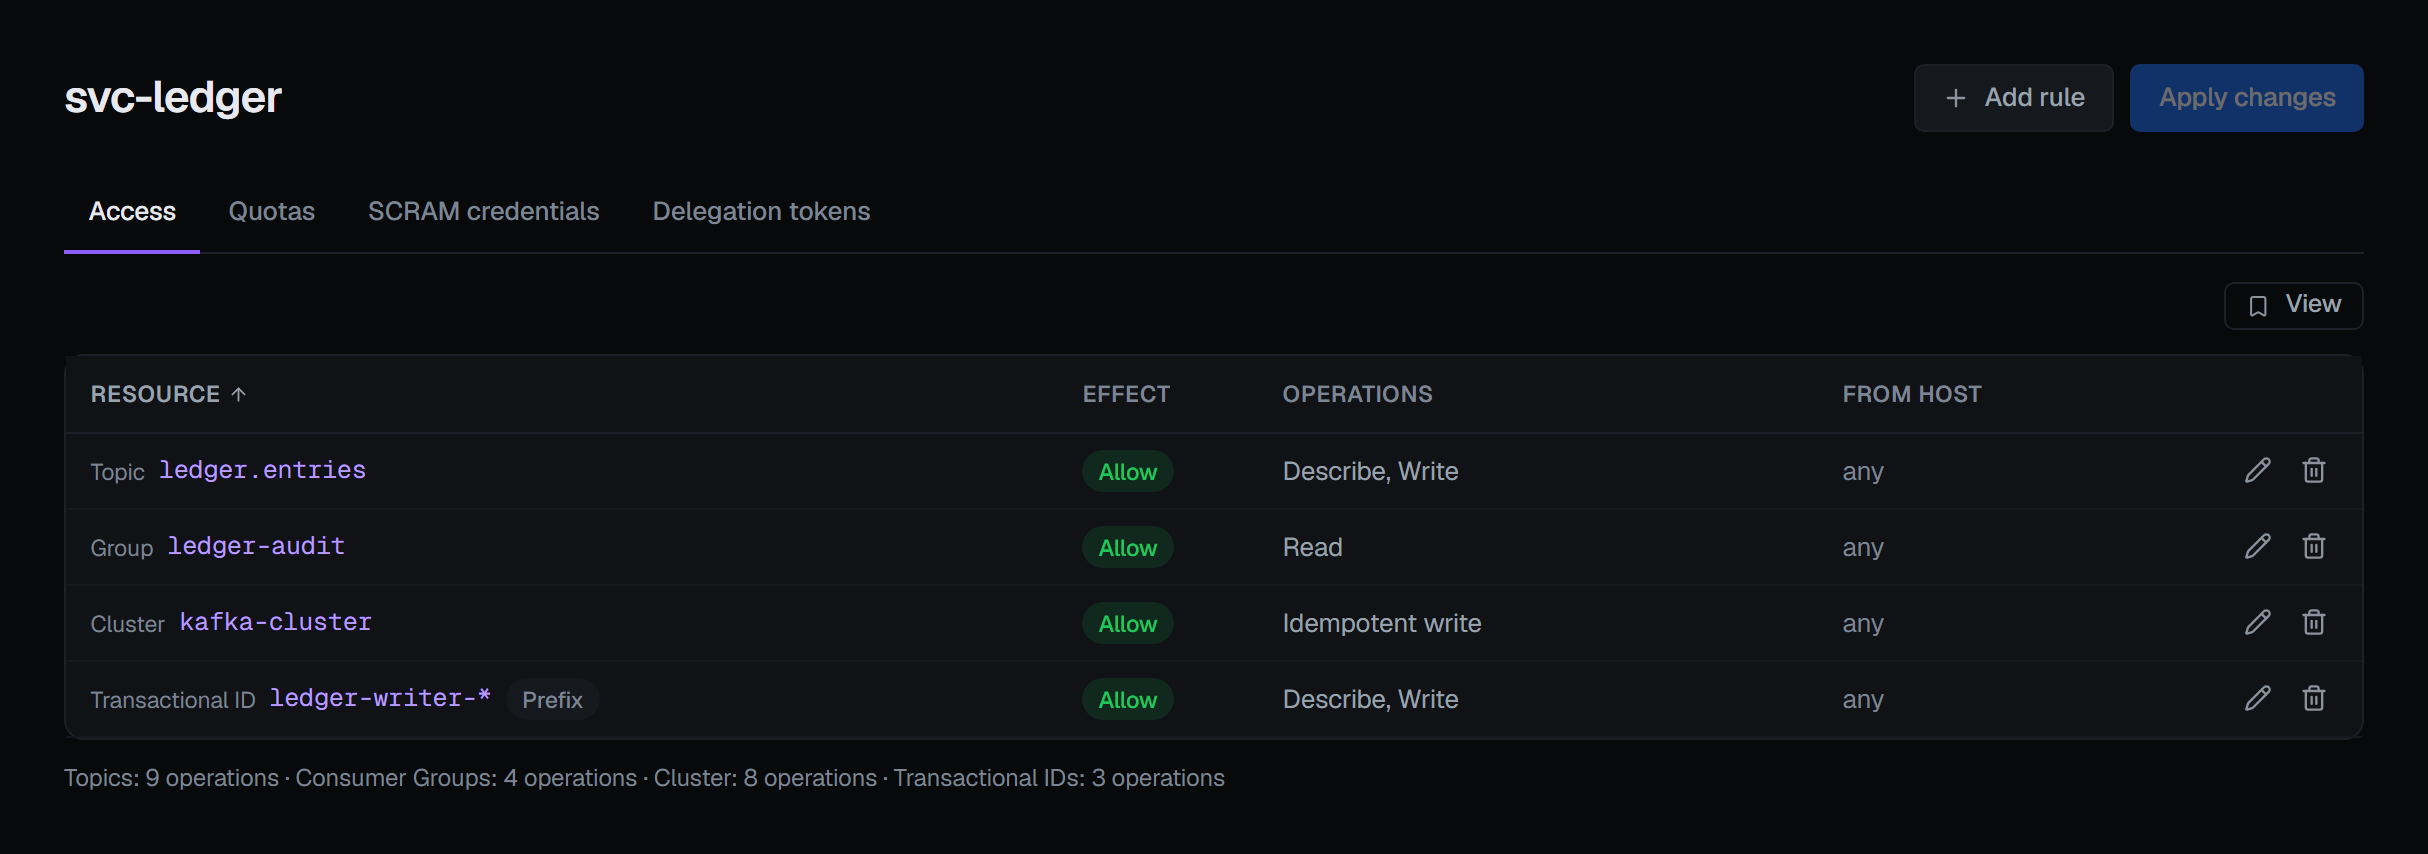
Kafka's own permissions are its ACLs, and they are separate from BROKA's roles: nothing set in one affects
the other. Kafka has no service-account object, so Service Accounts lists the distinct principals that
appear in the cluster's ACLs — a list that is always the cluster's own, never a registry that can drift
from it. A principal's Access tab reads each rule as one sentence: this resource, allowed or denied, for
these operations, from this host. Denies sort to the top, because a deny is the rule that explains why
something does not work, and a rule on a name ending in * carries a Prefix badge.
The other direction — who can reach this topic — is a topic's ACL tab, which lists every rule that applies to it, including a prefix rule that covers it without naming it. If the cluster runs no authorizer, BROKA finds out and says so on the disabled action; an empty ACL tab then means no rules, because there are none to have.
7 — Schemas and connectors, if they are there
A Schema Registry and Kafka Connect clusters are registered against the Kafka connection, from its row in the connections list. Until one is, Schema Registry and Connect in the navigation are greyed out, and hovering says that none is configured for this connection — which tells you what BROKA has been given, not whether the estate runs one. Ask, and register what you find.
Once registered, the registry's list opens on a summary line with its subjects and its global
compatibility level, and Connect lists each connector with its own state and its count of failed tasks. A
connector reading RUNNING with one failed task is not a display error — it is the most common real
failure in Connect, and the reason the two are reported separately.
What this hour changes, and what is recorded
Nothing in this order is a write. Every screen above reads, and the actions on them — configuration changes, reassignments, offset resets, ACL edits — are refused on a read-only connection whatever your role. When the hour is over and the switch is turned off, each of those writes needs the permission to manage the cluster, asks for what its kind of change needs — a preview before a configuration change, a reason before an irreversible one — and is recorded in the audit trail with what changed. The Kafka page describes the rest of the screens.
What this article does not cover
- Changing anything. Rebalancing partitions, electing leaders, resetting offsets and editing ACLs each have their own page; this is the hour before them.
- Transactions, quotas and client metrics. Open transactions, client quotas and client-metric subscriptions are worth a look on a cluster you inherited, and have their own screens.
- Reading messages. What a topic holds, record by record, is the consume browser's subject.
Try it yourself
The inherited-kafka lab starts a three-broker Kafka cluster with uneven partitions and leaders, a drifted and a dynamic broker setting, single-replica and overridden topics, groups nobody runs any more, ACLs and a Schema Registry, so the whole first hour can be read against a live cluster.
Applies to BROKA 1.0 · Kafka · Community and Commercial.