

Overview
Updated 29 September 2026 · applies to 1.0.0 · Commercial
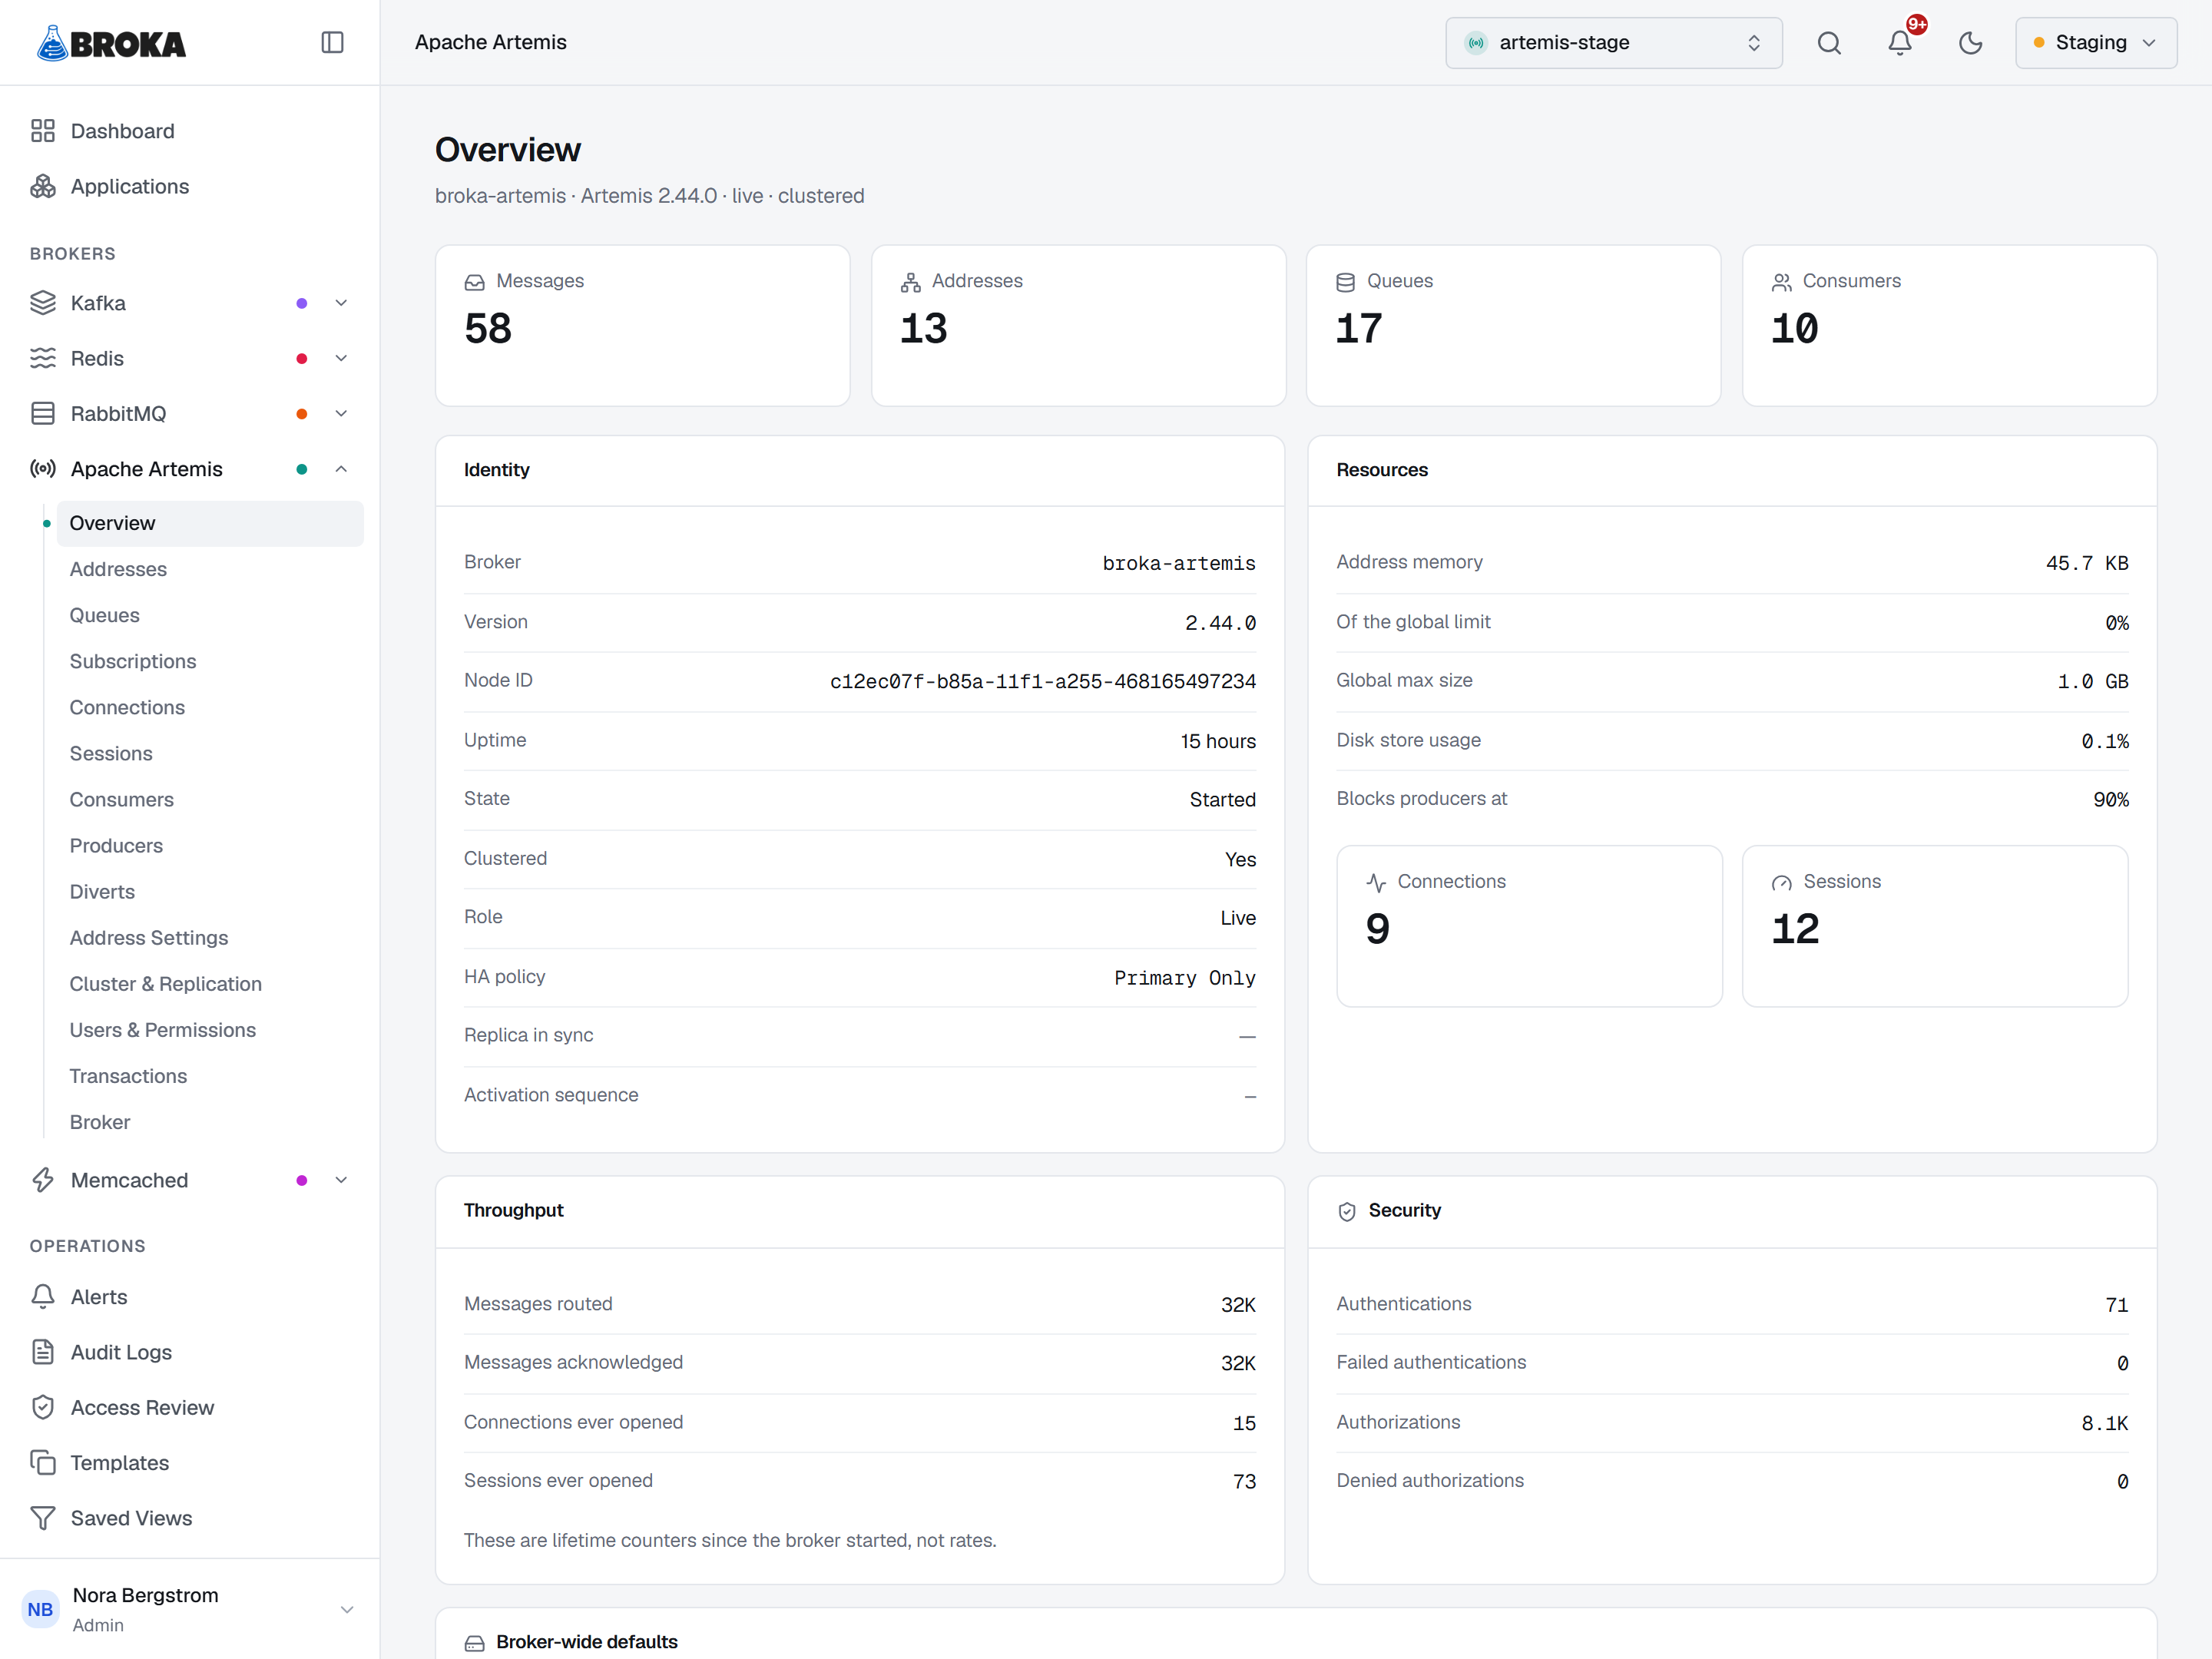
An Apache Artemis broker — formerly ActiveMQ Artemis — as it describes itself, read live. Nothing on this screen is stored, sampled or averaged — each figure is what the broker answered when the page last asked.
A dash is an answer
Every number here can render as —, and that is the most important convention on the page.
BROKA reads the broker's attributes as a batch of individual requests, so an attribute a particular Artemis version does not expose comes back missing rather than taking the whole screen down with it. A missing attribute is shown as a dash, never as a zero.
The distinction is not pedantic. 0 connections and "the broker did not report connections" look
identical on most consoles and mean opposite things — one is a measurement you can act on, the other
is silence. Where the page knows why a value is missing — the message total, the node's role, the two
replication rows — hovering the dash says so.
Identity: started, active and live are three questions
The header names the broker, its version, and whether it is a live node or a backup. The Identity card takes that apart, because on a clustered broker the obvious reading is the wrong one.
- State distinguishes Started from Started (passive). A passive backup is running normally and serving nothing; that is its job, not a fault.
- Role is Live or Backup — and if the broker did not report it, a dash, because guessing here changes what an operator does next.
- Replica in sync is only meaningful on a backup. On a live node the field describes nothing and is shown as a dash rather than "No", which would read as a fault on a healthy broker.
- Activation sequence is blank on a broker with no HA configured. Artemis reports
-1there, which is not a sequence number; printing it would invite a comparison against another node's real one.
One state interrupts the page. If this node is a backup and its replica is not in sync, a warning sits above everything else: a failover from here would lose whatever has not replicated yet. It is the only condition on the screen that cannot wait for the reader to scroll to the right card.
Addresses and queues are counted separately, on purpose
The row of tiles at the top counts messages, addresses, queues and consumers — and addresses and queues are two tiles, not one. Artemis routes to an address; queues are bound underneath it. Six messages sent to one anycast address are shared out across the queues bound to it, not copied to each — so a single "destinations" figure would answer neither question an operator has.
This is the model the whole section is built on, and it is why Addresses sits above Queues in the tree rather than the other way round.
Resources: the two numbers that stop producers
Address memory and disk store usage are shown next to the limits they are measured against — the global max size, and the disk percentage at which the broker blocks producers. The same card counts the connections and sessions open now.
That last one is the point of the card. When a producer hangs and nobody can say why, it is usually because the broker crossed a threshold that was configured once and never looked at again. Showing usage without the threshold would leave the reader to find it elsewhere; showing both makes it one glance.
Throughput is a set of lifetime counters, and says so
Messages routed, messages acknowledged, connections and sessions ever opened. These are totals since the broker started — not rates — and the card states it in as many words rather than leaving the reader to infer it from a number that only ever grows.
Security counters mean nothing while security is off
Four counters: successful and failed authentications, successful and denied authorizations.
If the broker has security disabled, it authenticates and authorizes nothing, so all four sit at zero no matter how many clients connect. Read without context, that is the most reassuring screen in the product and it is describing a broker that checks nobody.
So the card leads with the state. With security off it says plainly that the counters below will stay at zero because nothing is being checked, and the card's icon changes with it.
Broker-wide defaults
Where a message goes when it cannot be delivered (the dead-letter address), where it goes when it expires (the expiry address), and how many delivery attempts are made first.
The delivery-attempt limit reads — unless it has been configured: the broker leaves it out of its
defaults otherwise, and the page does not print Artemis's built-in value in its place.
These are the broker's defaults. Individual addresses can override all three — that is what Address settings is for, and it is where you look when one address behaves differently from the rest of the broker.