

Alerts
Updated 6 October 2026 · applies to 1.0.1 · Community and Commercial
A rule watches one figure on one part of your estate and opens an incident when it stops being true. BROKA evaluates those rules on a schedule, across every platform it serves, and tells whoever you have told it to tell.
Alerting is in both editions, with no quota. Two parts of it are Commercial: rules scoped to an application, and the Slack, Microsoft Teams and webhook channels. E-mail and the console are in both.
The four tabs
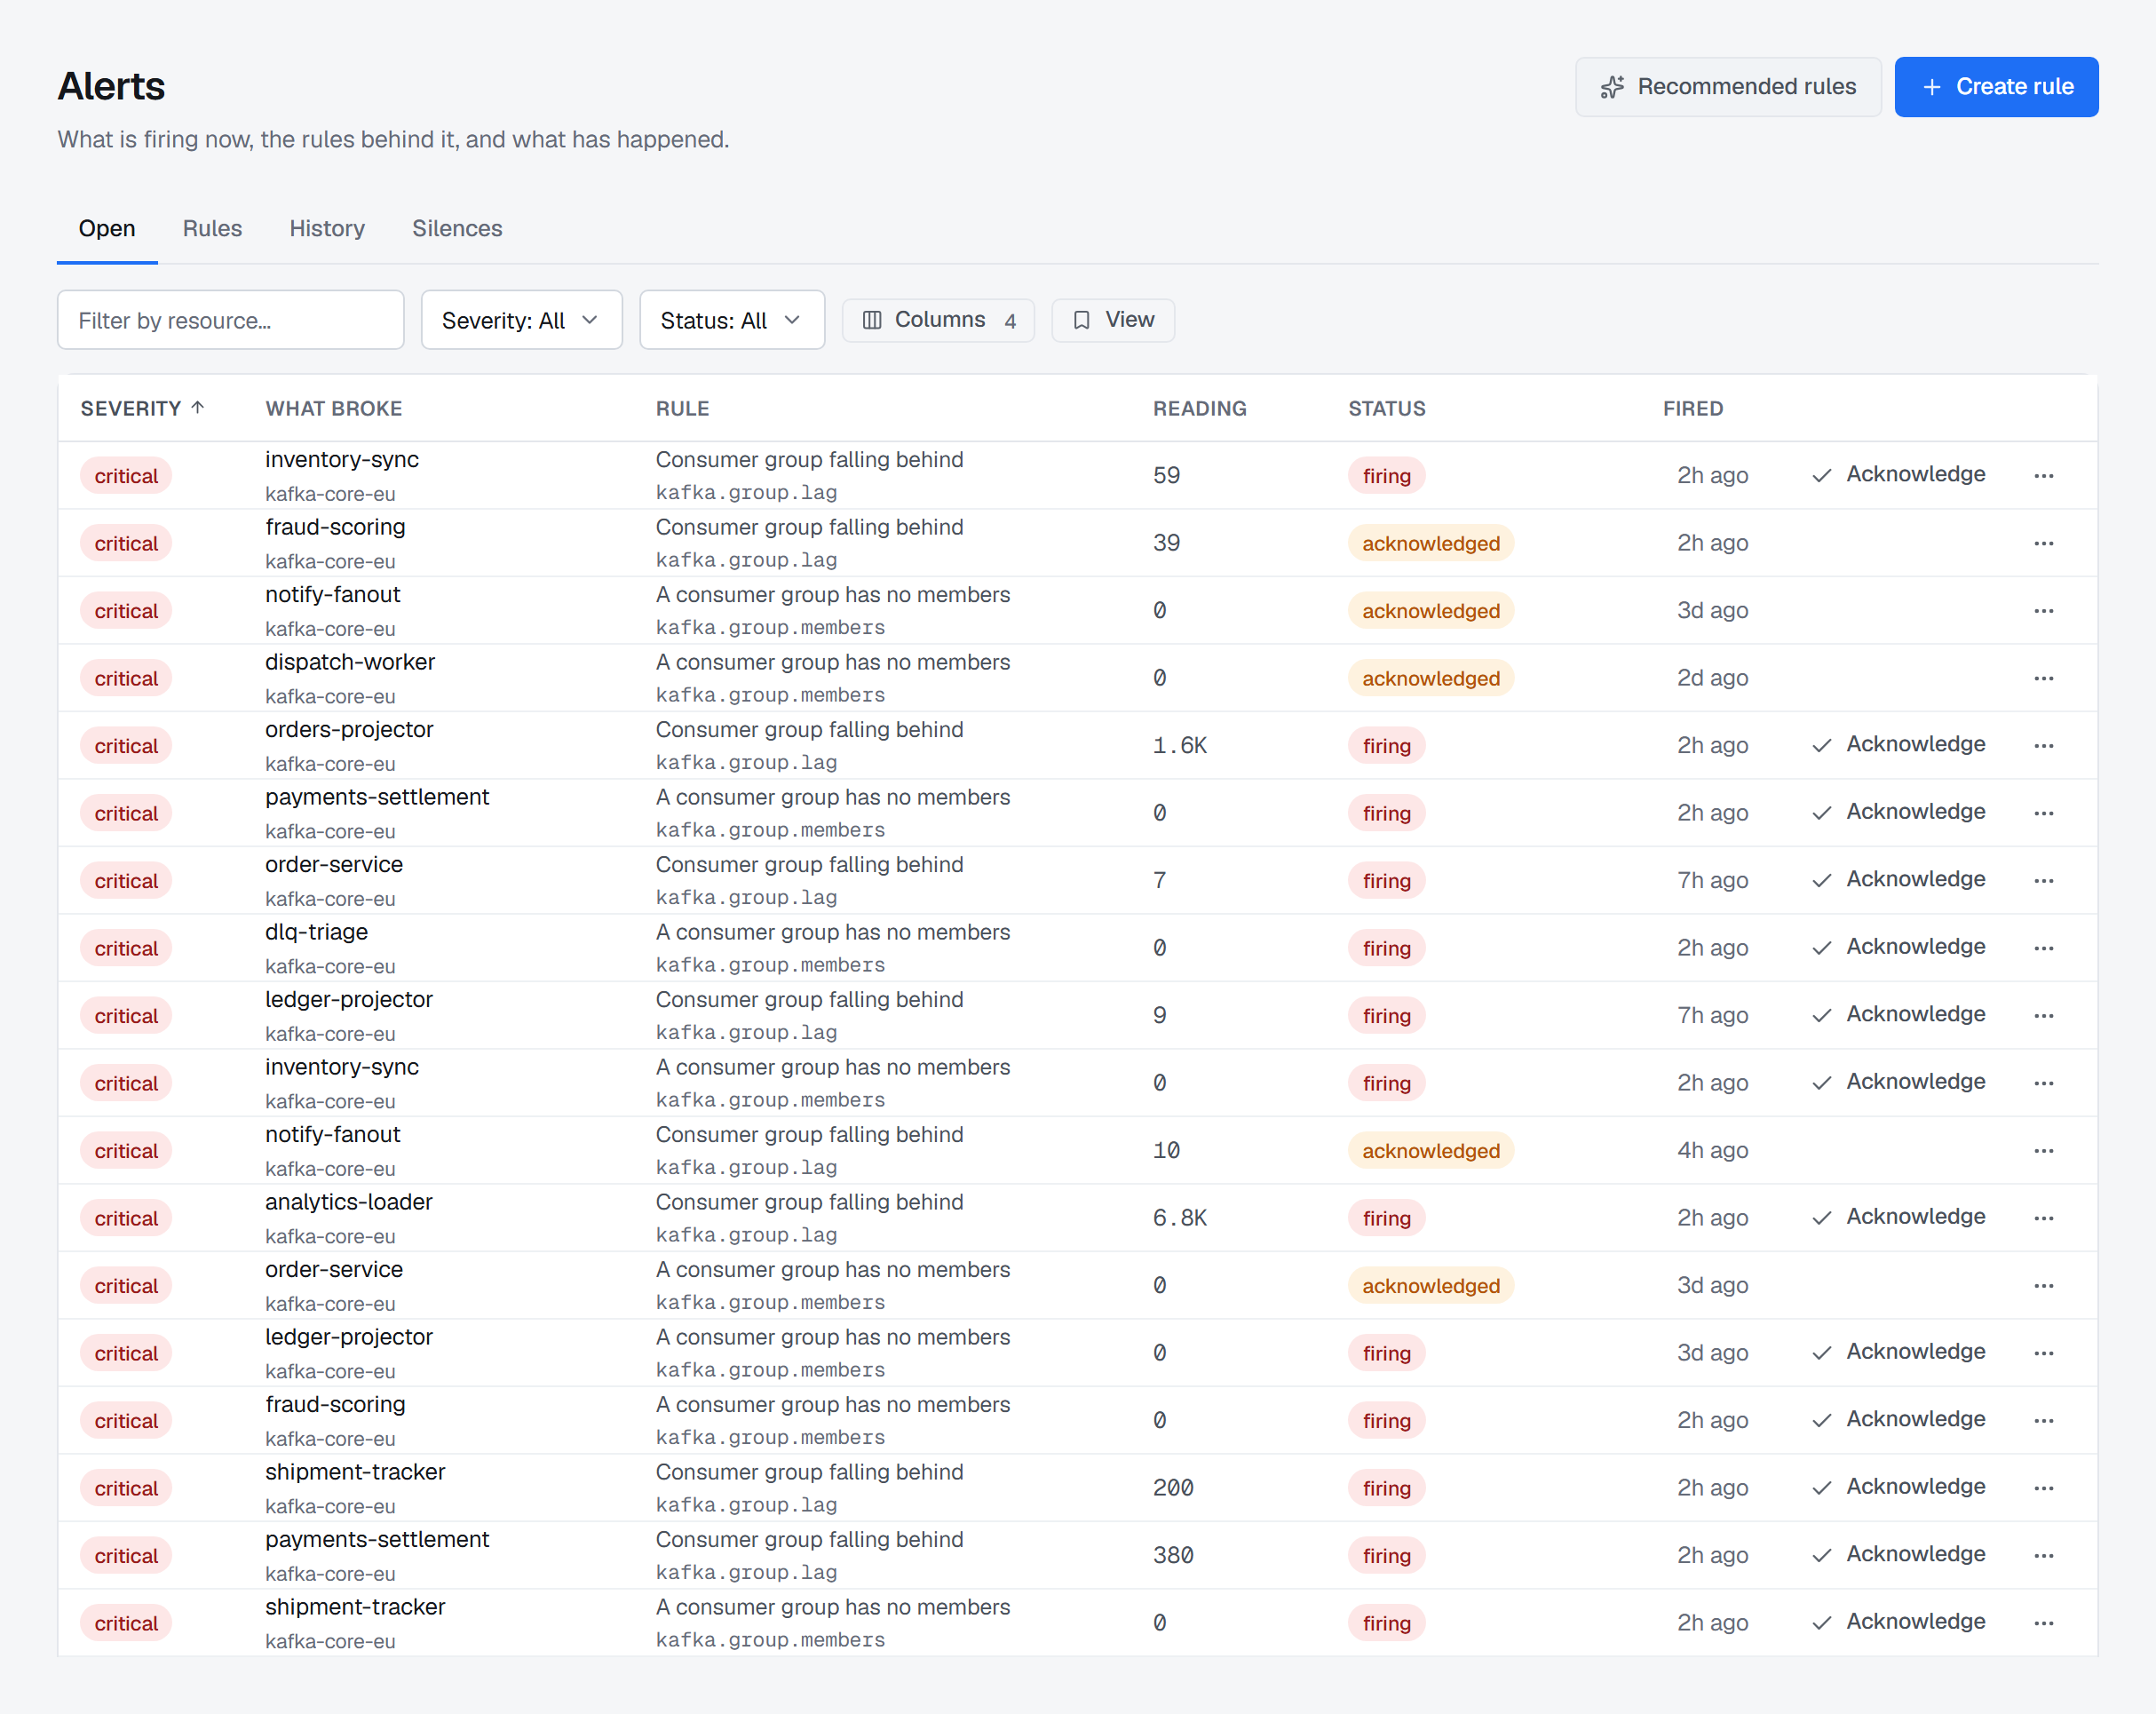
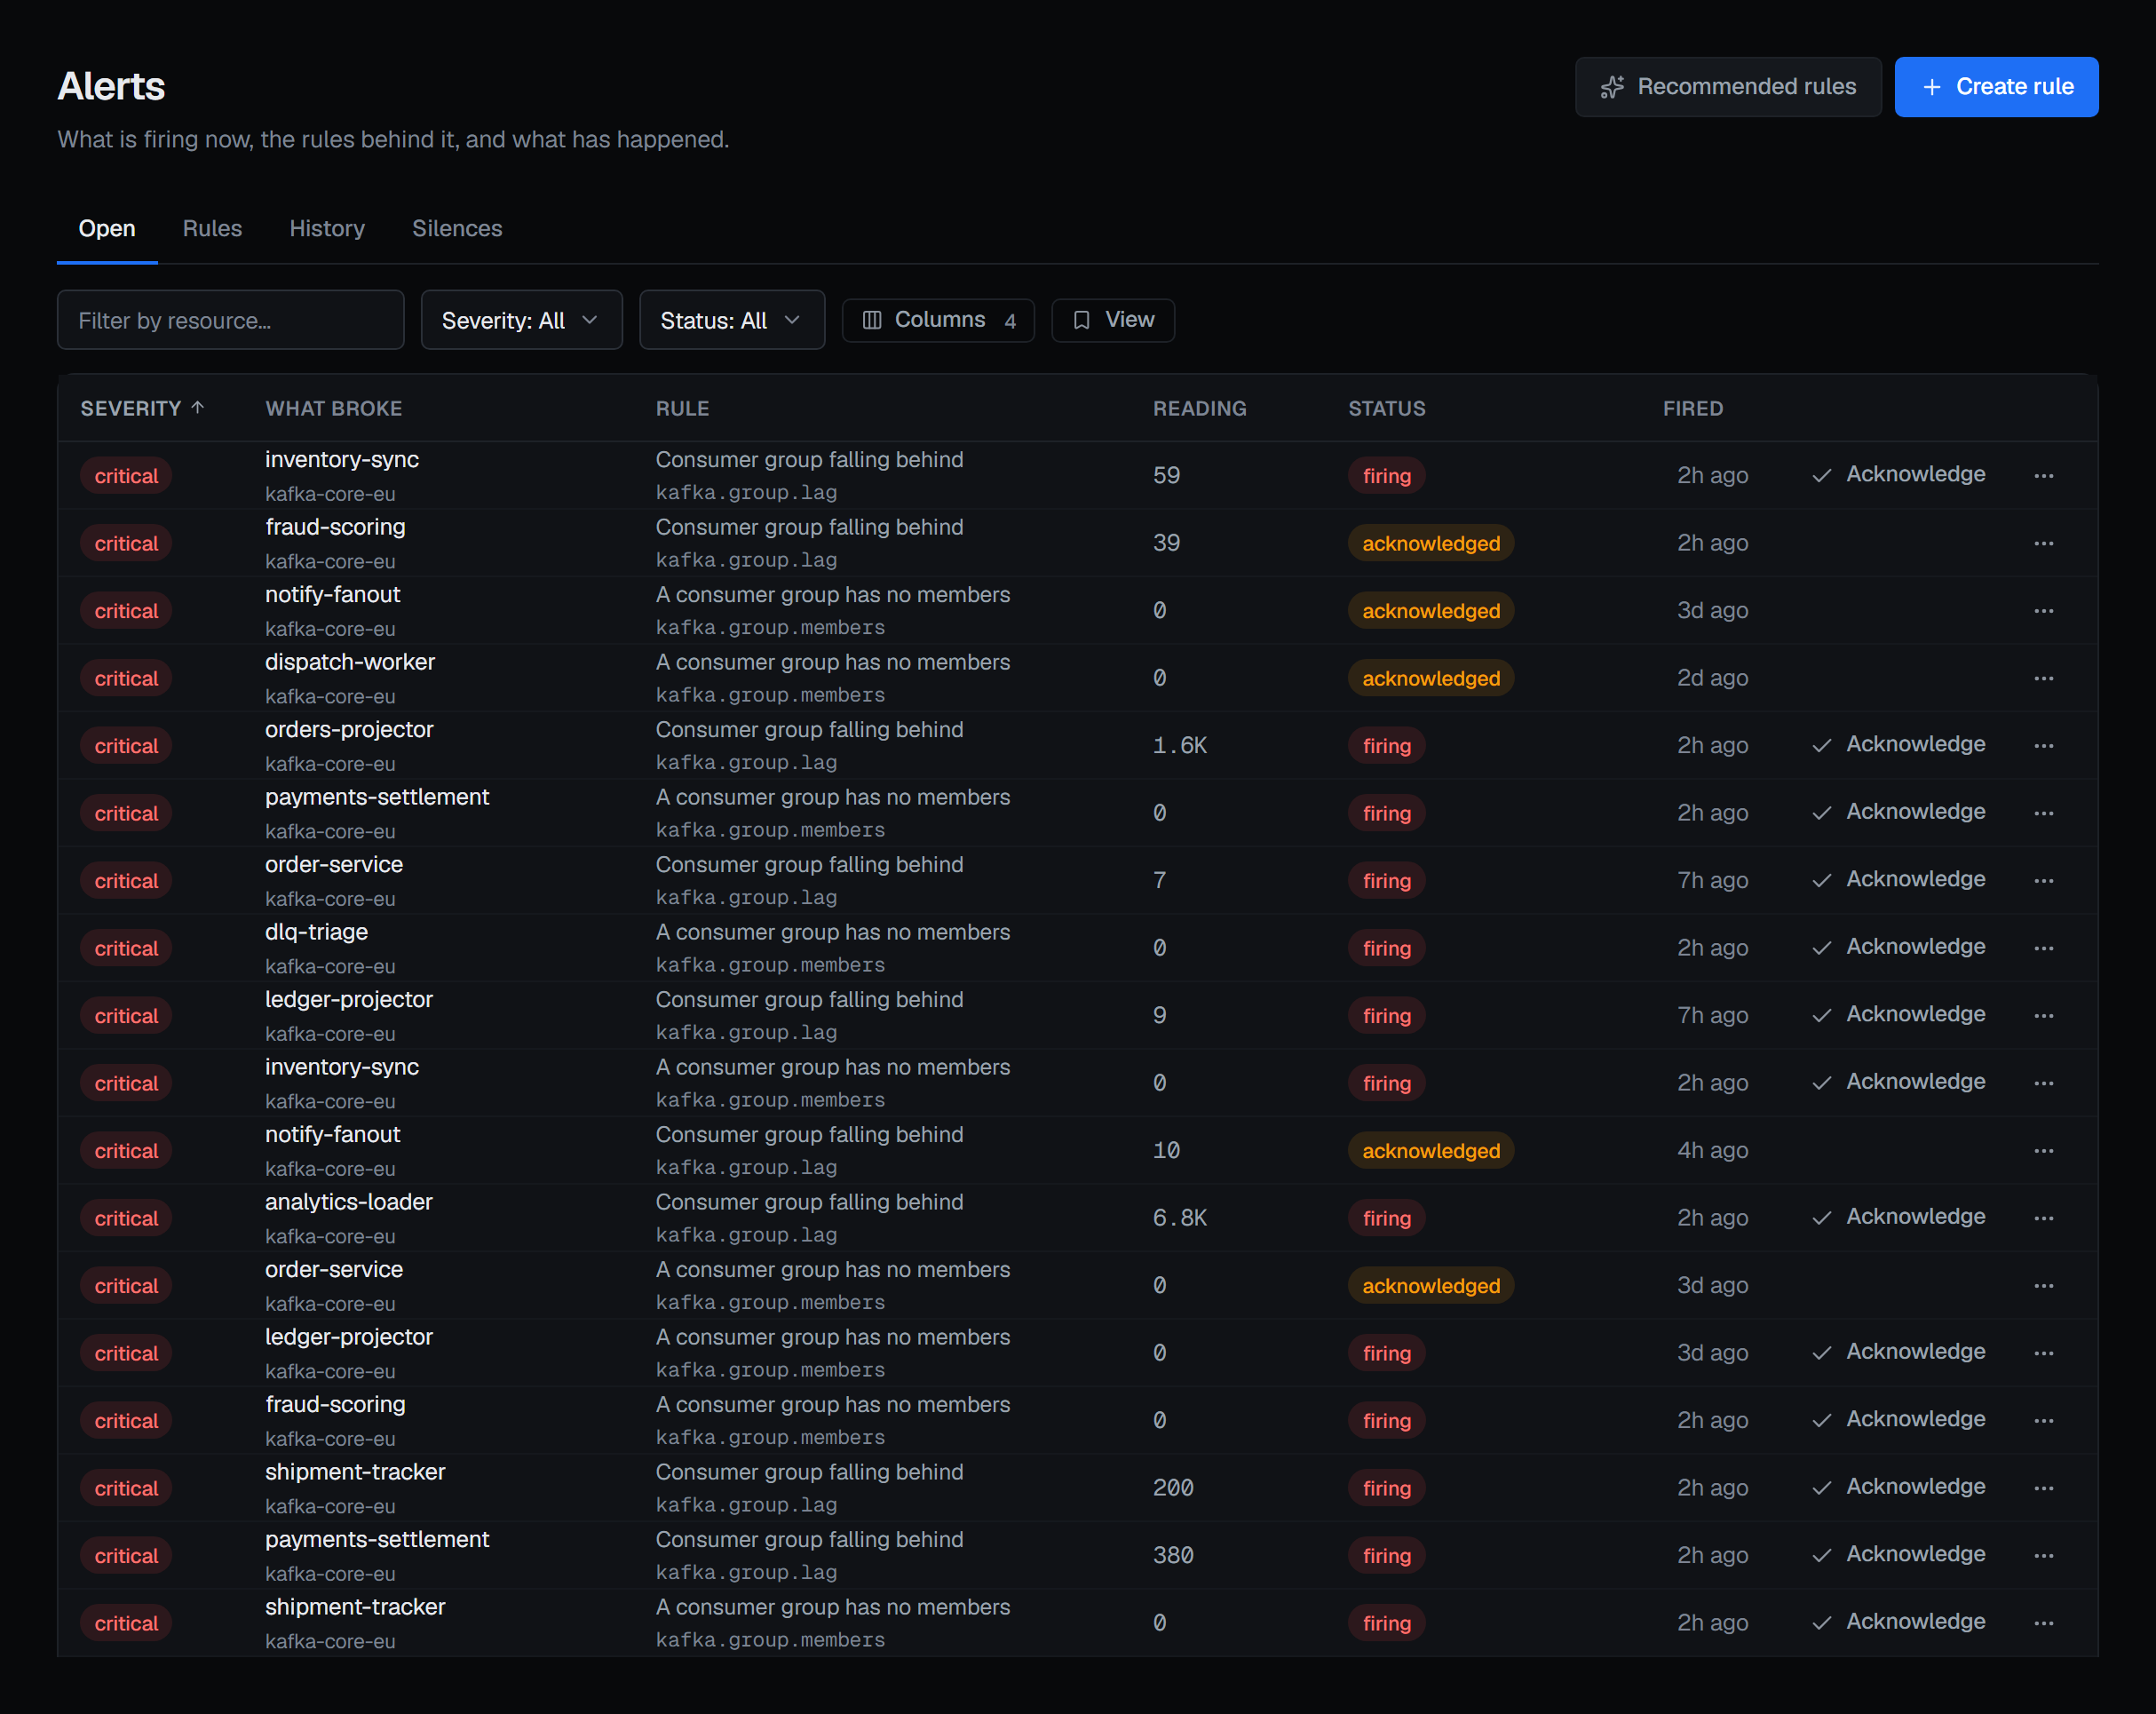
Open comes first, and that is the whole argument for the screen's shape: the rules are what you came here to change, the incidents are what you came here to see. A monitoring screen that opens on configuration makes you click to find out whether anything is broken.
Rules is where a rule is written, edited, enabled, disabled or removed. Disabling or removing a rule closes its open incidents, marked as closed by you and why, since nothing is watching them any more. So does moving a rule to watch something else — another cluster, environment, application or resource, or another metric — for the incidents it leaves behind. Removing a rule also withdraws the silences that cover only that rule and have not ended.
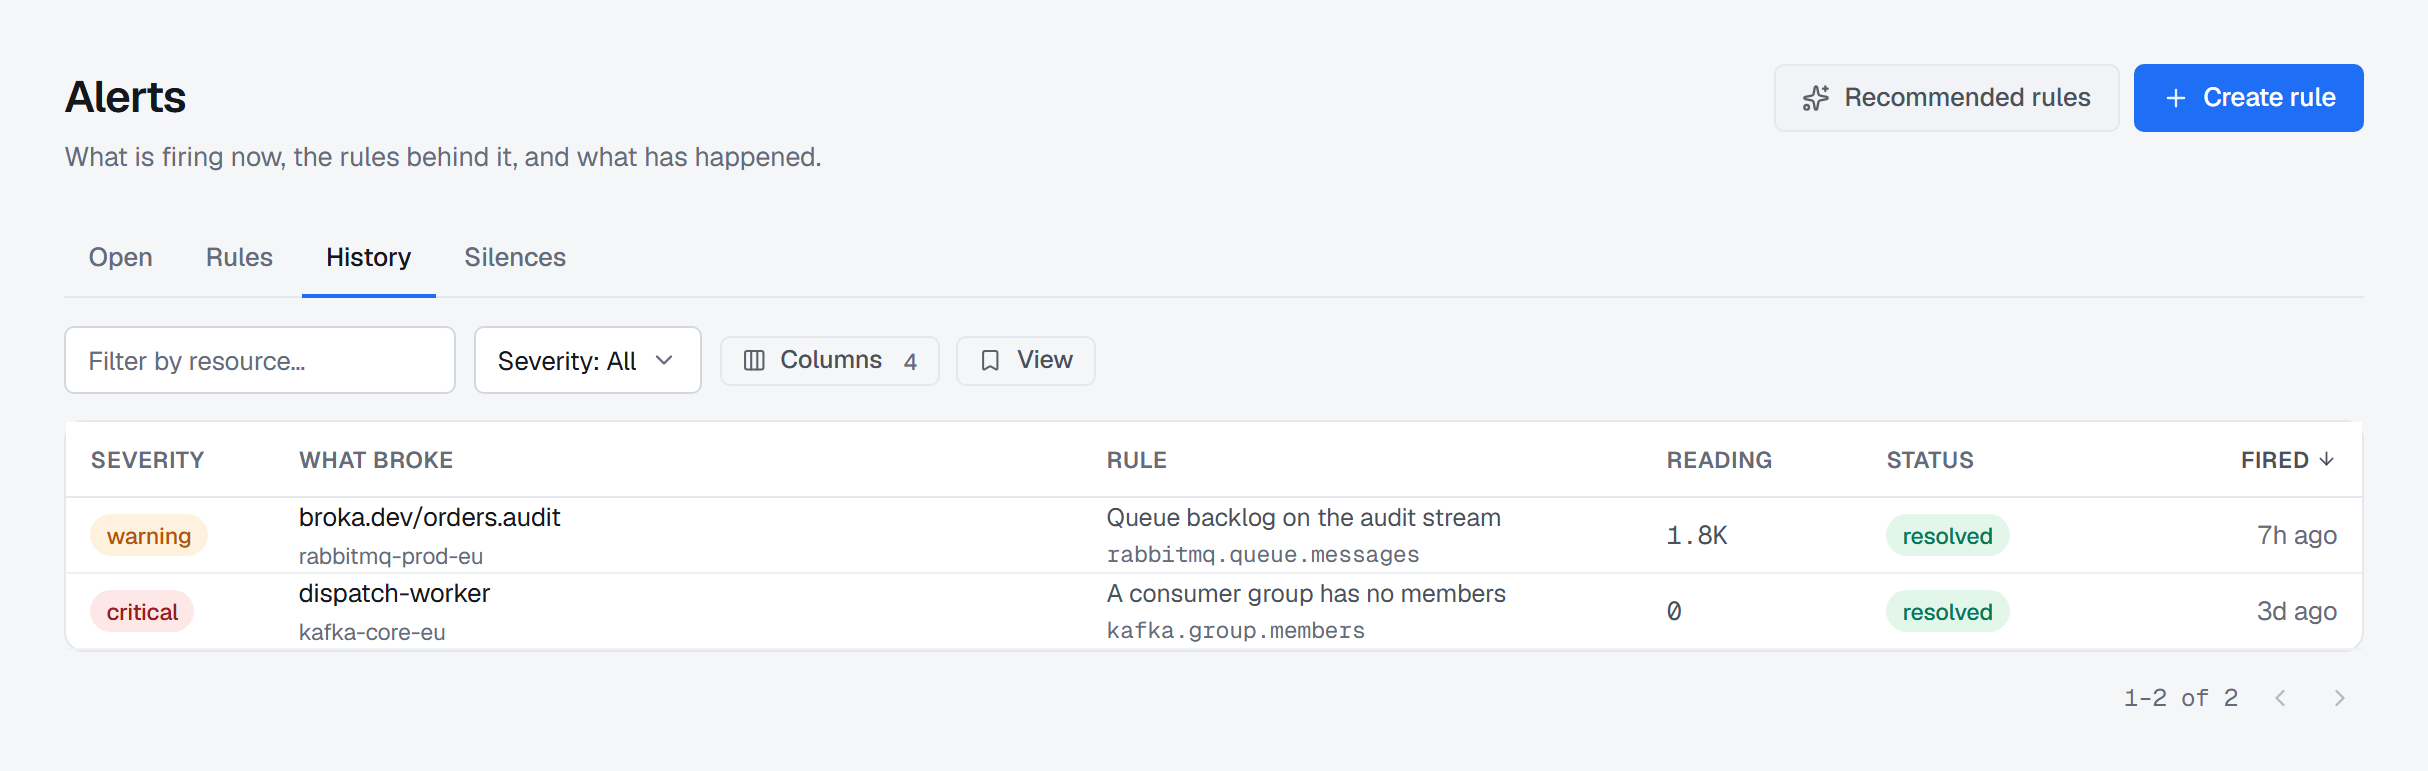
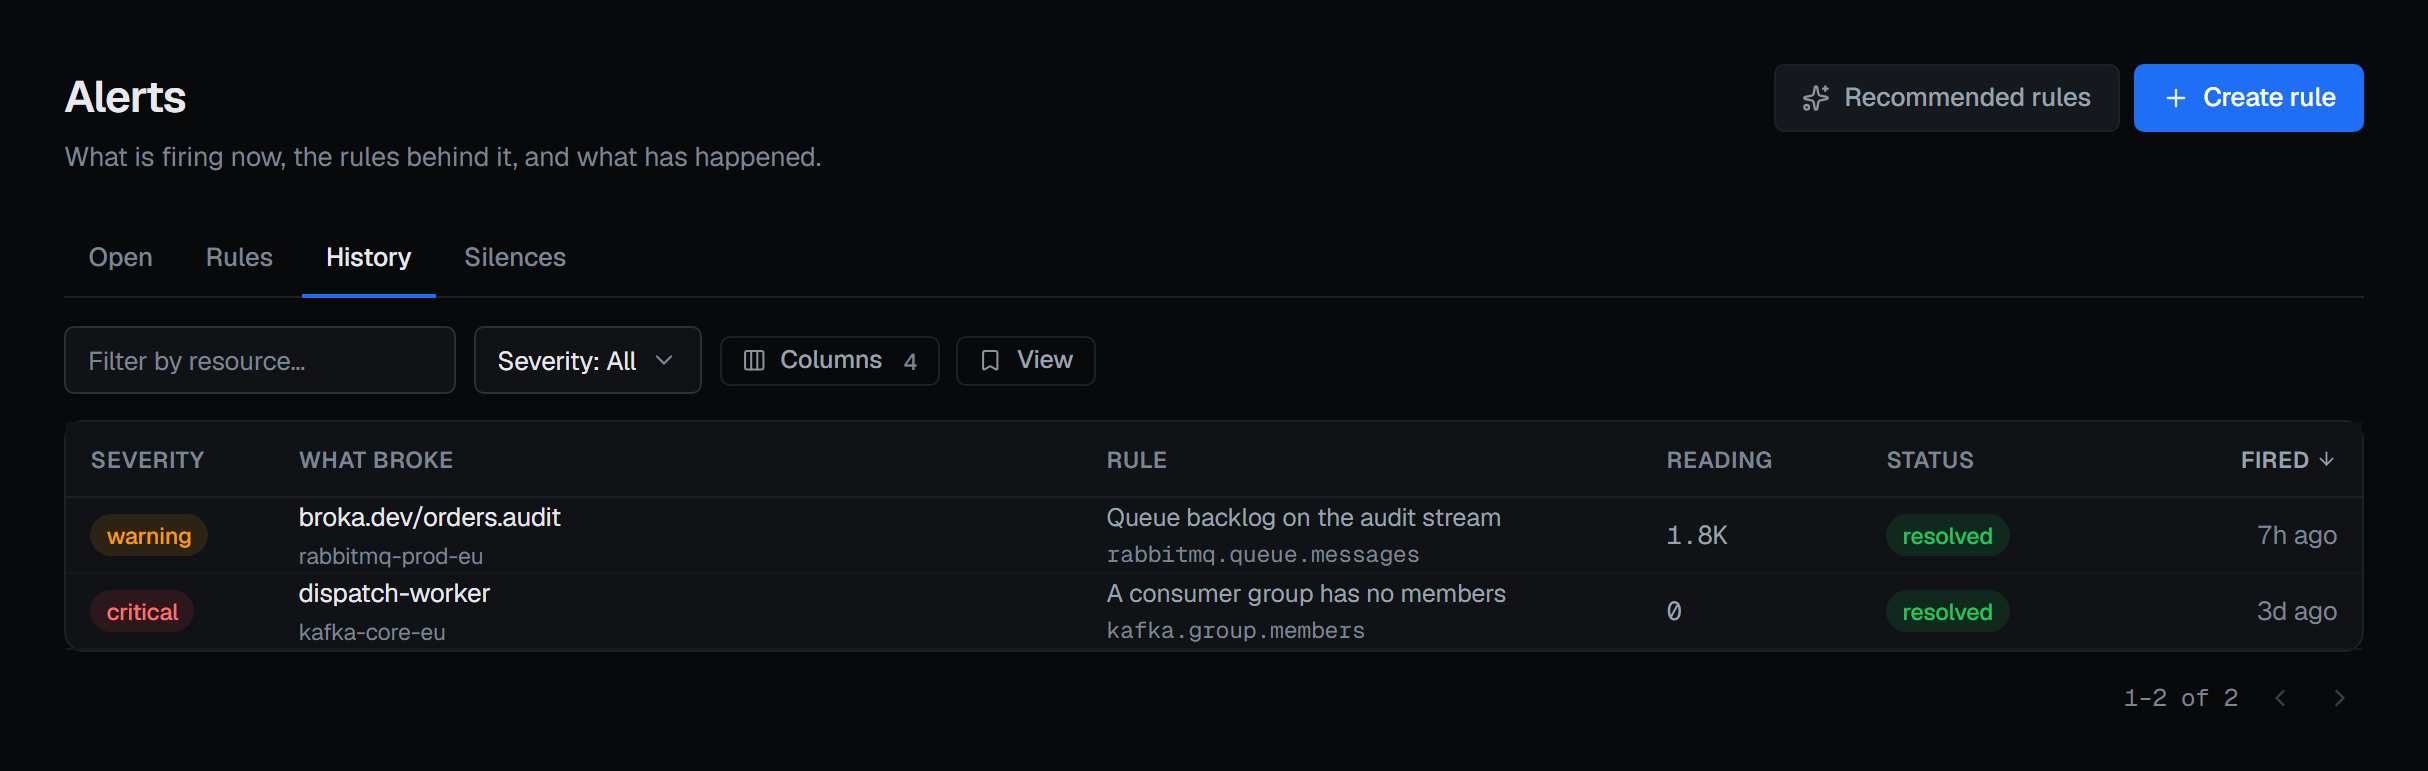
History is every event the evaluator has opened and closed, so "did this happen before, and how often" has an answer.
Silences are maintenance windows: a planned upgrade should not page anybody, and suppressing the noise should not mean turning the rule off and forgetting to turn it back on. A silence covers everything, an environment, a connection, an application (Commercial), a resource or one rule, for a window with an end. A breach inside it is still recorded — as suppressed — and notifies nobody, not even with a reminder. If it is still breaching when the window ends, it is notified then.
What a rule says
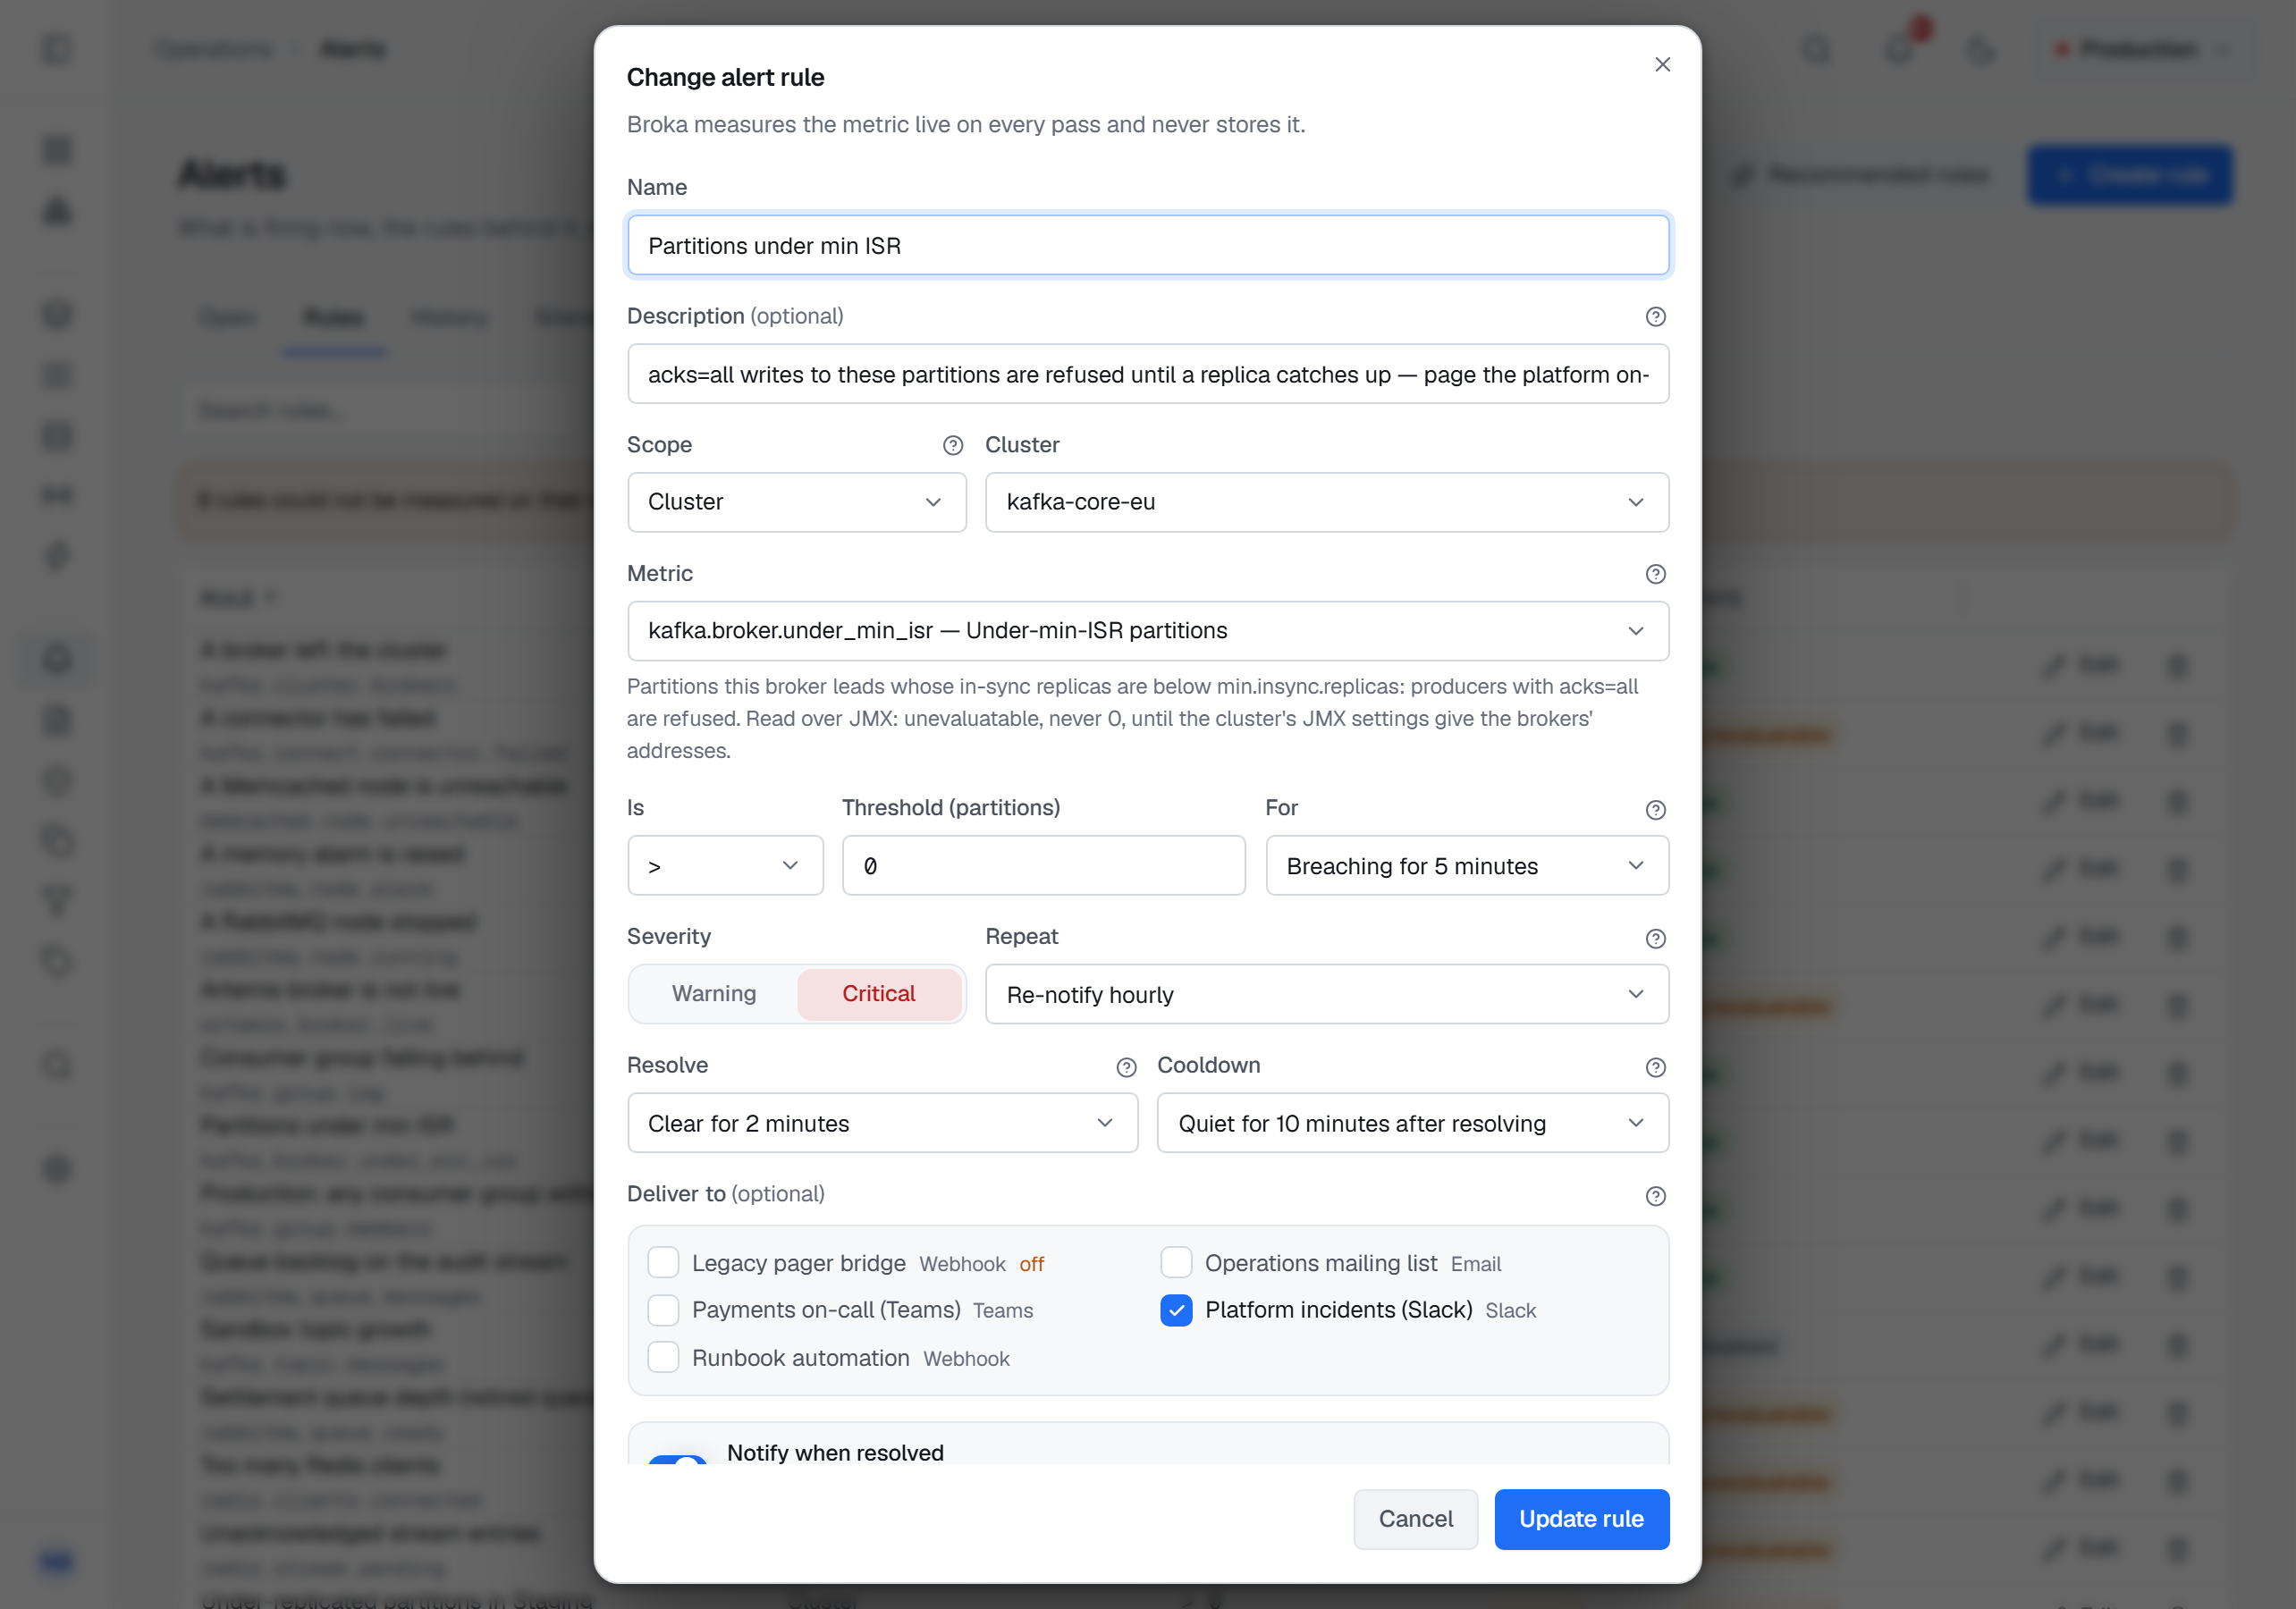
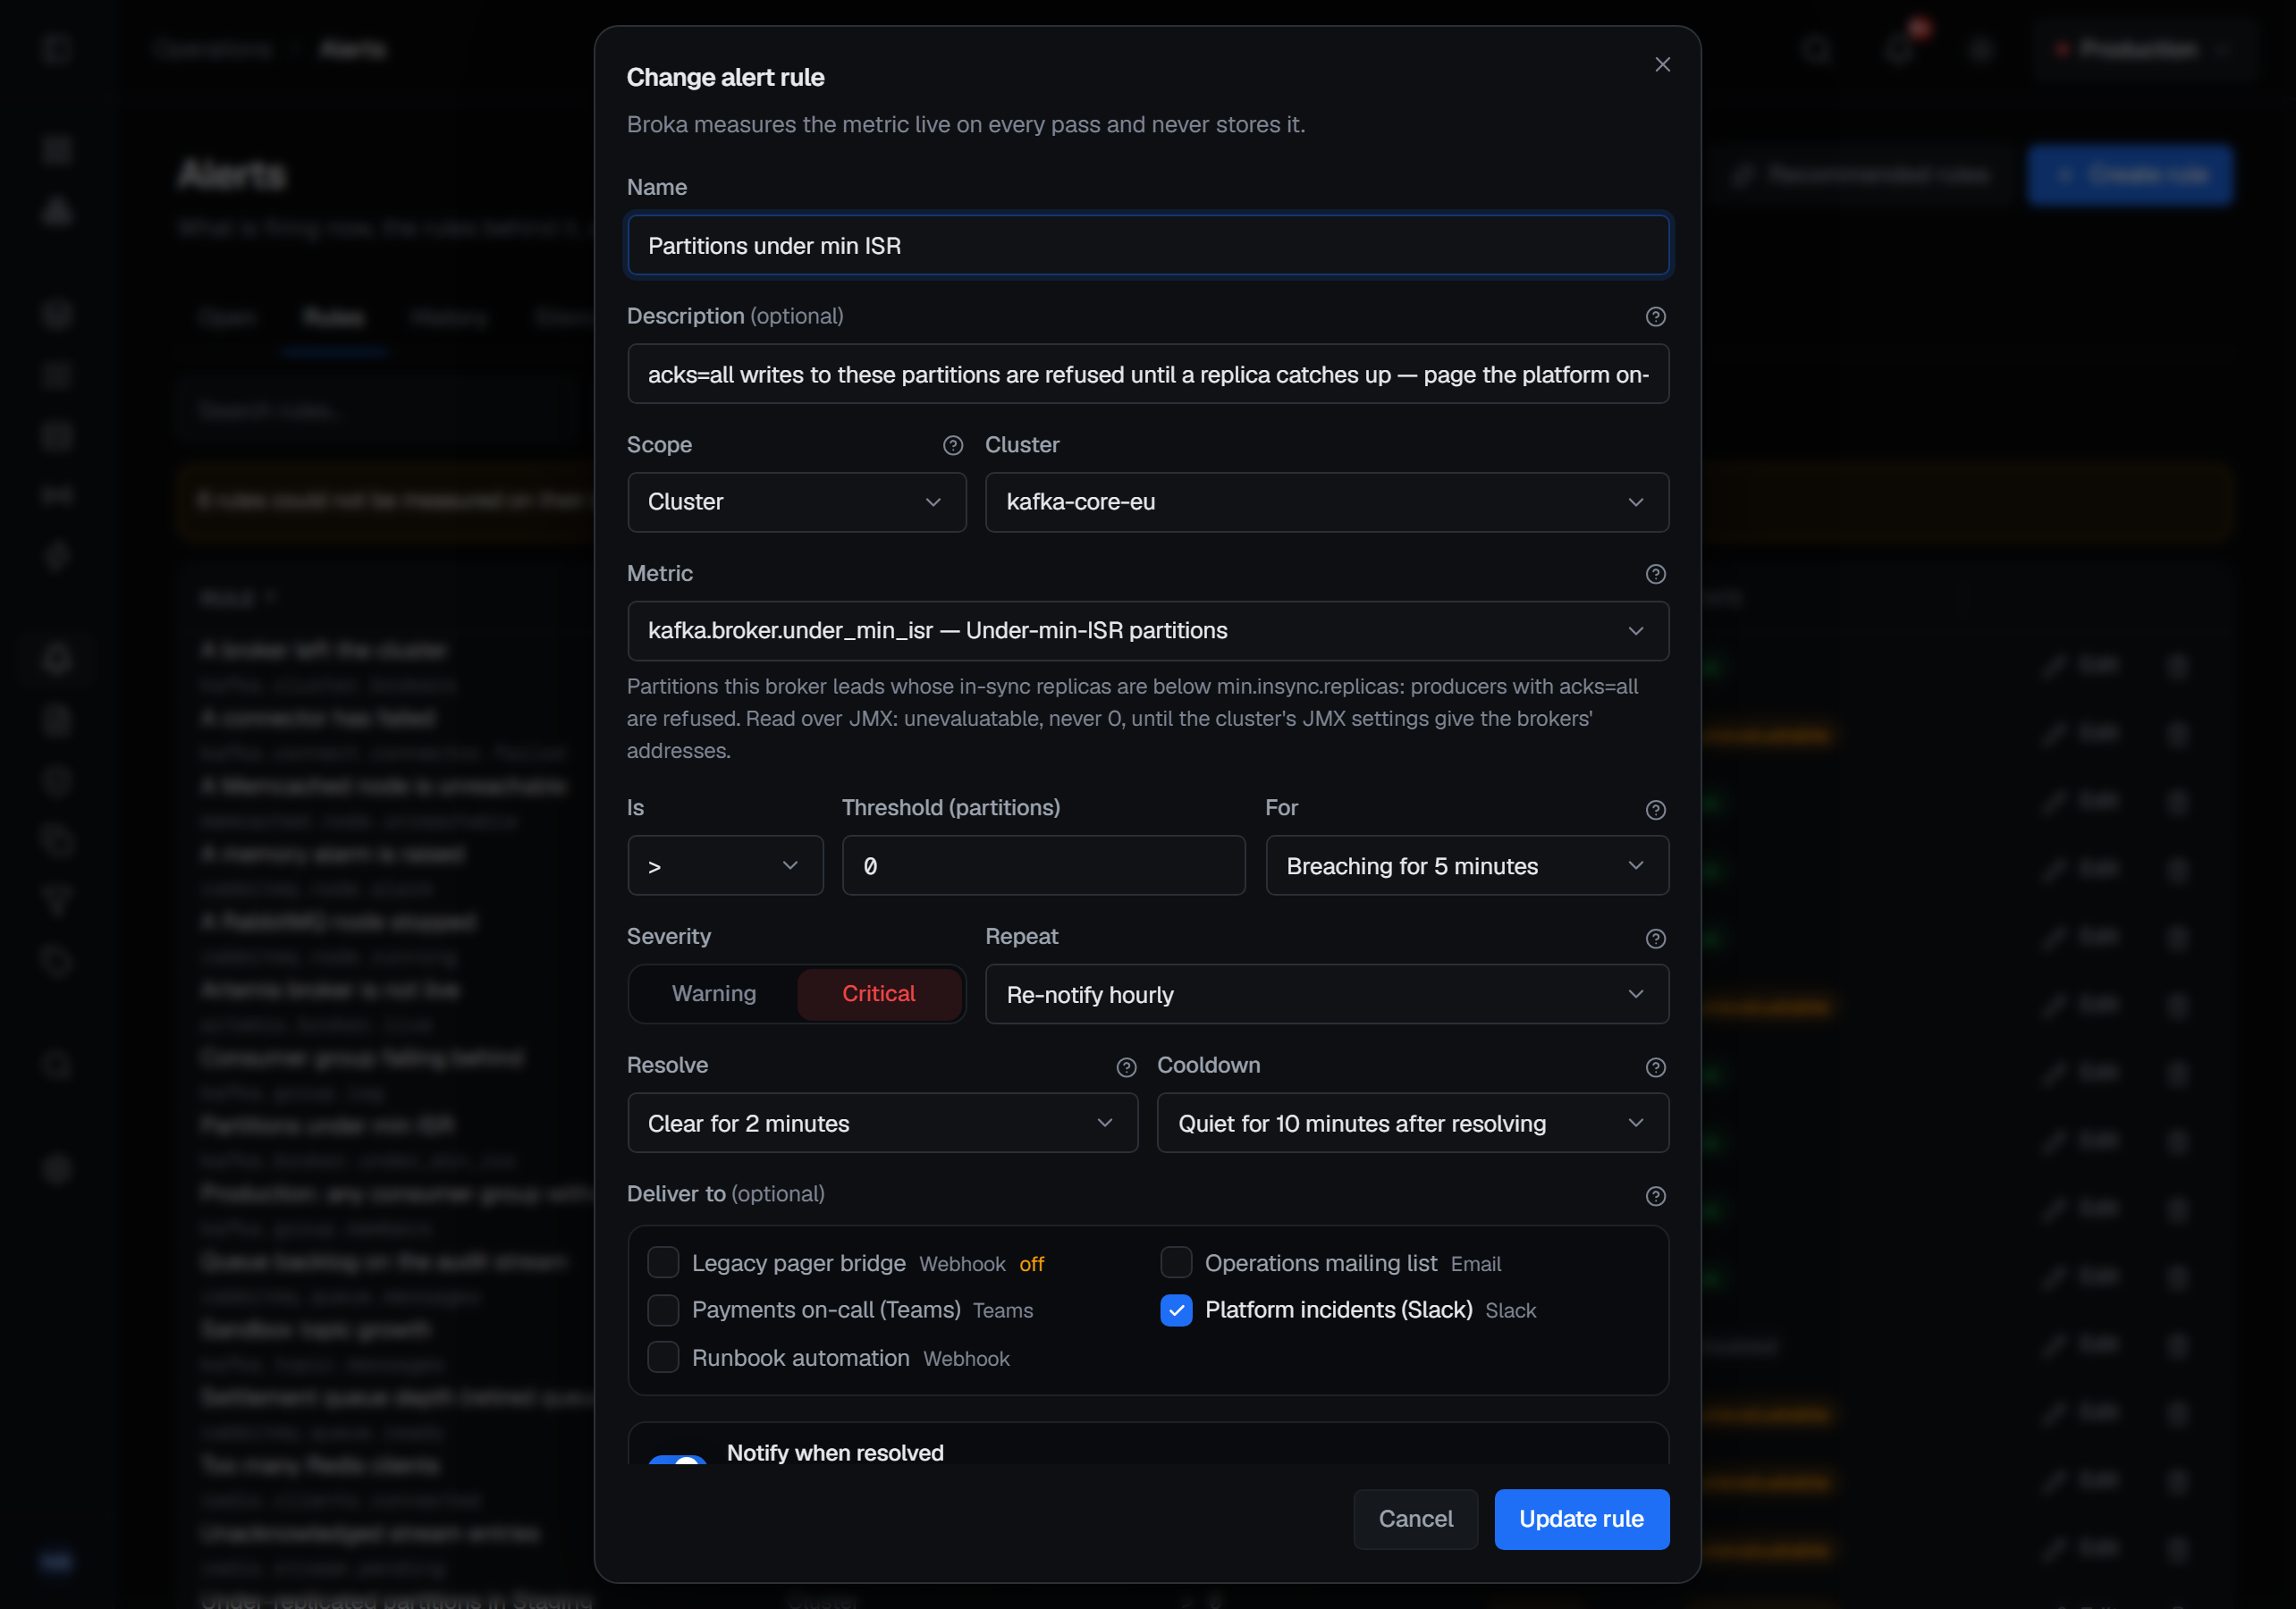
A rule is six decisions, and the dialog asks them in the order they matter.
The metric, chosen from a catalogue rather than typed. Consumer lag, under-replicated partitions, queue depth, a queue with no consumer, the age of a queue's oldest message (Artemis), memory, connection health — each platform contributes the figures it actually has, so the list you see depends on what your installation serves. Beside each platform's own figures are the components around it, described below; every metric, with its unit and what it lands on, is listed in Alert metrics.
The scope: an environment, a connection, an application (Commercial), or a named resource. A rule that names nothing watches everything the scope covers, and the number of targets that produces is a number worth knowing before you save — which is what the dry run below is for. A named RabbitMQ queue is looked up by its name however many queues the broker holds, and each evaluation reads a cluster's figures once for all of its rules.
Besides topics, groups, queues and the rest, a named resource can be a Connect cluster, a connector — shown as its Connect cluster's name and its own, and stored as the two together — a shovel, a federation link, a bridge or a broker connection, each picked from a list of what the connection has rather than typed. Schema Registry figures belong to the connection, since a connection has at most one registry. A JMX figure at connection scope is measured on every node — every broker, or every broker and controller — and an incident names the node it fired on, broker 2 or controller 3001.
A rule over an environment or an application measures each cluster on its own. One cluster's incident never resolves another's, and a hold window on one cluster is not reset by a sibling that is healthy — the same resource name on two clusters is two targets, not one. A cluster that cannot be read is named in the rule's state ("1 of 2 clusters could not be evaluated. orders-eu: …"), and the rule reads healthy only when every cluster is.
The comparison and the threshold — above, at or above, below, at or below, equal to, not equal to. Not equal to is for a figure with one right value: a cluster's active controllers, which should be exactly one.
How long it must hold. A figure that crosses a line for one tick and comes back is not an incident. Leave it at zero to fire on the first breach. A reading that cannot be taken — a JMX agent that missed one reading, say — does not restart the wait once or twice in a row; a third time, the target reads unmeasurable.
The severity — critical or warning.
Whether to repeat. An incident that stays open can page again after an interval, or stay quiet until it resolves.
How it settles. Resolve after keeps an incident open until the figure has been clear for a while — two minutes unless you choose otherwise — so a figure hovering at the line is one incident, not ten. Cooldown keeps an incident that reopens on the same target soon after resolving on the console without notifying anybody again — ten minutes unless you choose otherwise. Notify when resolved, on unless you turn it off, tells the channels the incident reached that it is over. Rules written before these settings existed took the same defaults. Resolve on the first clear reading and No cooldown turn the two windows off.
What can be alerted on
The catalogue grows with what BROKA reads, and Alert metrics lists every metric. Besides each platform's own figures:
- Kafka over JMX, where JMX is set up — per node: cluster health (active controllers, offline partitions, leader and unclean elections), broker health (partitions under and at their minimum in-sync replicas, ISR shrinks, offline log directories, a broker not running, metadata lag), requests (p99 and mean time by type, failed requests, rejected bytes), saturation (idle request handlers and network threads, queues, purgatories), disk (log flush p99), the JVM and system (heap, garbage-collection time, CPU, file descriptors, threads) and each broker's own throughput. A topic's own rates are shown on its page but are not alertable.
- Kafka Connect — a Connect cluster that does not answer, its failed connectors and tasks; a connector that has failed, is paused or stopped, is unassigned, has failed tasks or a share of tasks running.
- Schema Registry — whether it answers, how long it takes, whether it has gone read-only, how many subjects it holds.
- RabbitMQ shovels and federation links (Commercial, with RabbitMQ) — whether each runs, whether a shovel is blocked and what it has pending, and how many of either are not running.
- Apache Artemis bridges, broker connections and cluster connections (Commercial, with Artemis) — whether a bridge or broker connection is connected, what a bridge has pending, and how many members a cluster connection sees.
Not answering is a value. A Connect worker or a registry that does not answer reads reachable = 0, which a rule can fire on; the figures that need its answer are then unevaluatable rather than read as zero. A connection with no registry registered, or no JMX set up, is a reason the rule states — never a 0. An incident on a component names its kind in words and links to its page.
The dry run
Before a rule is saved, Preview measures the draft against your live estate: which targets it matches, what each one reads right now, and how many of them would fire. It writes nothing and creates no rule.
Two things about it are deliberate. The counts describe every target even though the list of rows is capped — a truncated list whose total matched its own length would understate the blast radius of the rule being written, which is the one number the author is there to learn. And a target whose figure cannot be read is reported as unmeasurable, by name, rather than quietly left out.
A rule nobody has evaluated yet says so
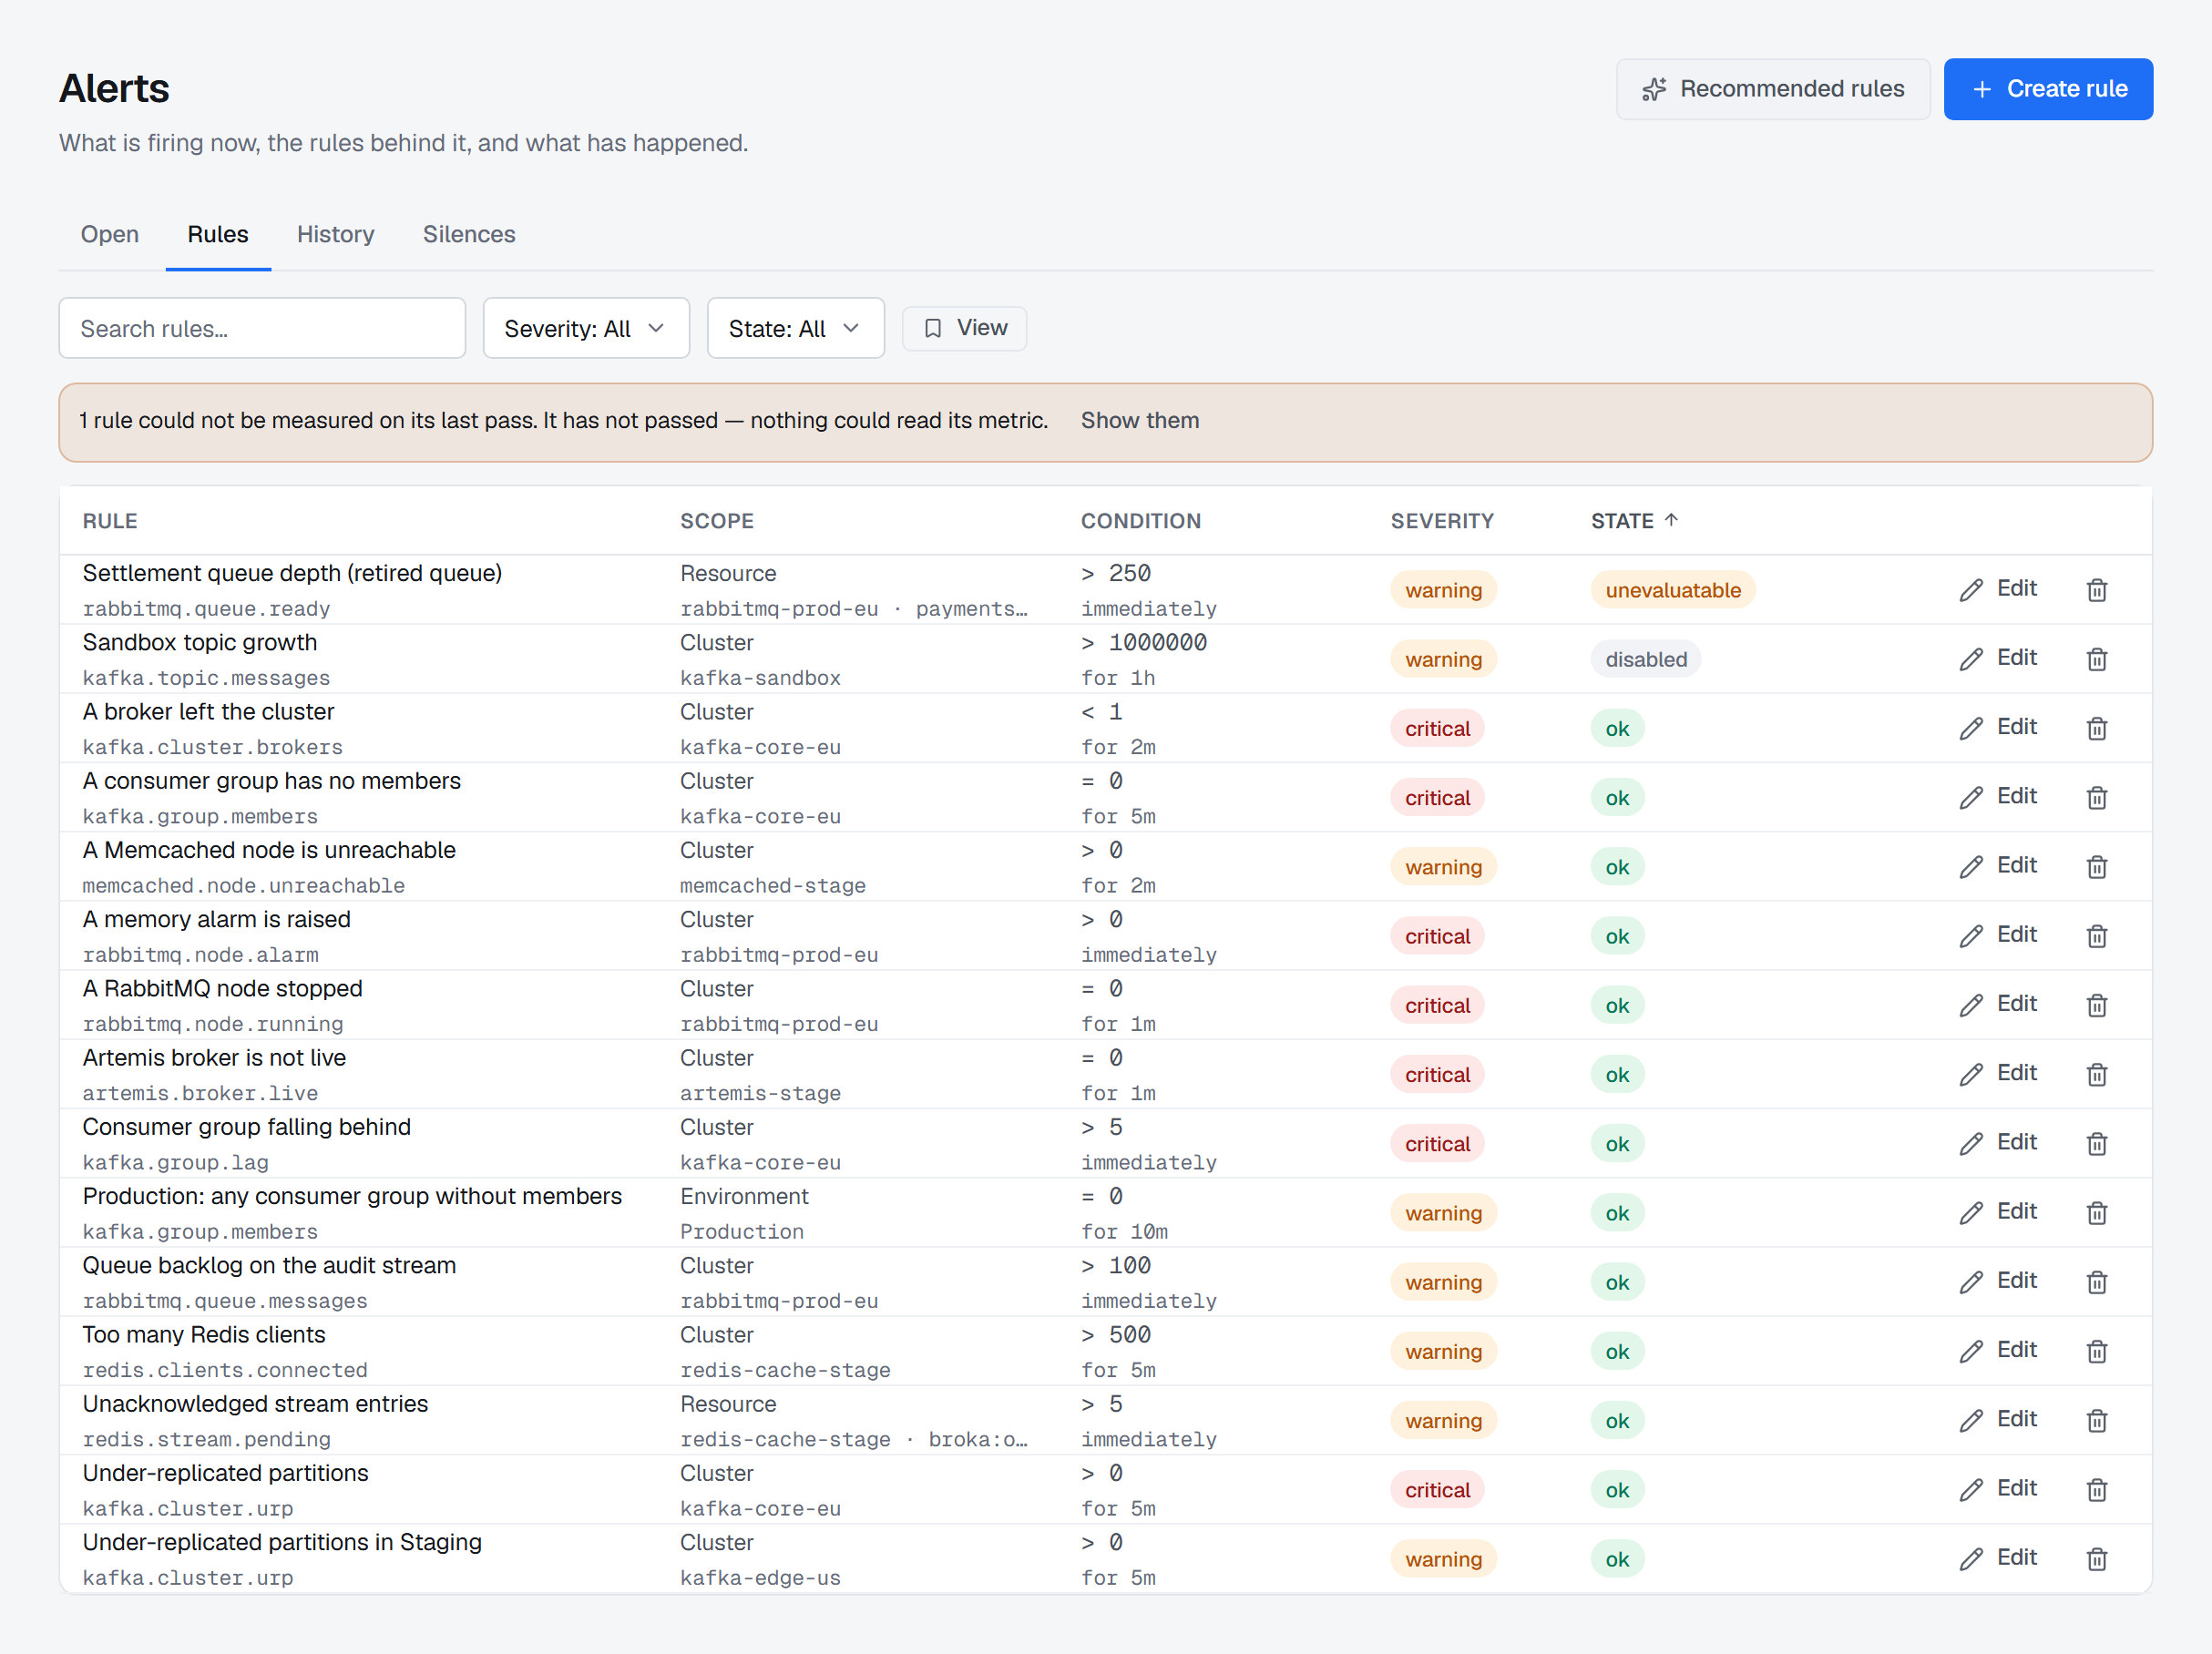
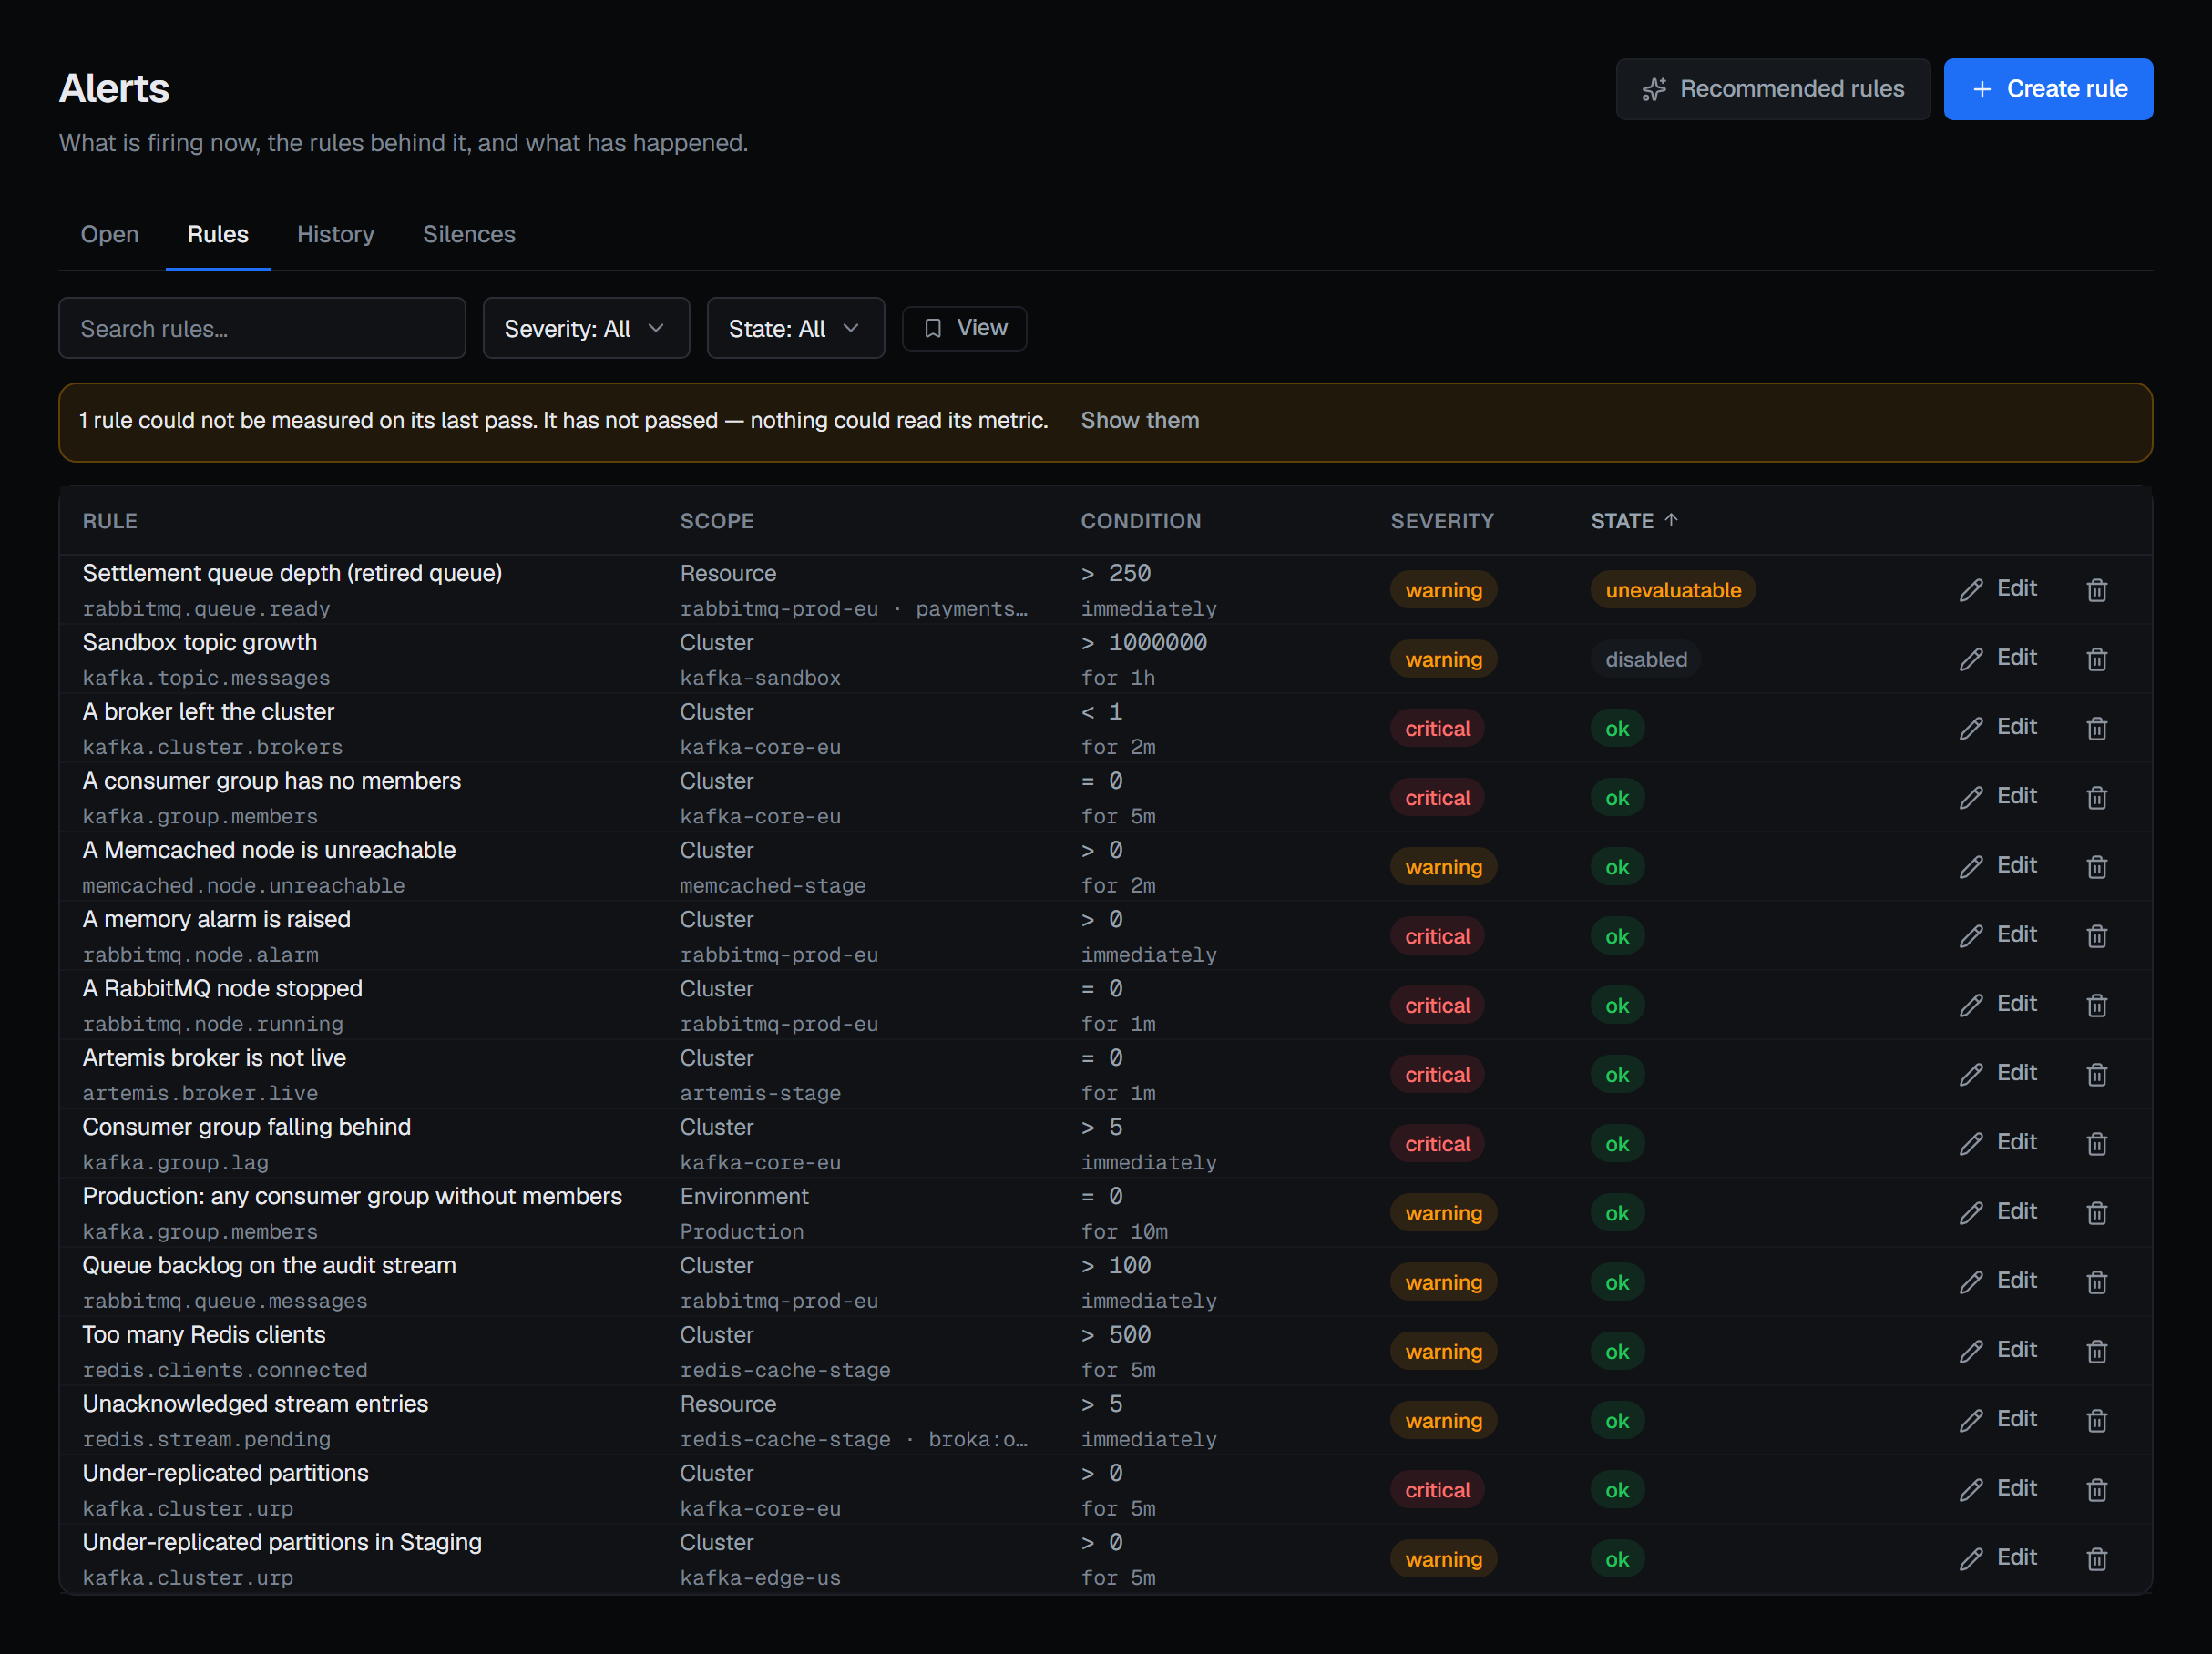
A saved rule that has not been evaluated reads not evaluated yet — not ok. An unknown state that defaults to green is how a screen ends up reporting a quiet, healthy estate on a product that has measured nothing.
The same rule applies once the evaluator is running. A rule whose targets cannot be measured says how many — "3 of 47 targets could not be measured" — rather than reporting on the forty-four it could reach and calling that the answer.
A rule scoped to an application, kept from a Commercial installation that was moved back to Community, reads not evaluated: Community does not evaluate it, and its hover names the edition that does.
A rule the evaluator has stopped reaching reads stale once its last evaluation is three periods old, rather than keeping the last ok it was given. A rule whose scope covers no cluster at all says why. A Kafka rule on topics or groups whose snapshot is older than three refreshes reads unevaluatable with the snapshot's age, rather than judging the present by an old reading. A rule that names nothing and would watch more than 500 targets on one cluster watches the first 500 and says so — "500 of 1,450 targets evaluated" — whatever the targets are.
What the evaluator does, and what it does not keep
It runs on a schedule, reads each rule's metric live on its targets, and opens or resolves events accordingly. Each connection is evaluated on its own schedule: a cluster that is down or slow delays only its own rules, never another cluster's, and within a Kafka connection a Connect cluster, the registry or JMX that does not answer fails alone, without making the cluster's other rules unevaluatable. An incident whose target has gone — a deleted topic, a removed shovel — is resolved and says why; one whose target merely could not be read stays open.
It keeps no metric history. BROKA stores no time series, so there is no chart of a figure over time behind an alert — what it stores is the event: when it opened, on what, against which rule, and when it closed. The hold window for a rule that must breach for a while before it fires is held in memory, so a restart of the broker service resets it; that is stated here rather than discovered. A resolved event, and the record of the notifications it sent, is kept for the audit retention window and then removed; an open one is kept for as long as it is open.
Where an alert goes
Slack, Microsoft Teams and webhook channels — Commercial only. E-mail and the console are in both editions.
Notification channels are configured in Settings ▸ Integrations, and there are four kinds: Slack, Microsoft Teams, e-mail through the installation's own SMTP relay, and a generic webhook, which posts BROKA's own document to any endpoint you name. A delivery that fails is tried again a few minutes later, up to five times, and a channel that stops answering does not hold back anybody else's alerts.
Everything that starts breaching on one connection in one evaluation goes to a channel as one message, listing
every rule and target, so a bad minute is one notification rather than a flood. Each channel has a lane of its own:
it is sent one message at a time at a bounded pace, a channel that answers too many requests is waited for as long
as it asks (Retry-After), and a slow channel holds back no other. A failure that certainly delivered nothing — a
refused connection, a server error — is retried at once; a timeout is not, because the message may have arrived.
The console is always a destination and needs no channel: an open incident reaches the bell in the top bar and the dashboard's alert card whether or not anything is configured.
What leaves your network when a channel fires. A webhook carries whether the message is about incidents firing or resolving, the connection's name and, for each rule in it, the severity, the rule, the metric, the comparison and threshold and the names of the targets that breached, plus a link back to your own console. That is the minimum a receiver can route on — and it is worth knowing that resource names travel, because on some estates a topic name is itself information.
Starting from something
A fresh installation is offered recommended starter rules for each platform it serves, enabled in one click. A product whose alerting starts as an empty list is a product whose alerting stays an empty list.
A starter rule about a component is offered only where the connection has it: connector failed, failed tasks and Connect cluster unreachable with a Connect cluster; registry unreachable and registry read-only with a registry; shovel not running and federation link not running where RabbitMQ has them; bridge disconnected and broker connection disconnected where Artemis has them. With JMX set up: active controllers ≠ 1, offline partitions, partitions under their minimum in-sync replicas, offline log directories, a broker not running, request handlers less than 20% idle for five minutes, produce p99 over a second for five minutes, failed produce requests for five minutes, heap above 85% for ten minutes, and open file descriptors above 80% of the limit.
The permission
Reading this screen needs alerts.view, which is in the standard bundle. Incidents, and a rule's
preview, show only the clusters your role lets you see. The rules you see follow what each one watches:
a rule on a cluster or a resource, when you may see that cluster; a rule on an environment, when you
hold a role in that environment or a global one; a rule on an application, when you may see the
applications. The same decides what you may change: a rule you cannot see cannot be edited or
deleted by you, and a rule cannot be created or moved to watch something you cannot see. Acknowledge and Resolve
on an incident need alerts.respond — the permission for an on-call rota that should handle incidents
without being able to change the rules. Writing rules and silences needs alerts.manage. Configuring the channels they dispatch to is a different right again — it lives with
settings, because a channel holds a credential.