

Dashboard
Updated 29 September 2026 · applies to 1.0.0 · Community and Commercial
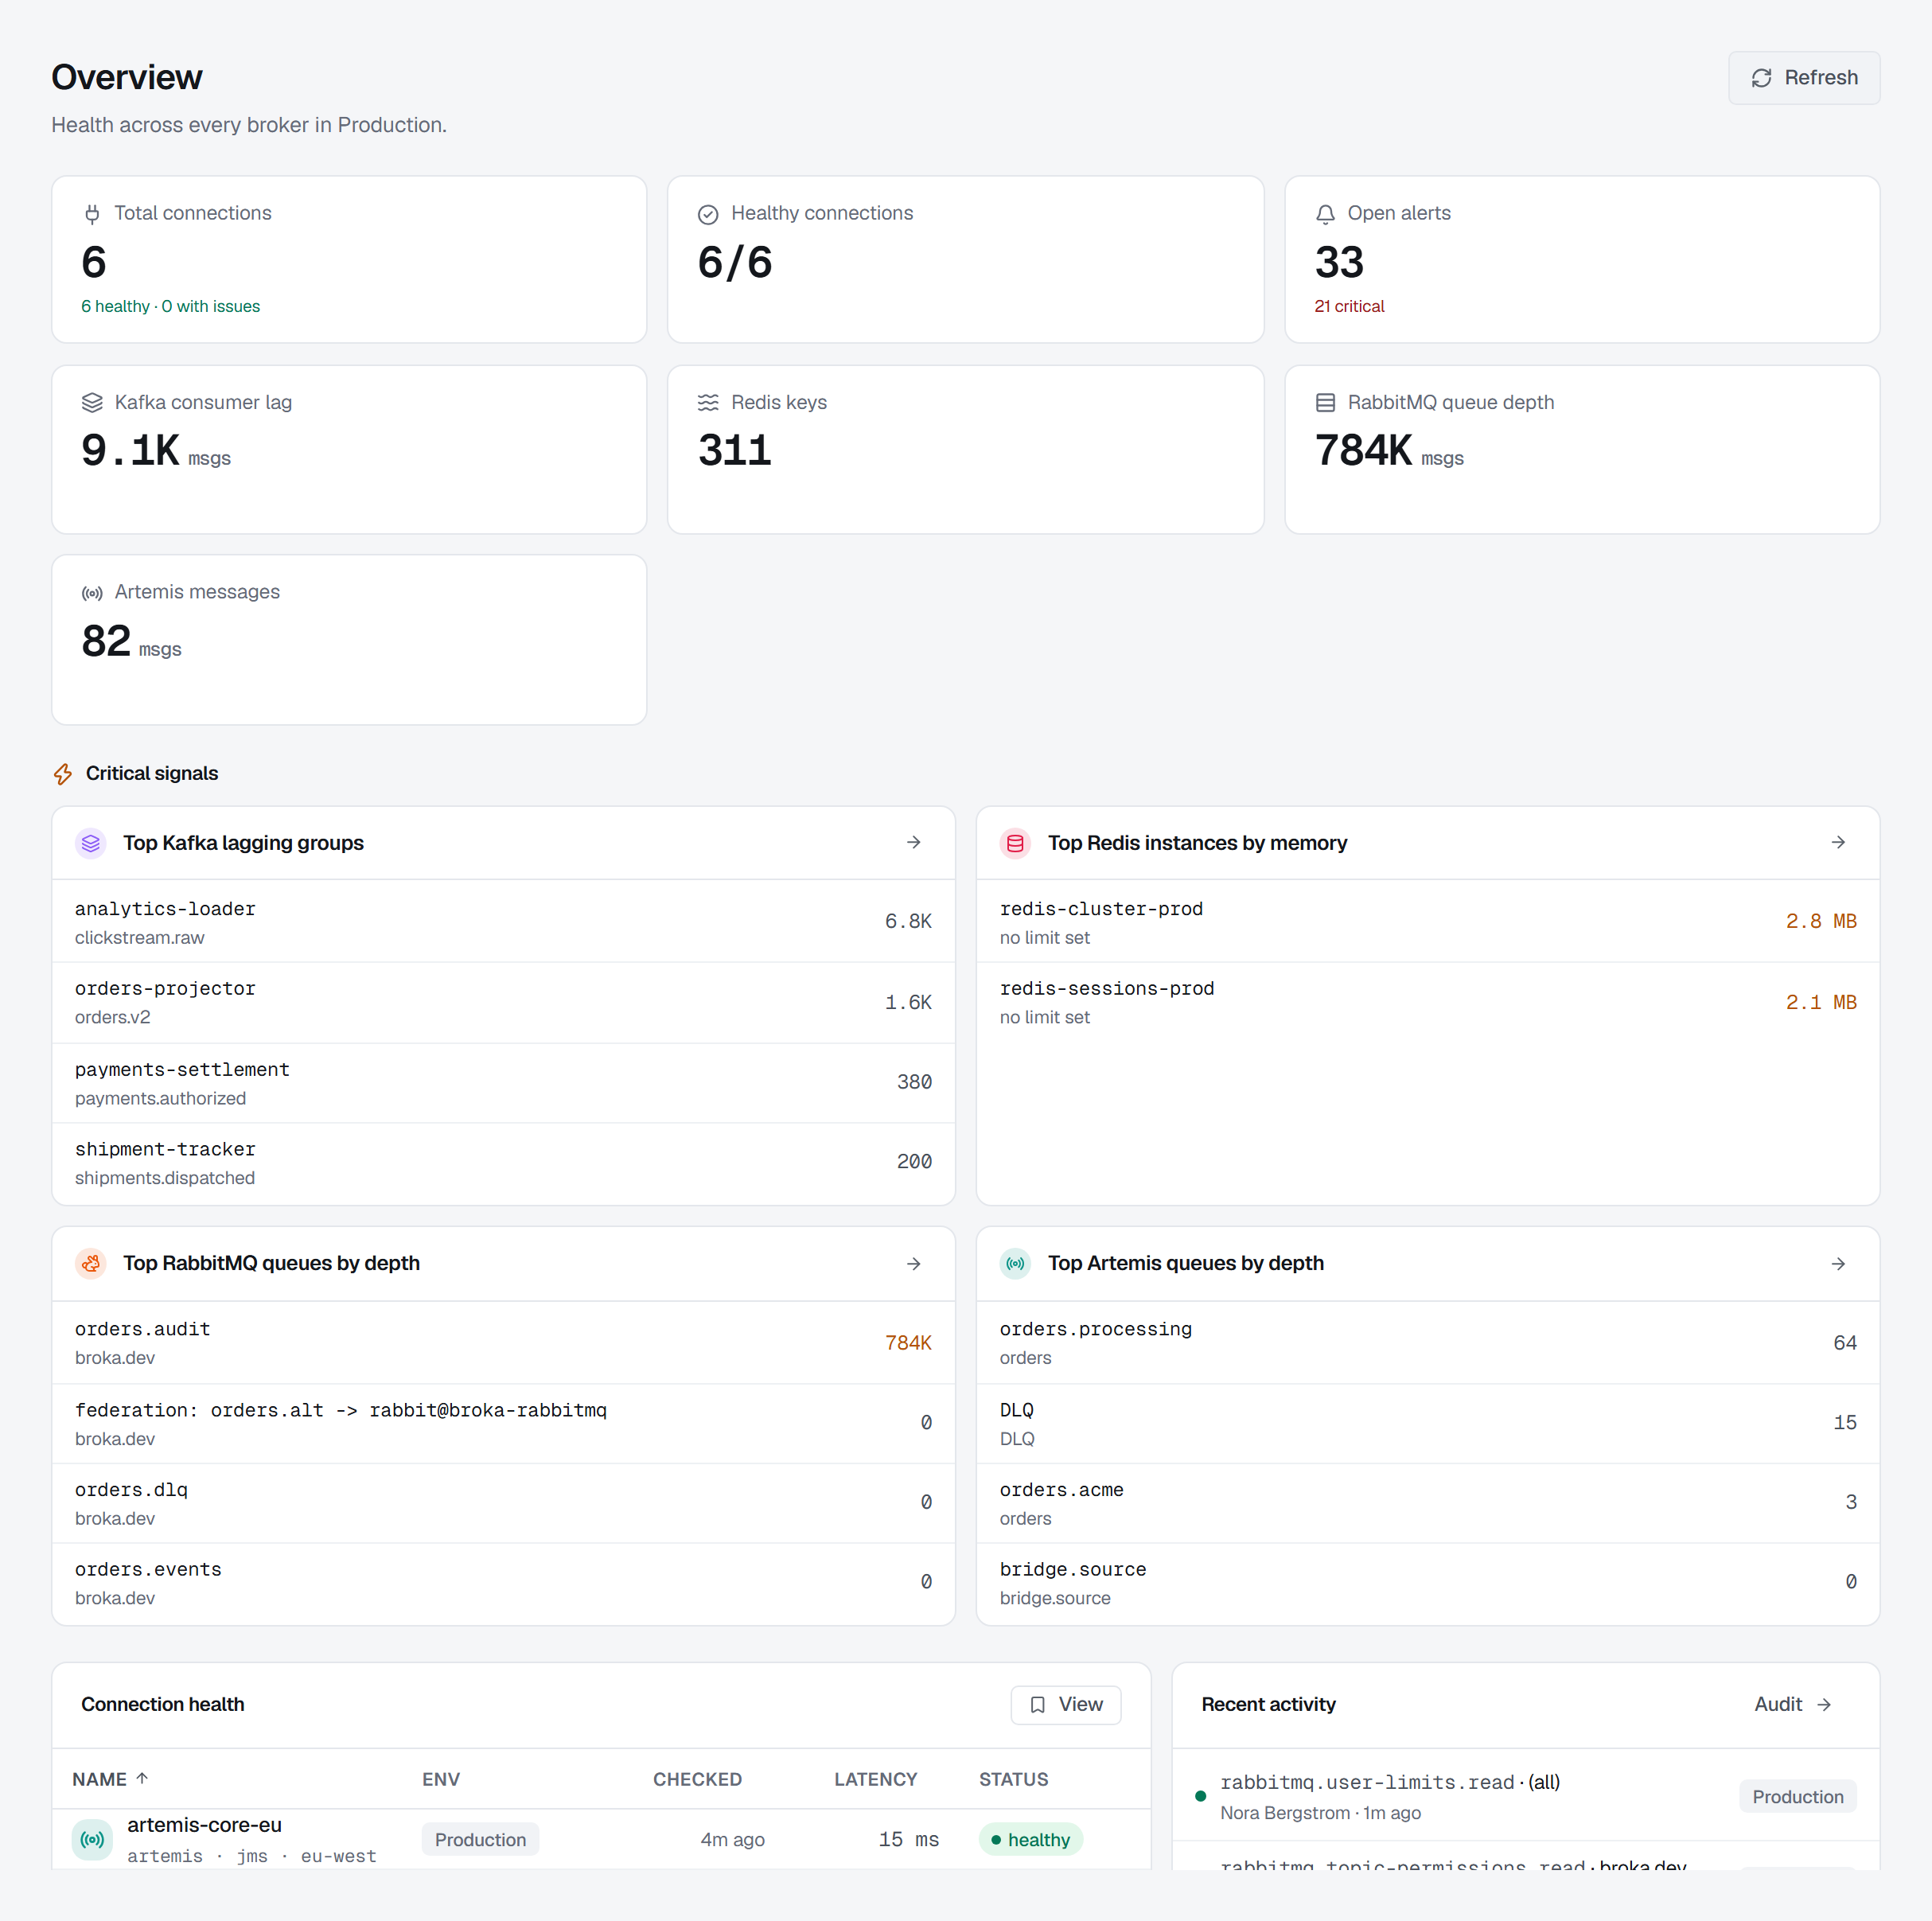
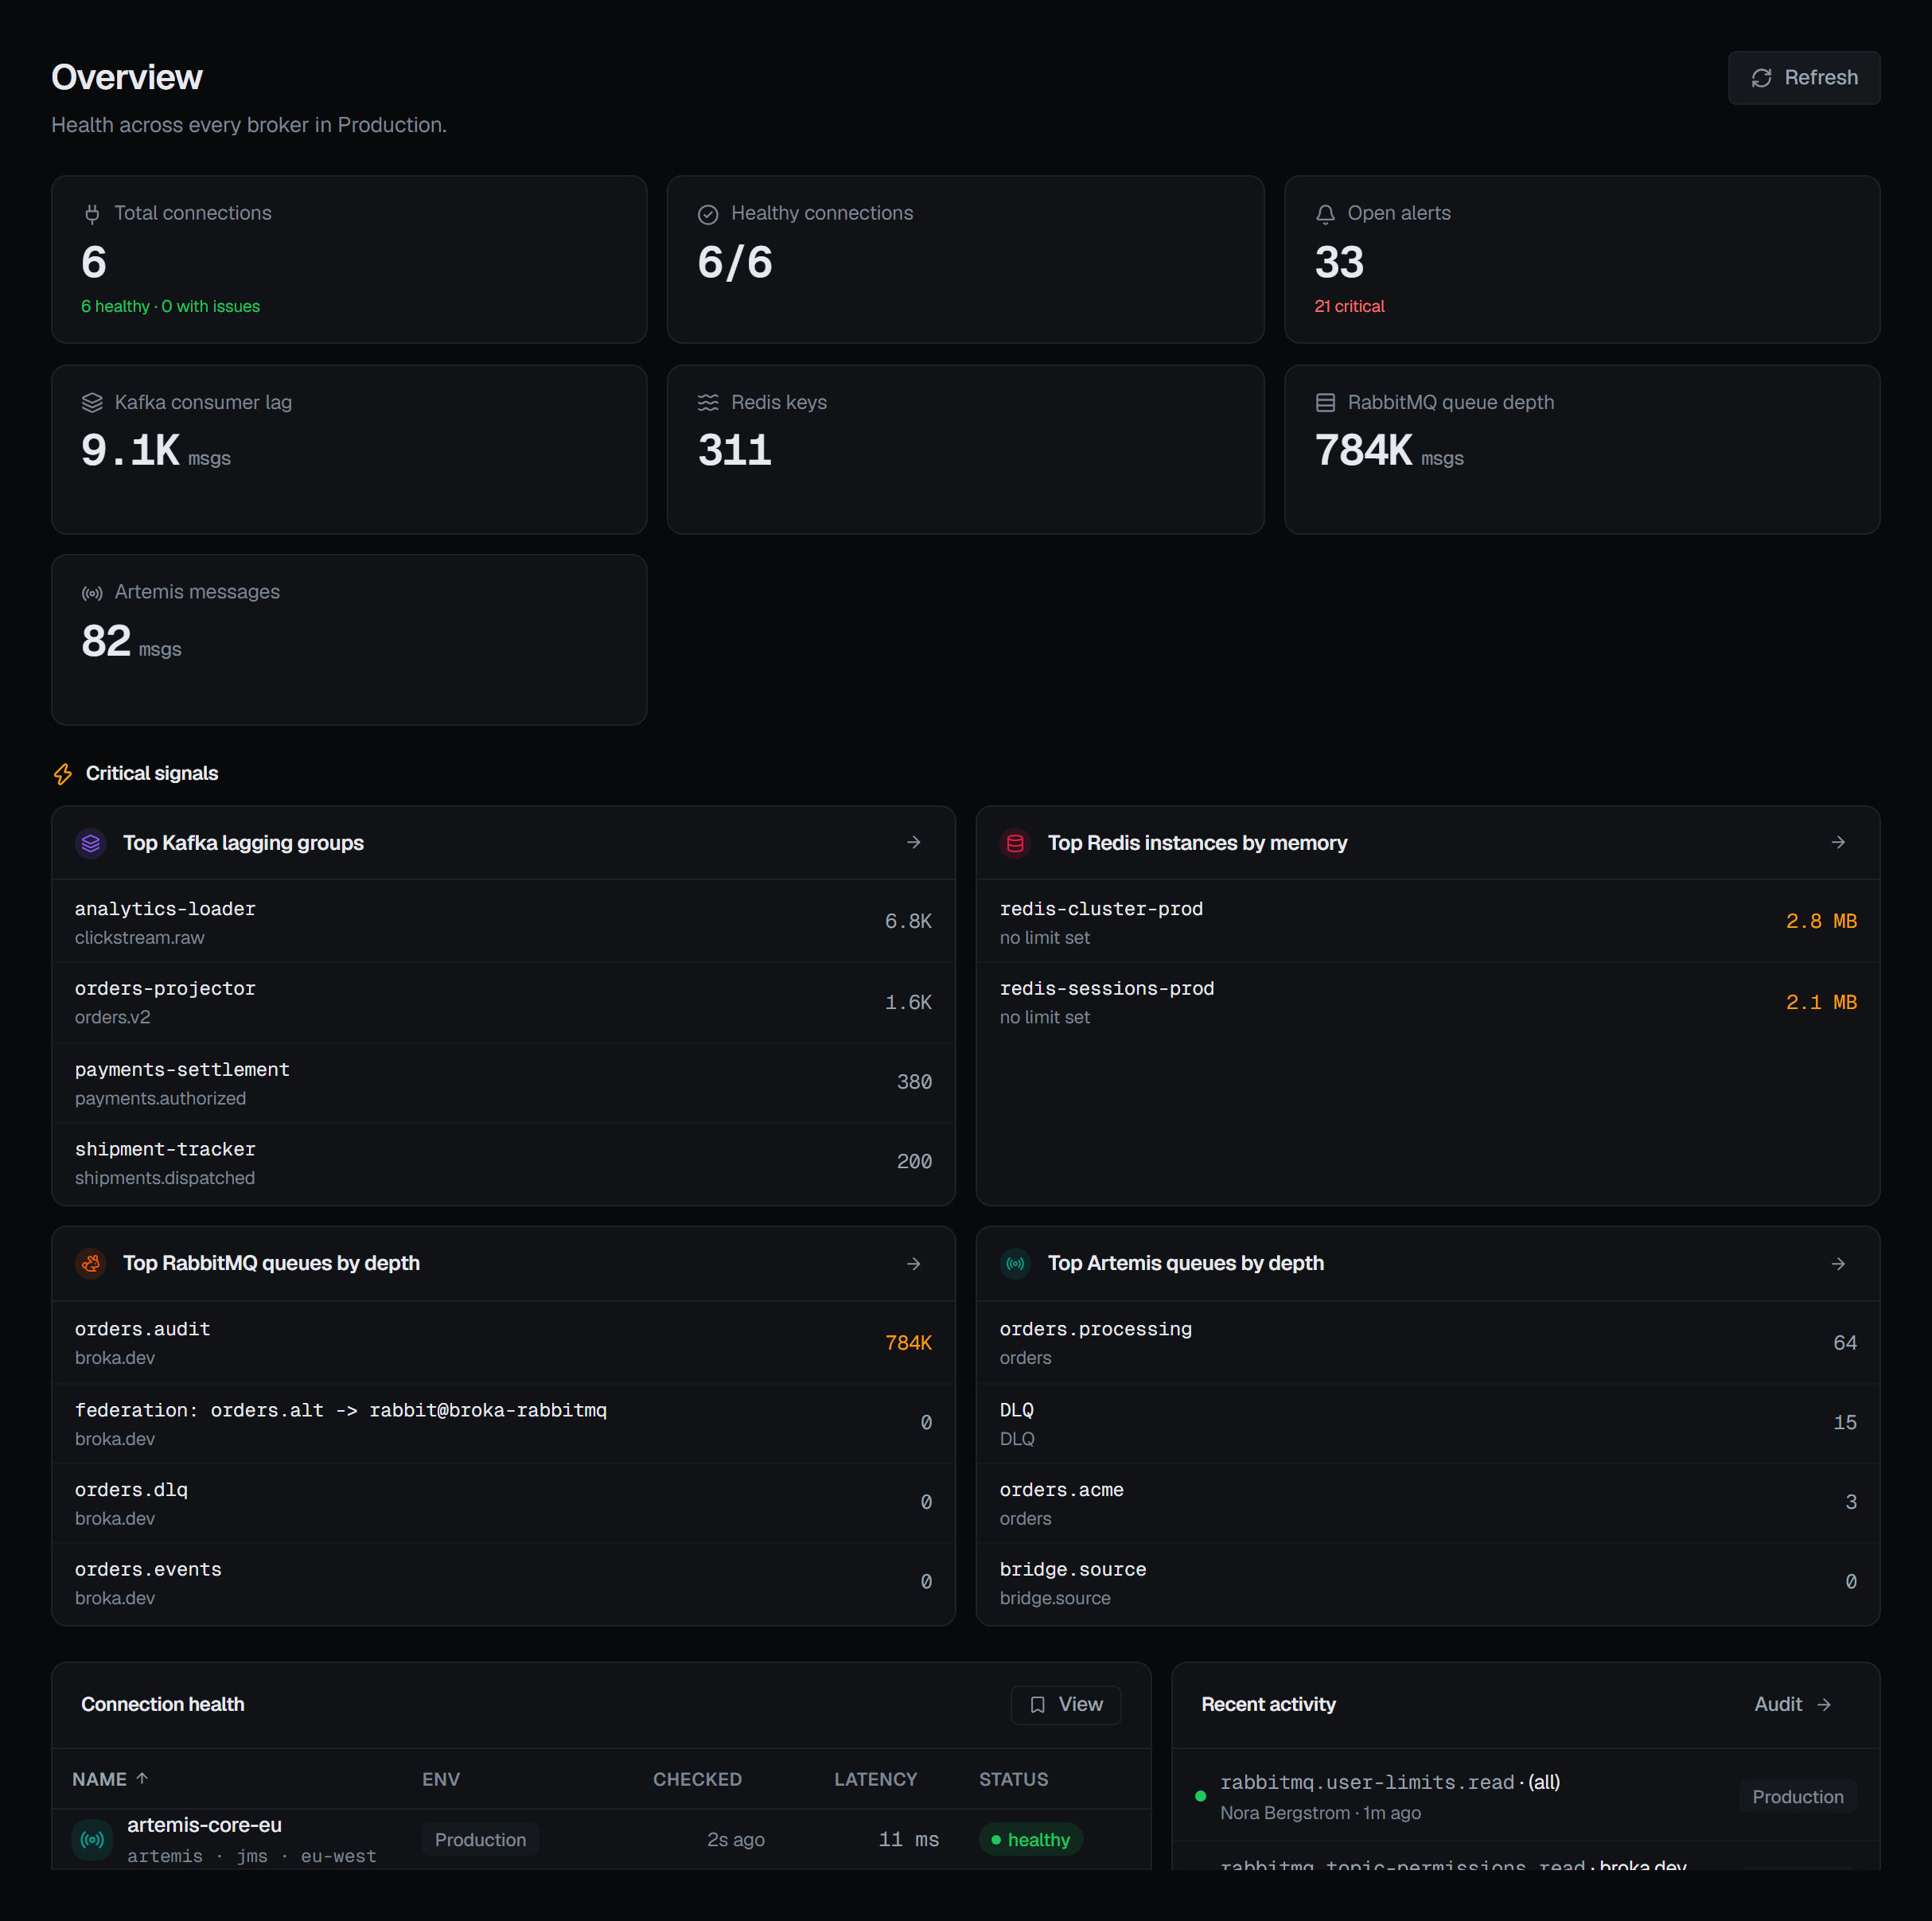
The Dashboard is where the console opens, and it answers one question: is anything wrong in this environment right now. It is scoped to the environment selected in the top bar, so switching environments changes every number on it.
What the cards count
The top row counts connections and the headline figure for each platform your installation serves: total and healthy connections, Kafka consumer lag, Redis keys, RabbitMQ queue depth, Artemis messages.
Two things about those figures are worth knowing before you act on them.
A card appears only if your installation actually serves that platform. The Community edition links only the Kafka module, so a Community install has no Redis or RabbitMQ card rather than one reading zero. Zero and not present are different answers and the screen keeps them different.
A broker that withheld a figure contributes nothing, not a zero. The per-platform totals are the
sum of what the brokers themselves reported. If one Redis server refuses INFO, or a RabbitMQ cluster
returns queues without statistics, that server is simply absent from the total. The consequence is
worth stating plainly: these totals can read lower than your estate really holds, and never higher.
Critical signals
Beneath the cards, one panel per platform lists what is furthest behind — the Kafka consumer groups carrying the most lag, the Redis instances using the most memory, the deepest RabbitMQ and Artemis queues. Each panel opens the full screen for that platform.
The Artemis panel leaves out the broker's own queues — a cluster's store-and-forward queue and the like — by the same flag the Queues screen hides them by, so a broker's internal traffic does not crowd out your applications' queues.
There are no sparklines, deliberately. Nothing in BROKA keeps a history of these numbers, so a line would have to be drawn from data that does not exist. What you see is the current reading.
Connection health and recent activity
The connection table is each connection's last recorded health — its status, latency and when it was checked — as left by the last test run by someone who may edit it or the last screen that reached its broker, not a probe run because you opened the page. The Checked column says how long ago that was, and never for a connection nothing has reached yet.
Recent activity is the five newest entries from the audit log for this environment, plus the estate-wide changes that belong to no environment at all: an application, a template or a user has no environment to be filtered by, and filtering them out once meant the panel showed a resource being bound without ever showing the application it was bound to. Sign-ins are excluded — they are the bulk of those environment-less rows and would fill all five slots. The full trail is under Audit logs.
What the Dashboard does not do
It does not evaluate anything itself. Every figure here is a reading of the current state, taken when you loaded it. The watching is done by the rules on Alerts, and this screen carries their result rather than producing it: the Open alerts card counts the incidents currently open in the environment you are looking at, and how many of them are critical. It appears only once at least one alert rule exists and you may see alerts — an installation that has written no rule is not one with nothing wrong, and a green zero there would say otherwise.
Refresh is manual. The button beside the title re-reads every panel. The screen does not poll, so a figure you have been looking at for ten minutes is ten minutes old. An open incident is the one thing you do not have to come here to find — the bell in the top bar carries it.