

Search indexes
Updated 1 October 2026 · applies to 1.0.0 · Commercial
Redis's query engine keeps secondary indexes over hashes and JSON documents: an index declares which keys it covers and which of their fields it reads, and the server keeps it current as those keys change. Search Indexes, beside Keys in the navigation, shows the indexes a server has, what each one is and how healthy it is, and lets you query one.
This is the server's own query engine, over the contents of keys. Finding a key by its name across every connection is a different thing — see Search.
Where it is available
The query engine ships with Redis 8, and as the RediSearch module before it. BROKA finds out from the server's module list. On a server without it — Redis 7.4 without the module, for instance — the Search Indexes entry is shown greyed out, with the reason, and the screen says This server has no query engine with the server's own reason.
The query engine indexes database 0 only; Redis refuses to create an index in any other. So this screen does not follow the database switcher: the indexes are the same whichever database you are in.
The list
Each index with what it indexes — hashes or JSON — how many documents it holds, its state, and how many documents failed to index. The state reads indexed, or indexing with a percentage while the server is still working through the keys that existed when the index was created; until it finishes, a query finds only what it has reached. A failure count that is not zero stands out. Filter narrows the list by index name.
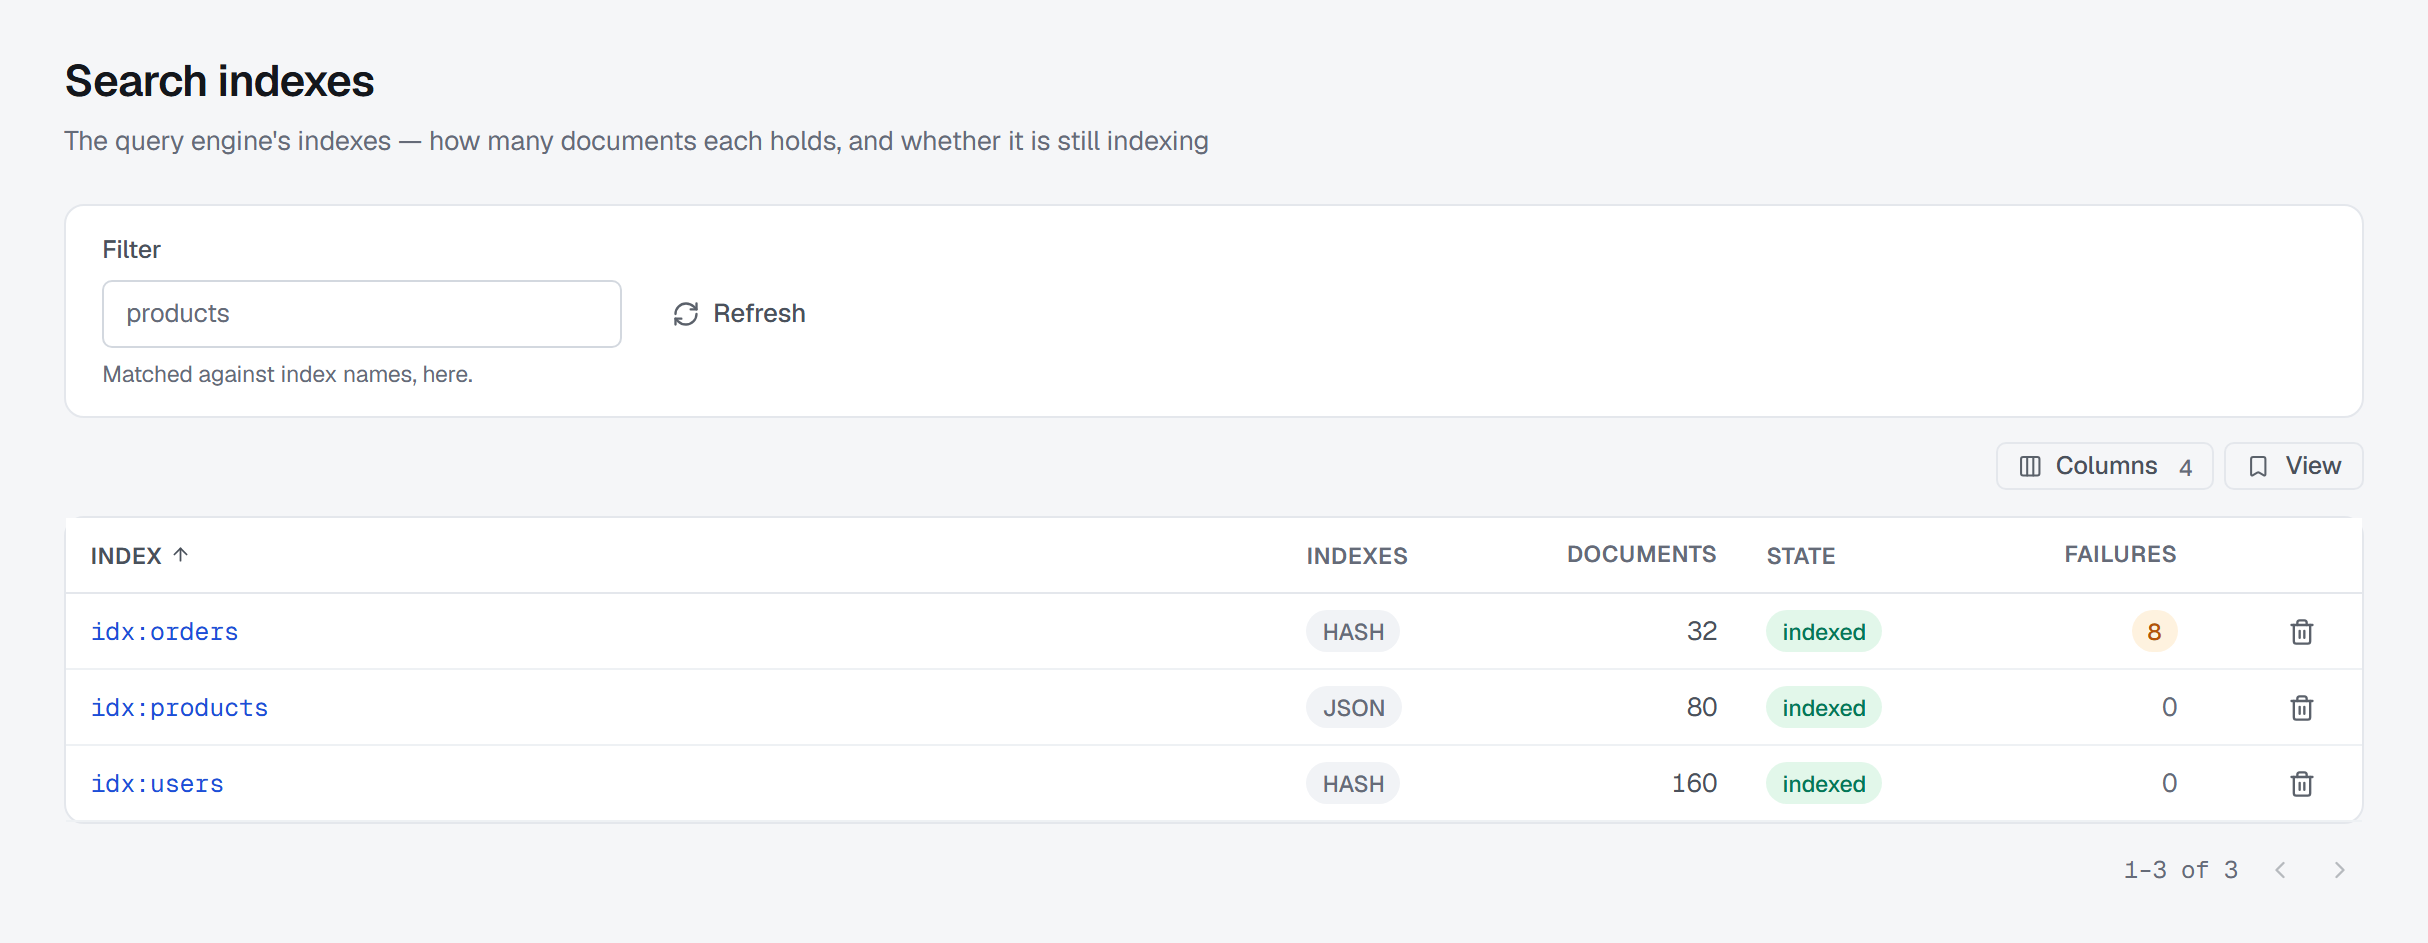
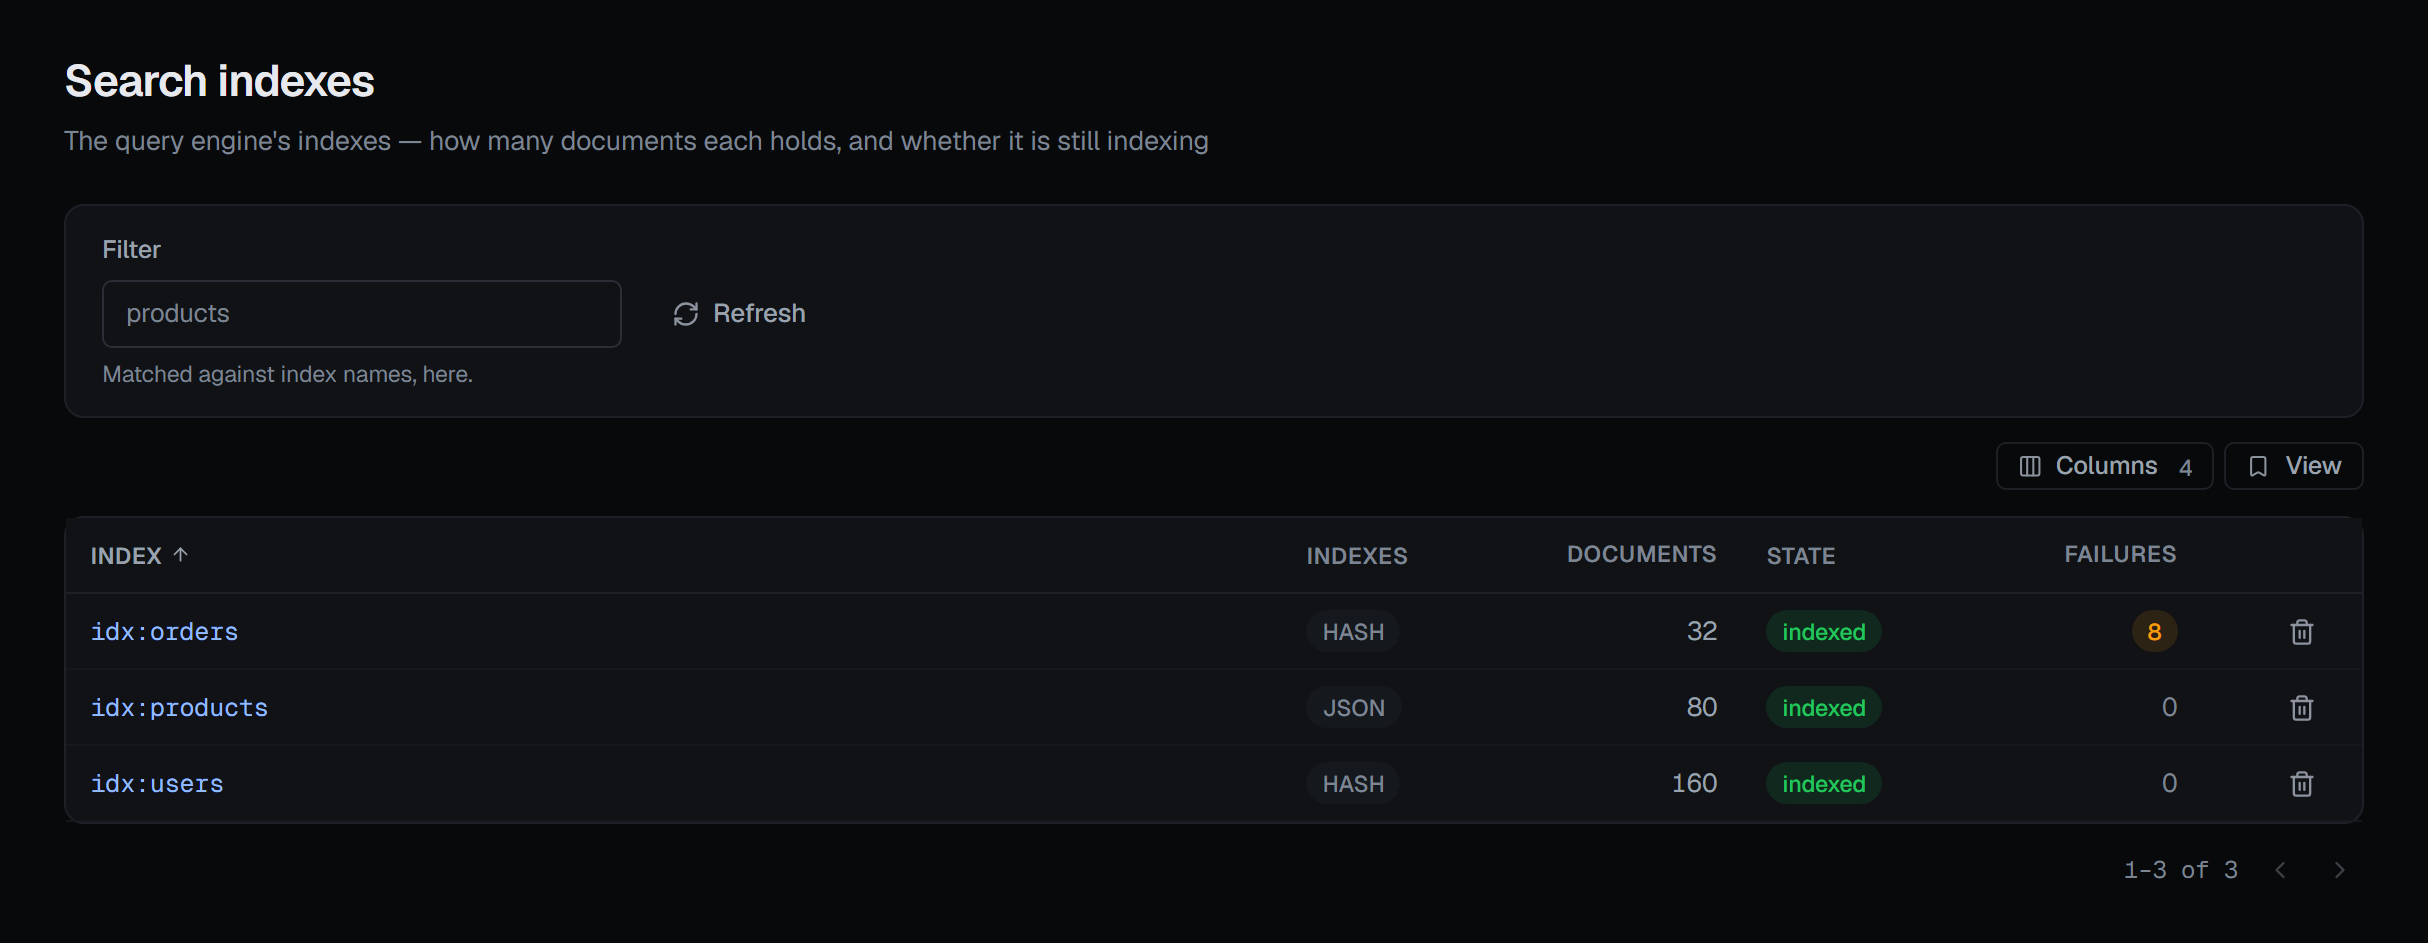
The list names indexes and nothing else, so anyone who may view the connection sees it. An index whose description could not be read keeps its row, with the reason on the figures it could not give.
One index
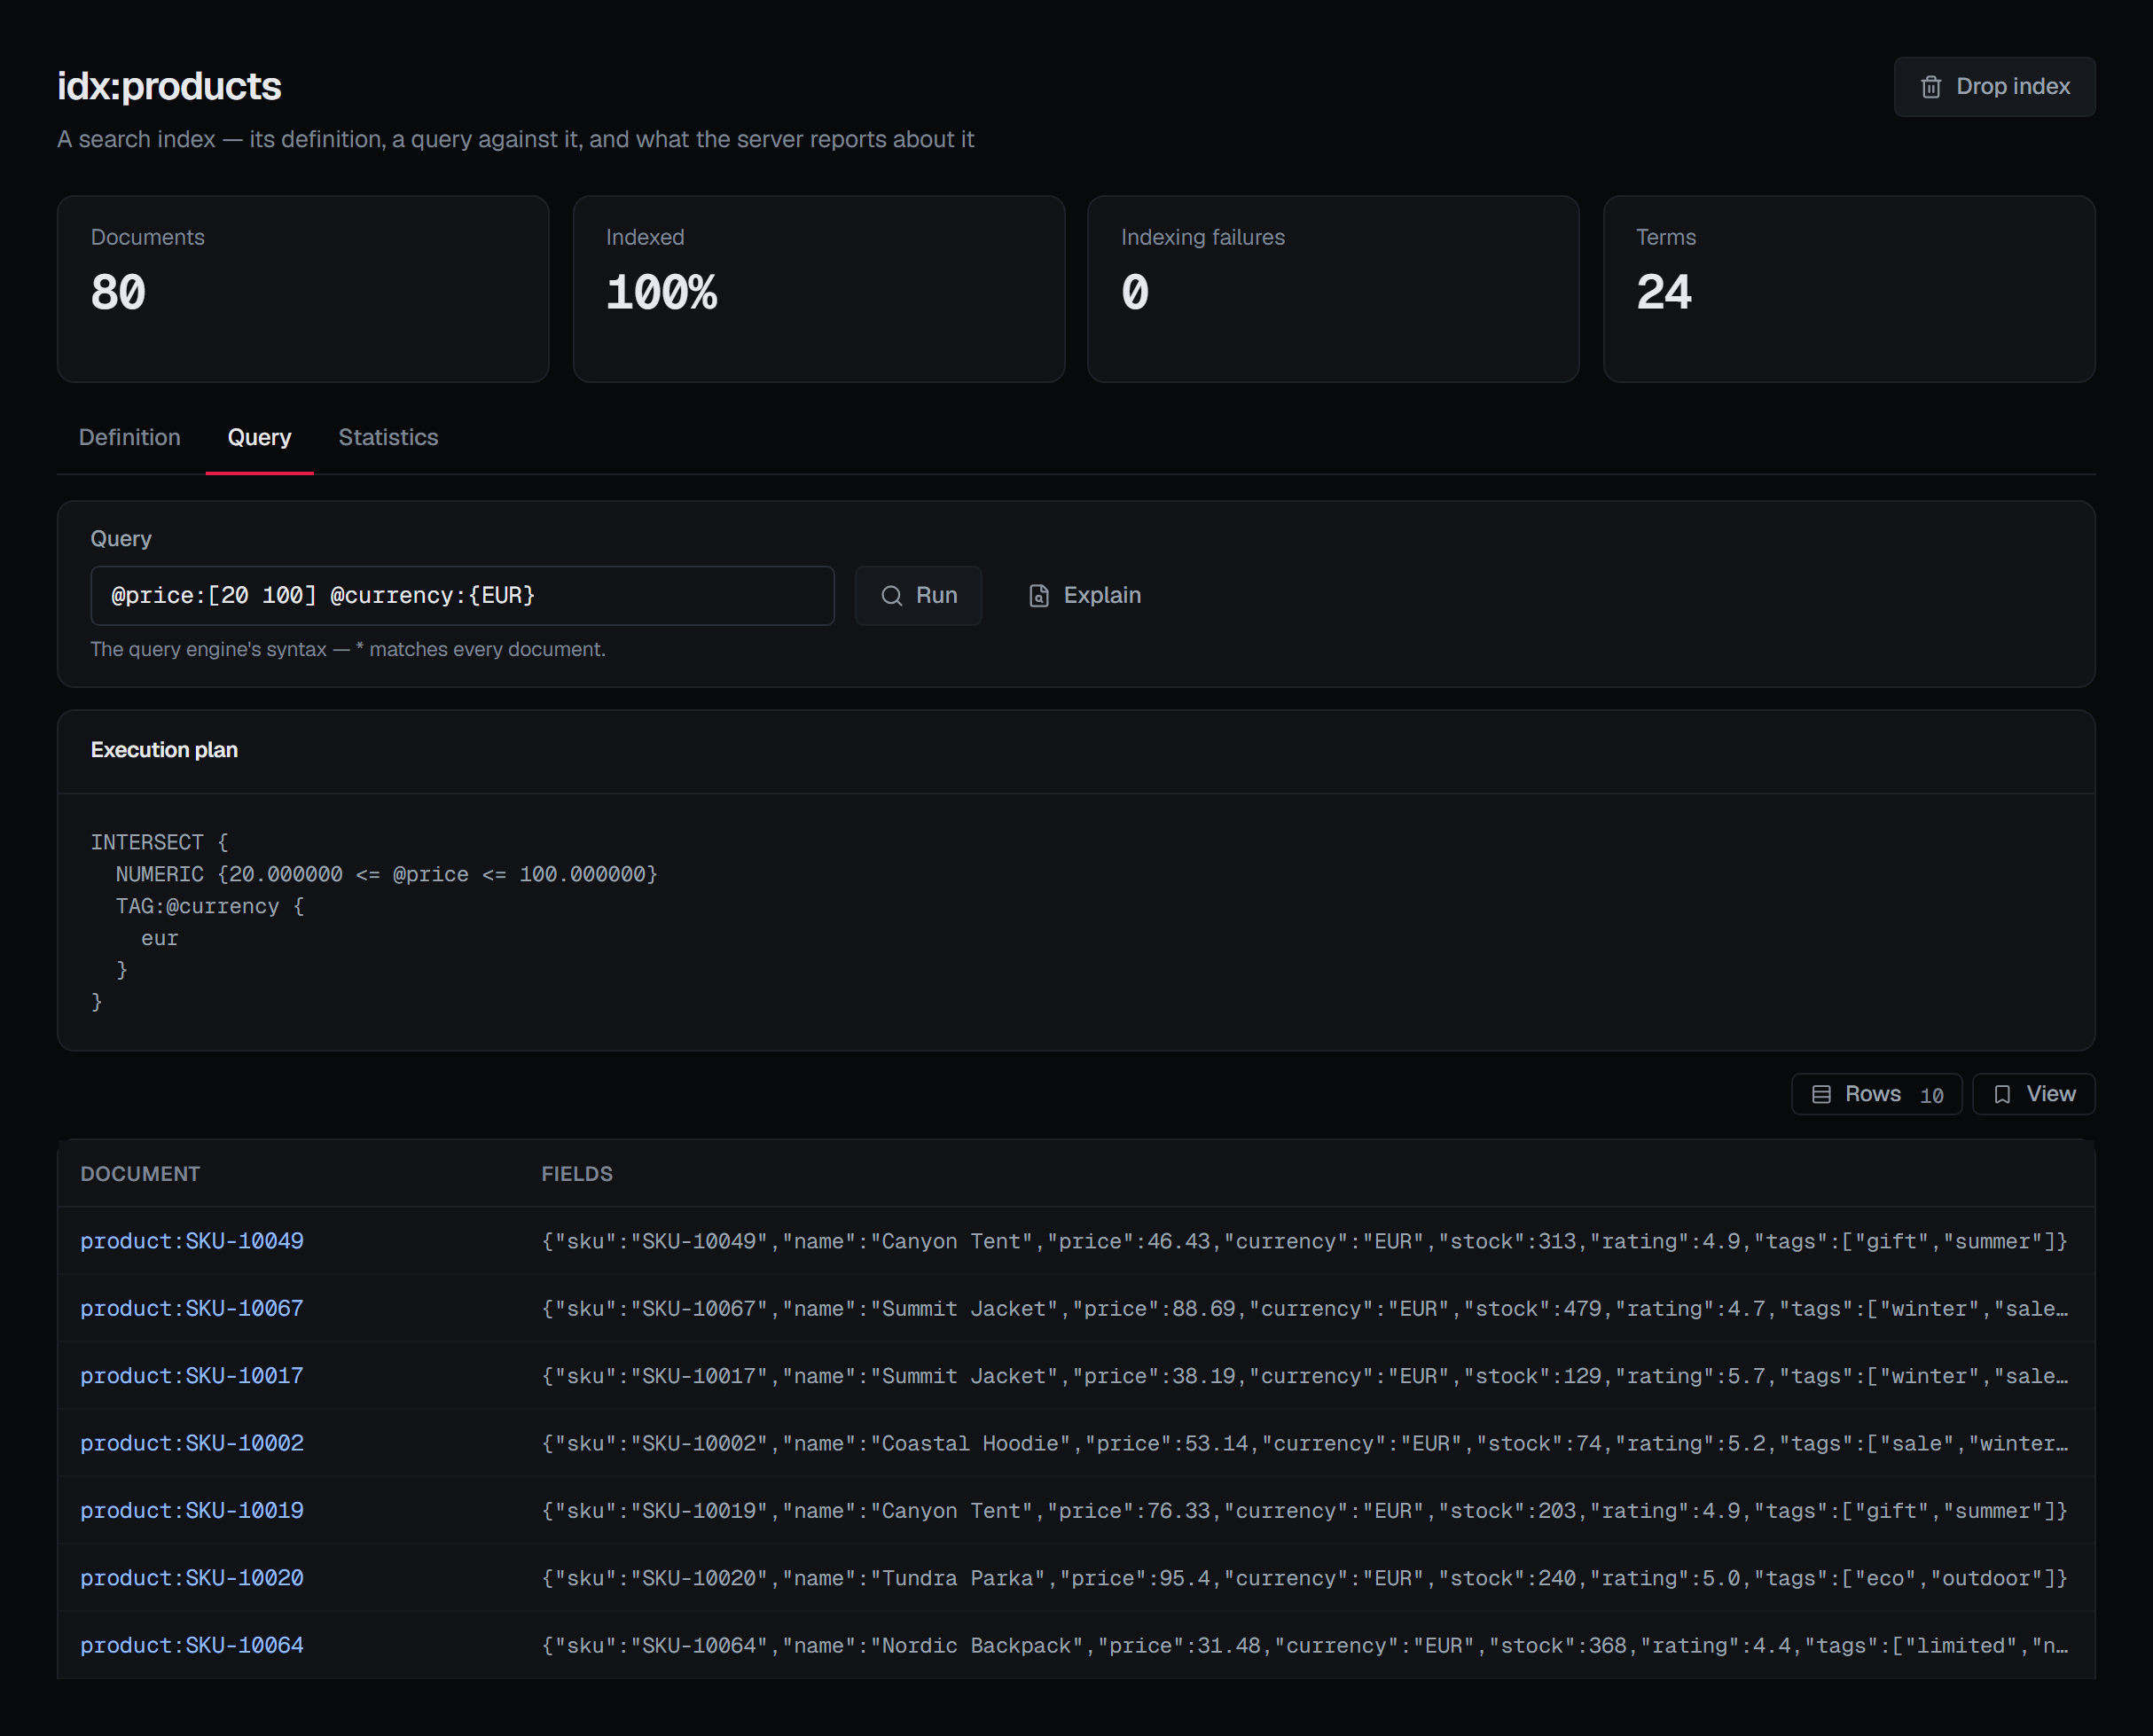
Opening an index shows four figures across the top — Documents, Indexed, Indexing failures and Terms — and three tabs: Definition, Query and Statistics.
Definition is what the index is: what it indexes, the key prefixes it covers (every key where the prefix is empty), its filter, its default language, its options and its aliases. A server that does not list an index's aliases shows them as unknown rather than as none. Beside it, Indexing errors: the failure count, the last error, the last key that failed, and the state of background indexing. Under both, the schema — one row per attribute, with its type, its options, and how many documents failed on it. Where an attribute's query name differs from the field or JSON path it reads, both are shown.
A definition names keys — its prefixes are the front of key names, and the last failing key is one — so opening an index takes the same access as listing keys, and it is recorded in the audit trail the same way.
Statistics is every other figure the server reports for the index, under the server's own names and in its order. A figure a later Redis adds appears under its own name rather than being dropped.
Querying
The Query tab takes a query in the engine's own syntax, * for every document. Run asks first:
the documents that come back are keys with their fields — a disclosure of what your applications keep
there — so every page you read is recorded in the audit trail, and running a query takes the same access
as listing keys, and Read message contents (messages.read) besides. Nothing is read until you confirm.
Results come back in the engine's order, its ranking, and no column re-sorts them: a page re-ordered in the browser would no longer say which documents matched best. Pages are the engine's own, from 10 to 100 documents, with the total. Selecting a document opens its fields; a JSON document shows the document itself. A field longer than 4,096 characters is cut, and says where; a field that is not text, such as a vector, is shown as binary with its size and never decoded. A query the engine cannot parse is refused in the engine's own words, and anything the engine warns about is shown above the results.
Explain shows the Execution plan for the same query — how the engine will evaluate it. It reads no document, so it does not ask first, and viewing the connection is enough.
![The index idx:products on its Query tab: Documents 80, Indexed 100%, Indexing failures 0 and Terms 24 across the top and Drop index in the header; the query @price:[20 100] @currency:{EUR} with Run and Explain; the Execution plan, an INTERSECT of a numeric range on @price and the tag eur on @currency; and the matching JSON documents with their fields, product:SKU-10049 first.](/shots/docs/redis/12-search-index-query.light.webp)
Dropping an index
Drop index, in the index's header — or the bin on its row in the list — asks for a reason, as every destructive action does. By default the index goes and the documents it indexed stay in the keyspace: queries against it stop working, and creating it again re-reads every key it covers.
Ticking Also delete the documents it indexed deletes those keys too — the dialog says how many, and the button becomes Drop and delete documents. Redis keeps no copy. The box starts unticked every time the dialog opens, so deleting the documents is never carried over from the last drop.
The drop is recorded with how many documents the index held, read just before it. It needs write permission on the connection, and it is not offered in a read-only environment or on a connection frozen with its own read-only switch.