

Clusters
Updated 30 September 2026 · applies to 1.0.0 · Community and Commercial
A connection is a cluster. There is no cluster object to register on top of it and no hierarchy to build underneath — you add a connection, and the cluster switcher in the top bar is how you move between the ones you have.
The Kafka section opens on that cluster's overview.
What the overview reports
A status badge, the cluster id the brokers themselves report, and six figures: brokers, topics, partitions, consumer groups, total consumer lag and under-replicated partitions. Below them, the broker list with the elected controller marked, the five groups with the most lag, and the last five audited actions on this cluster with a link to the audit log.
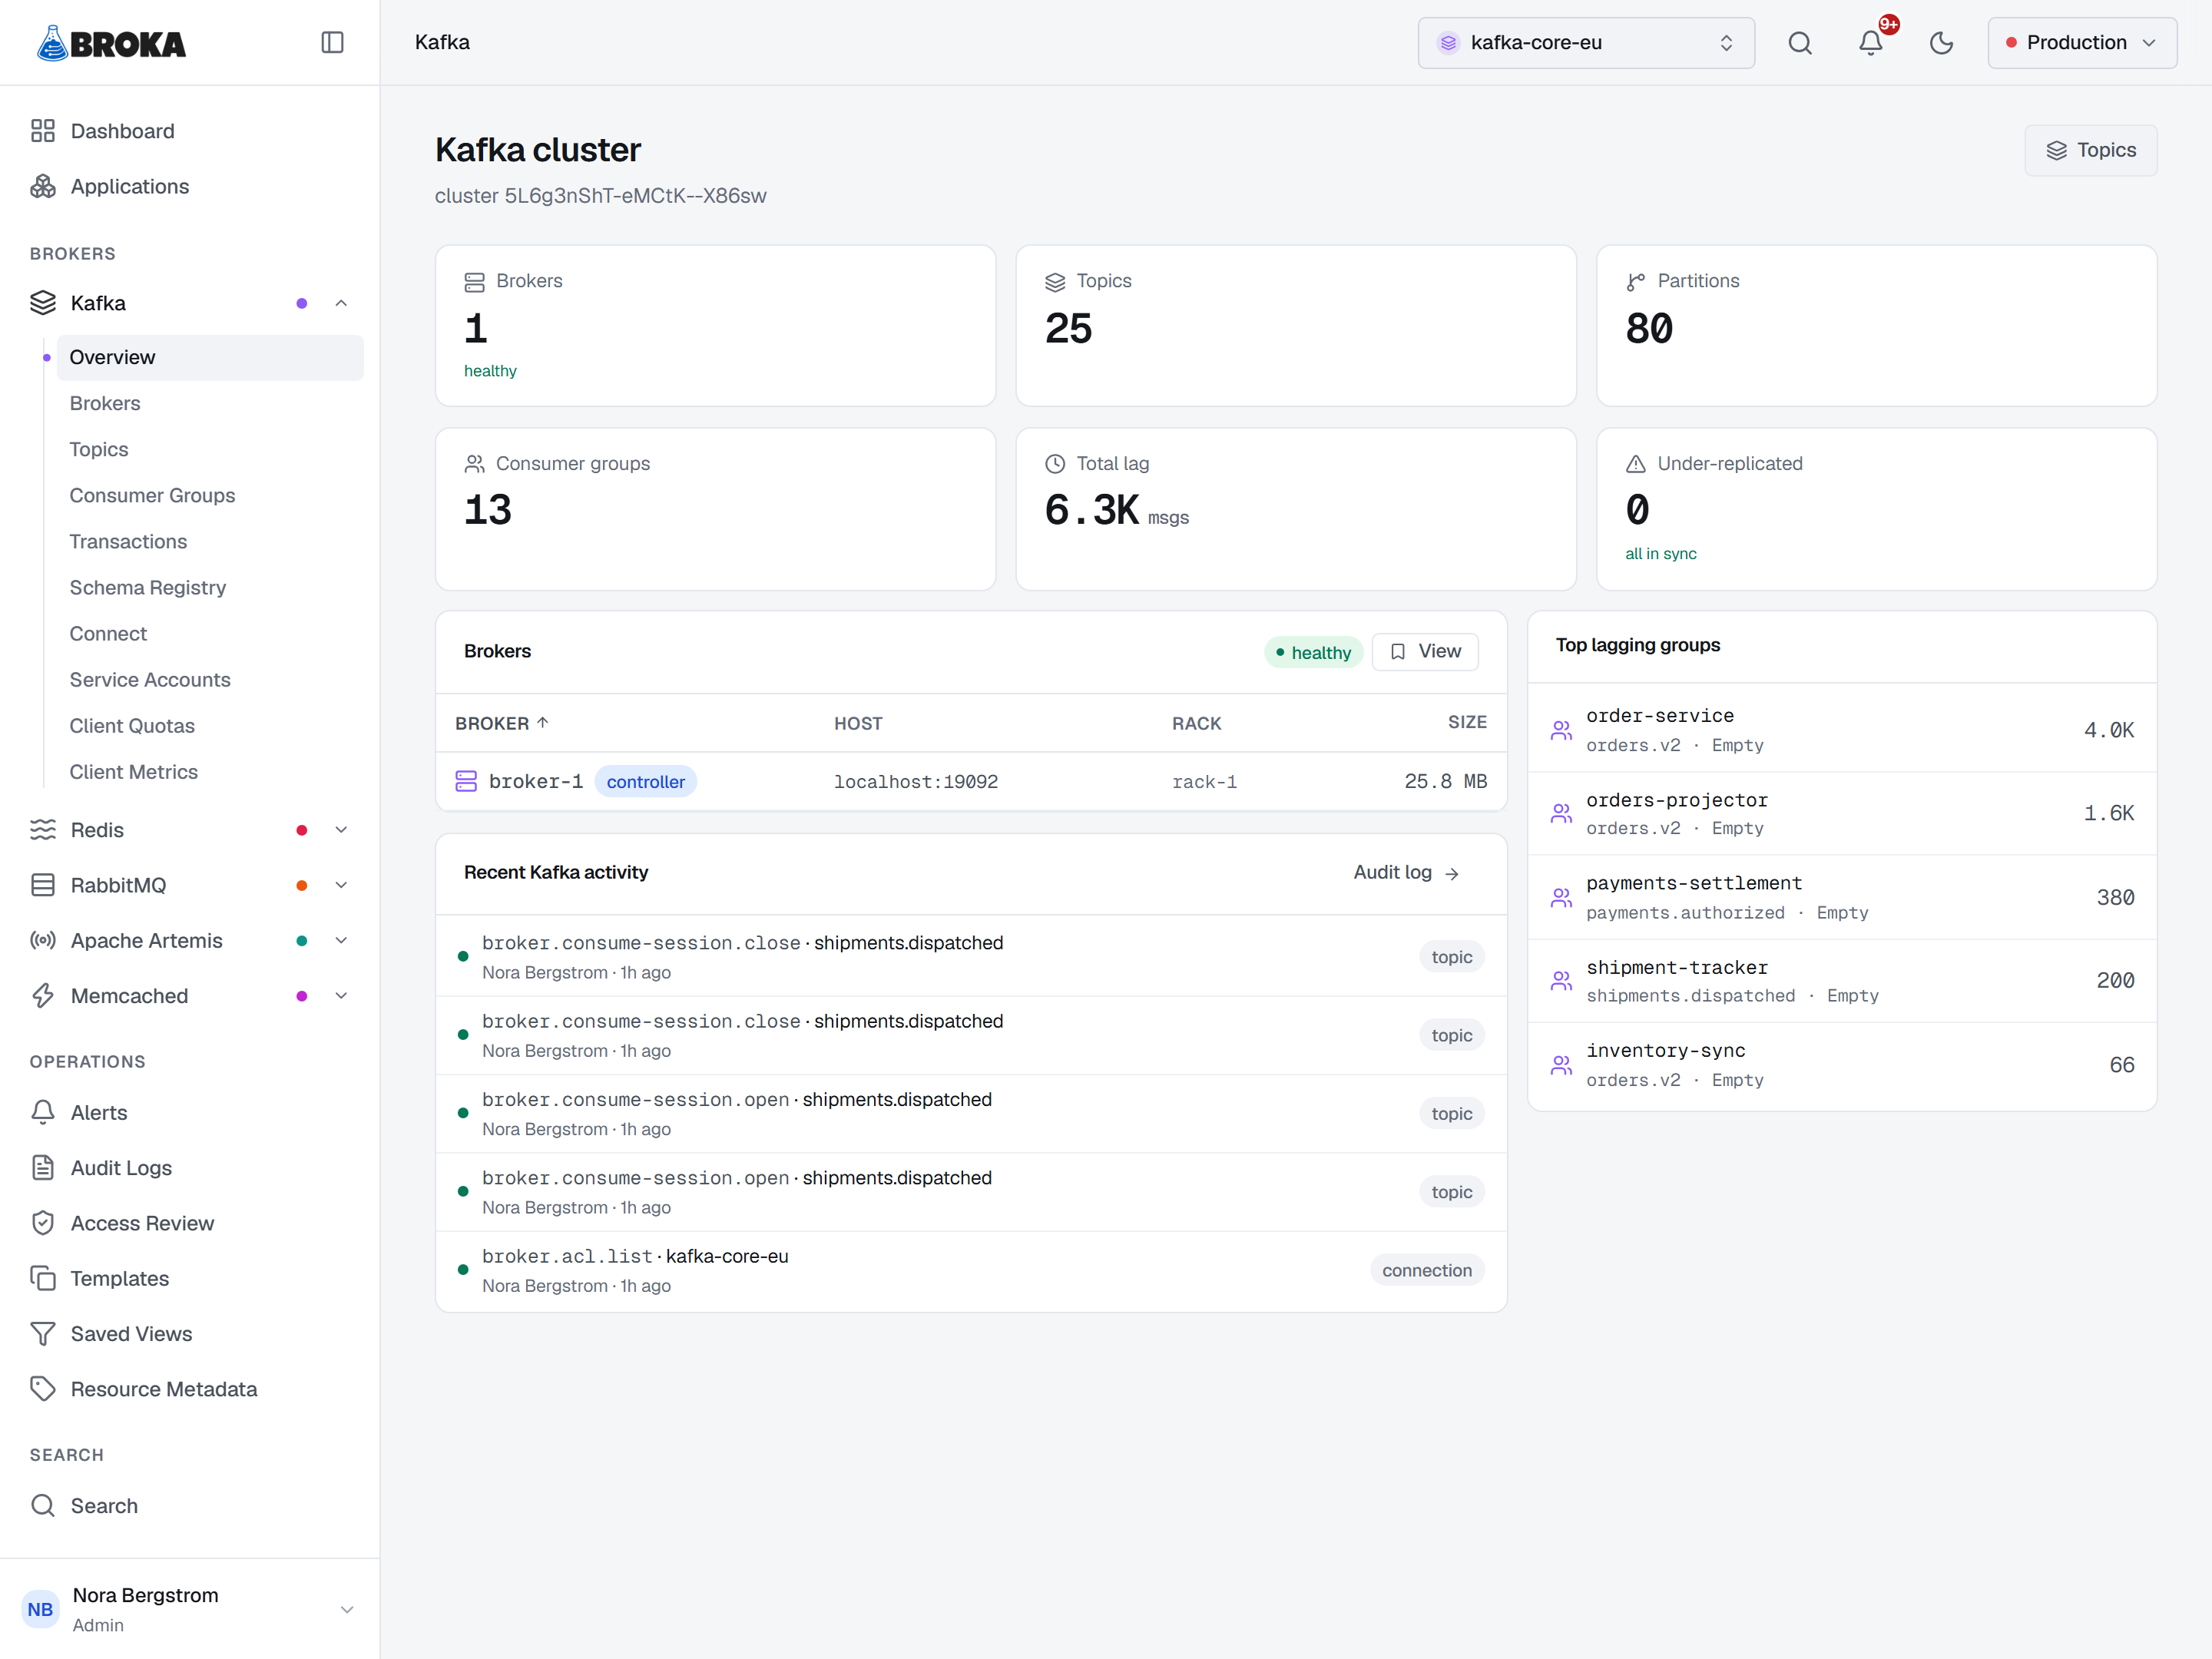
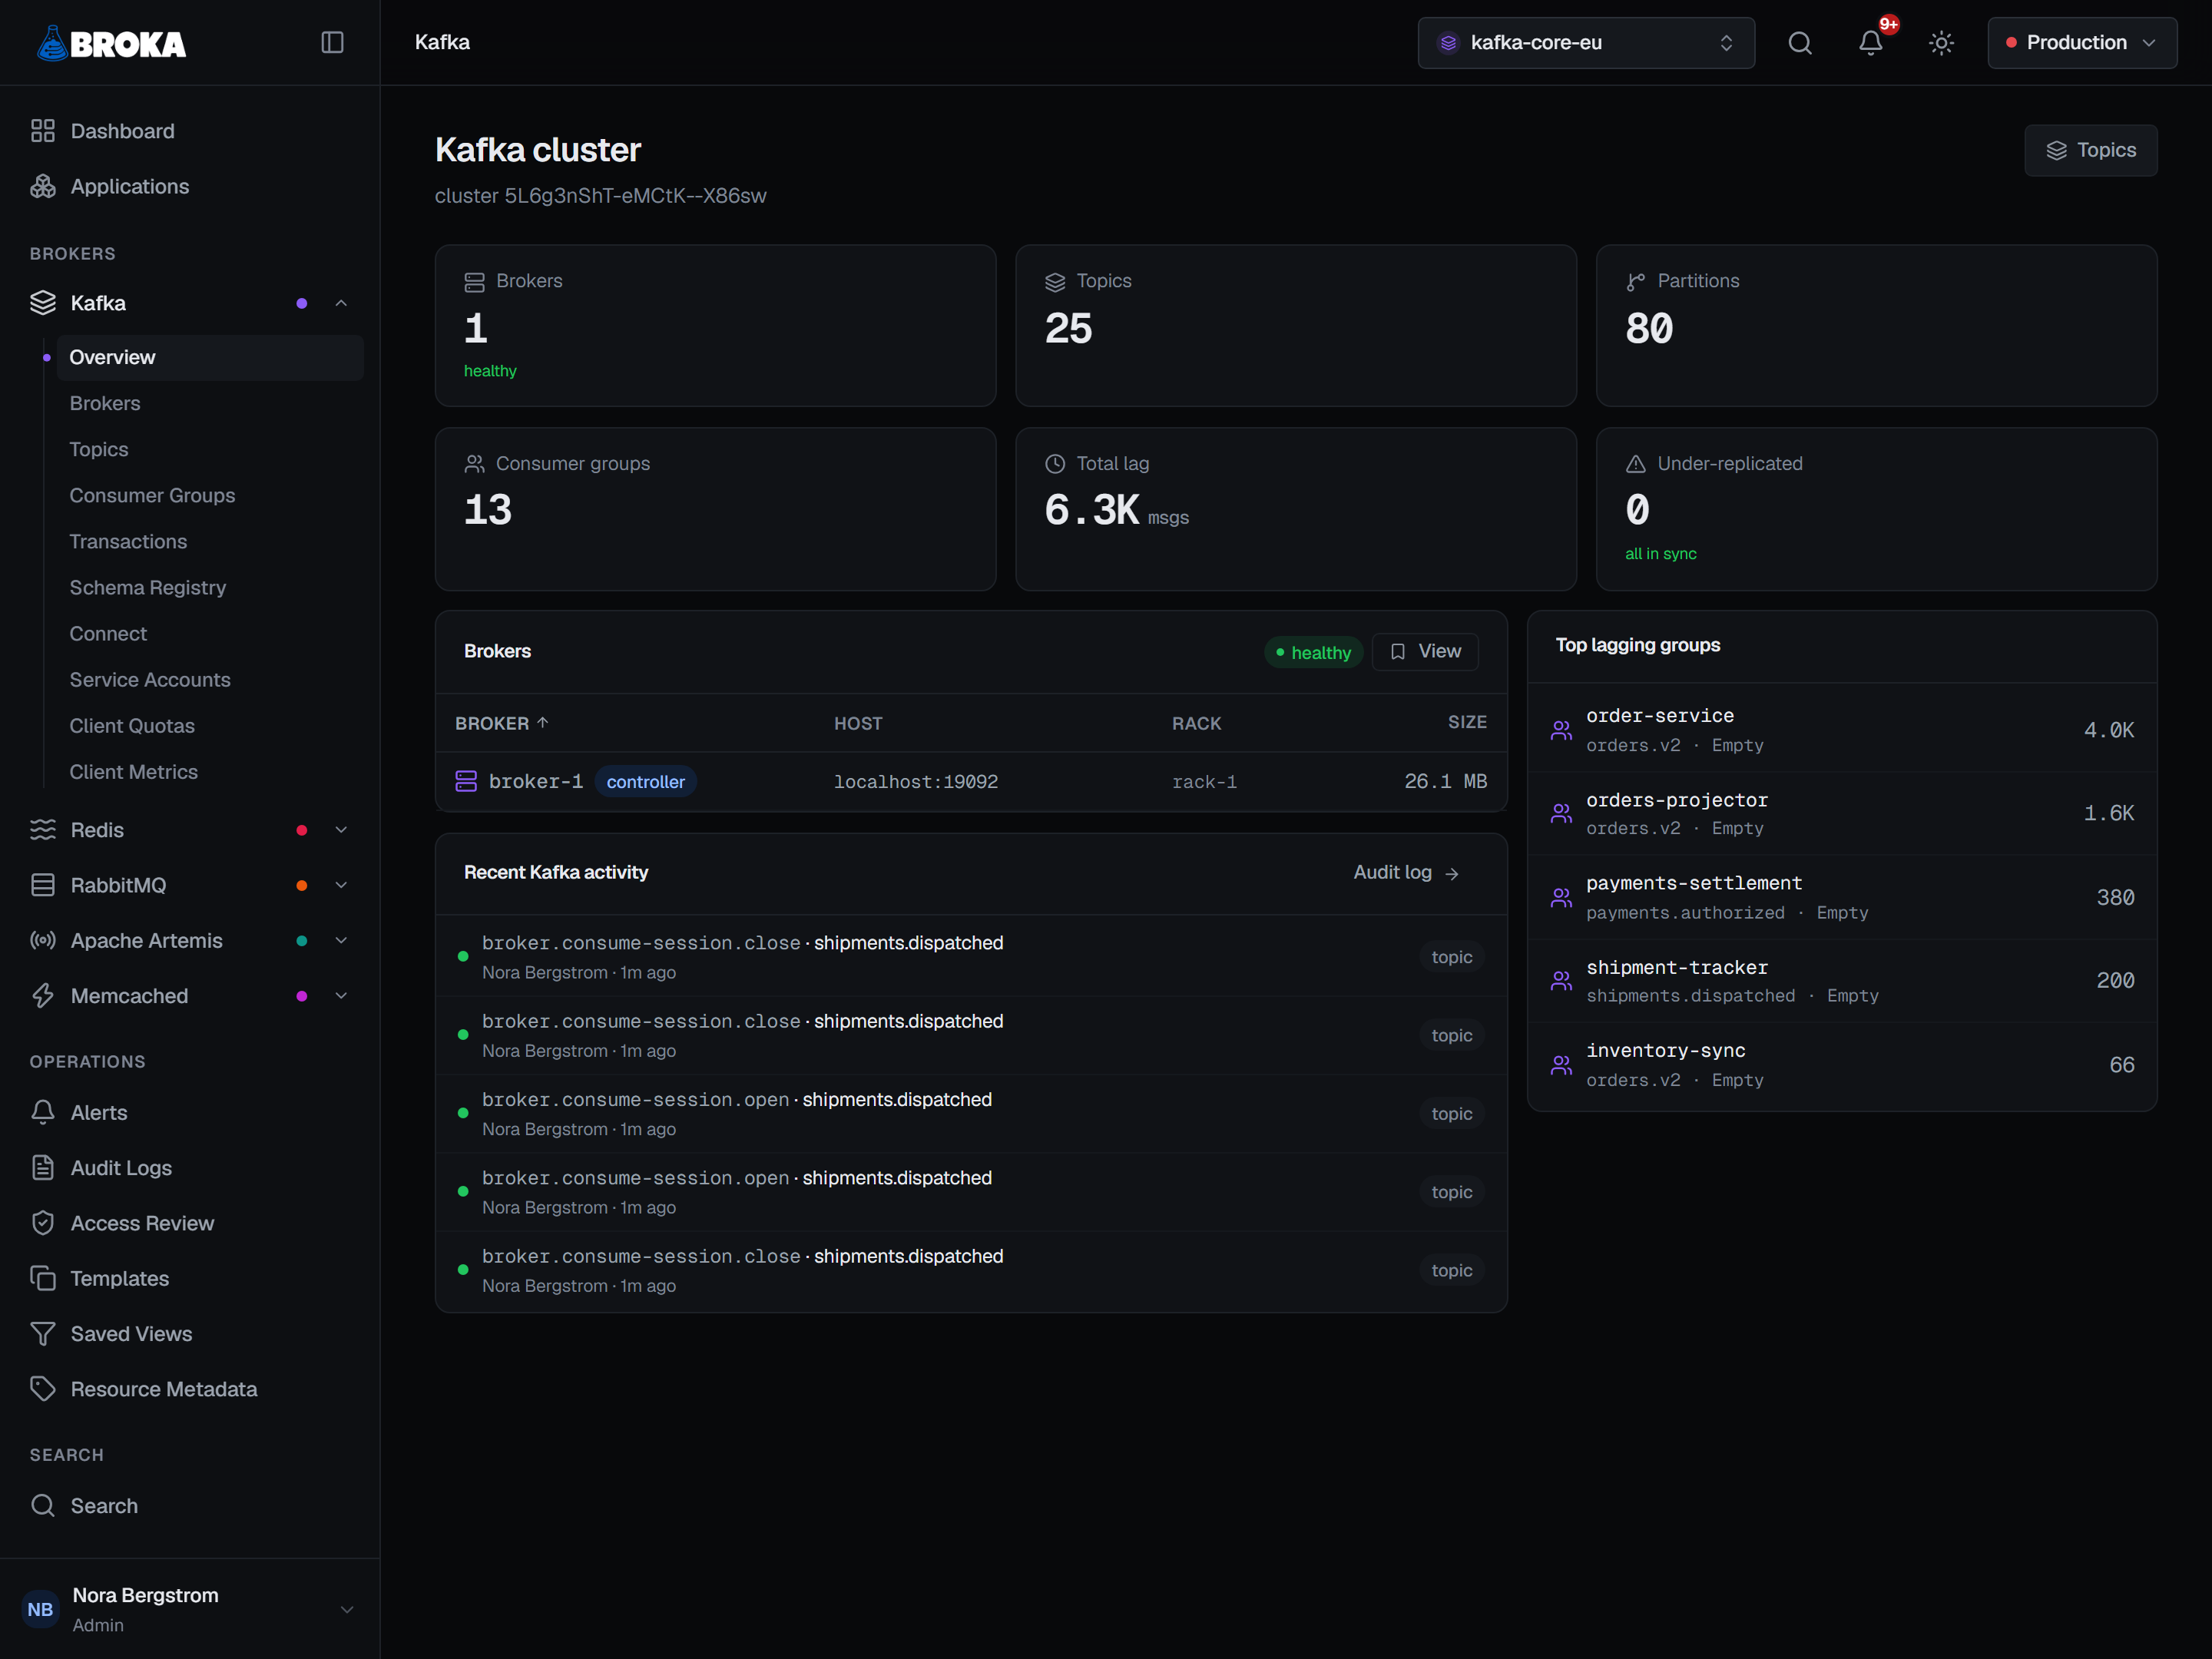
The status, the brokers and the under-replicated count are read from the cluster when you open the page. The topic, partition, group and lag figures come from a snapshot BROKA keeps in memory and refreshes every 30 seconds for a cluster somebody has opened in the last hour, so they can be up to half a minute old; this page has no Refresh button, and the Topics and Consumer groups pages do. BROKA writes none of these figures down and keeps no history of them.
What the status badge actually answers
The badge is deliberately narrow. Healthy means BROKA reached the cluster, saw at least one broker, and found an elected controller. Degraded means it saw brokers but no controller — the state that stops most administrative work, and the one worth a colour of its own.
Replication health is the card next to it, not part of the badge. A cluster with under-replicated partitions is still answering, still electing, still serving — and it is a different problem from a cluster with no controller. The page reports the two separately rather than folding them into one traffic light that would be amber for both and specific about neither.
Under-replicated partitions
The count is the sum of what each broker reports for the partitions it leads: those whose in-sync replica set is smaller than their assigned replica set. Attributing it to the leader is what makes it addable across the cluster without counting the same partition three times.
It reads —, not zero, when the scan could not complete. That distinction runs through the whole console: a number BROKA did not measure is never printed as a zero, because a zero here means "nothing is under-replicated" and that is a claim worth being sure about.
Brokers, briefly
The overview lists each broker with its address, its rack, its on-disk size and a controller badge. On a KRaft cluster the badge marks the active controller — the leader of the metadata quorum. The Brokers page is where that becomes a full picture — per-broker configuration with the source of every value, changeable while the brokers run, their log levels, the partitions each one holds, distribution skew, the quorum and the feature levels, and live graphs.
Opening a page is not a write
The overview only reads, and nothing on this page changes anything on your brokers. The cluster-level actions are on the Brokers page: preferred-leader election (also on a topic's Partitions tab), planning and cancelling partition reassignments, changing a broker's configuration and log levels while it runs, and unregistering a broker that is gone. Each asks for what its kind of change needs — a preview before a configuration change, a reason before a reassignment or an unregistration — and each is recorded in the audit trail. BROKA does not start, stop or restart a broker process.
One thing it does record: reaching the cluster stamps the connection as reachable, with the round trip it took. That is what keeps the health you see on the Connections page current. The other is the audit trail's, in Commercial: with the read tier set to All reads in Settings ▸ Security, the topic listing behind the overview's figures is recorded as a read. Those two are the only lasting effects of looking.