

Diagnostics
Updated 29 September 2026 · applies to 1.0.0 · Commercial
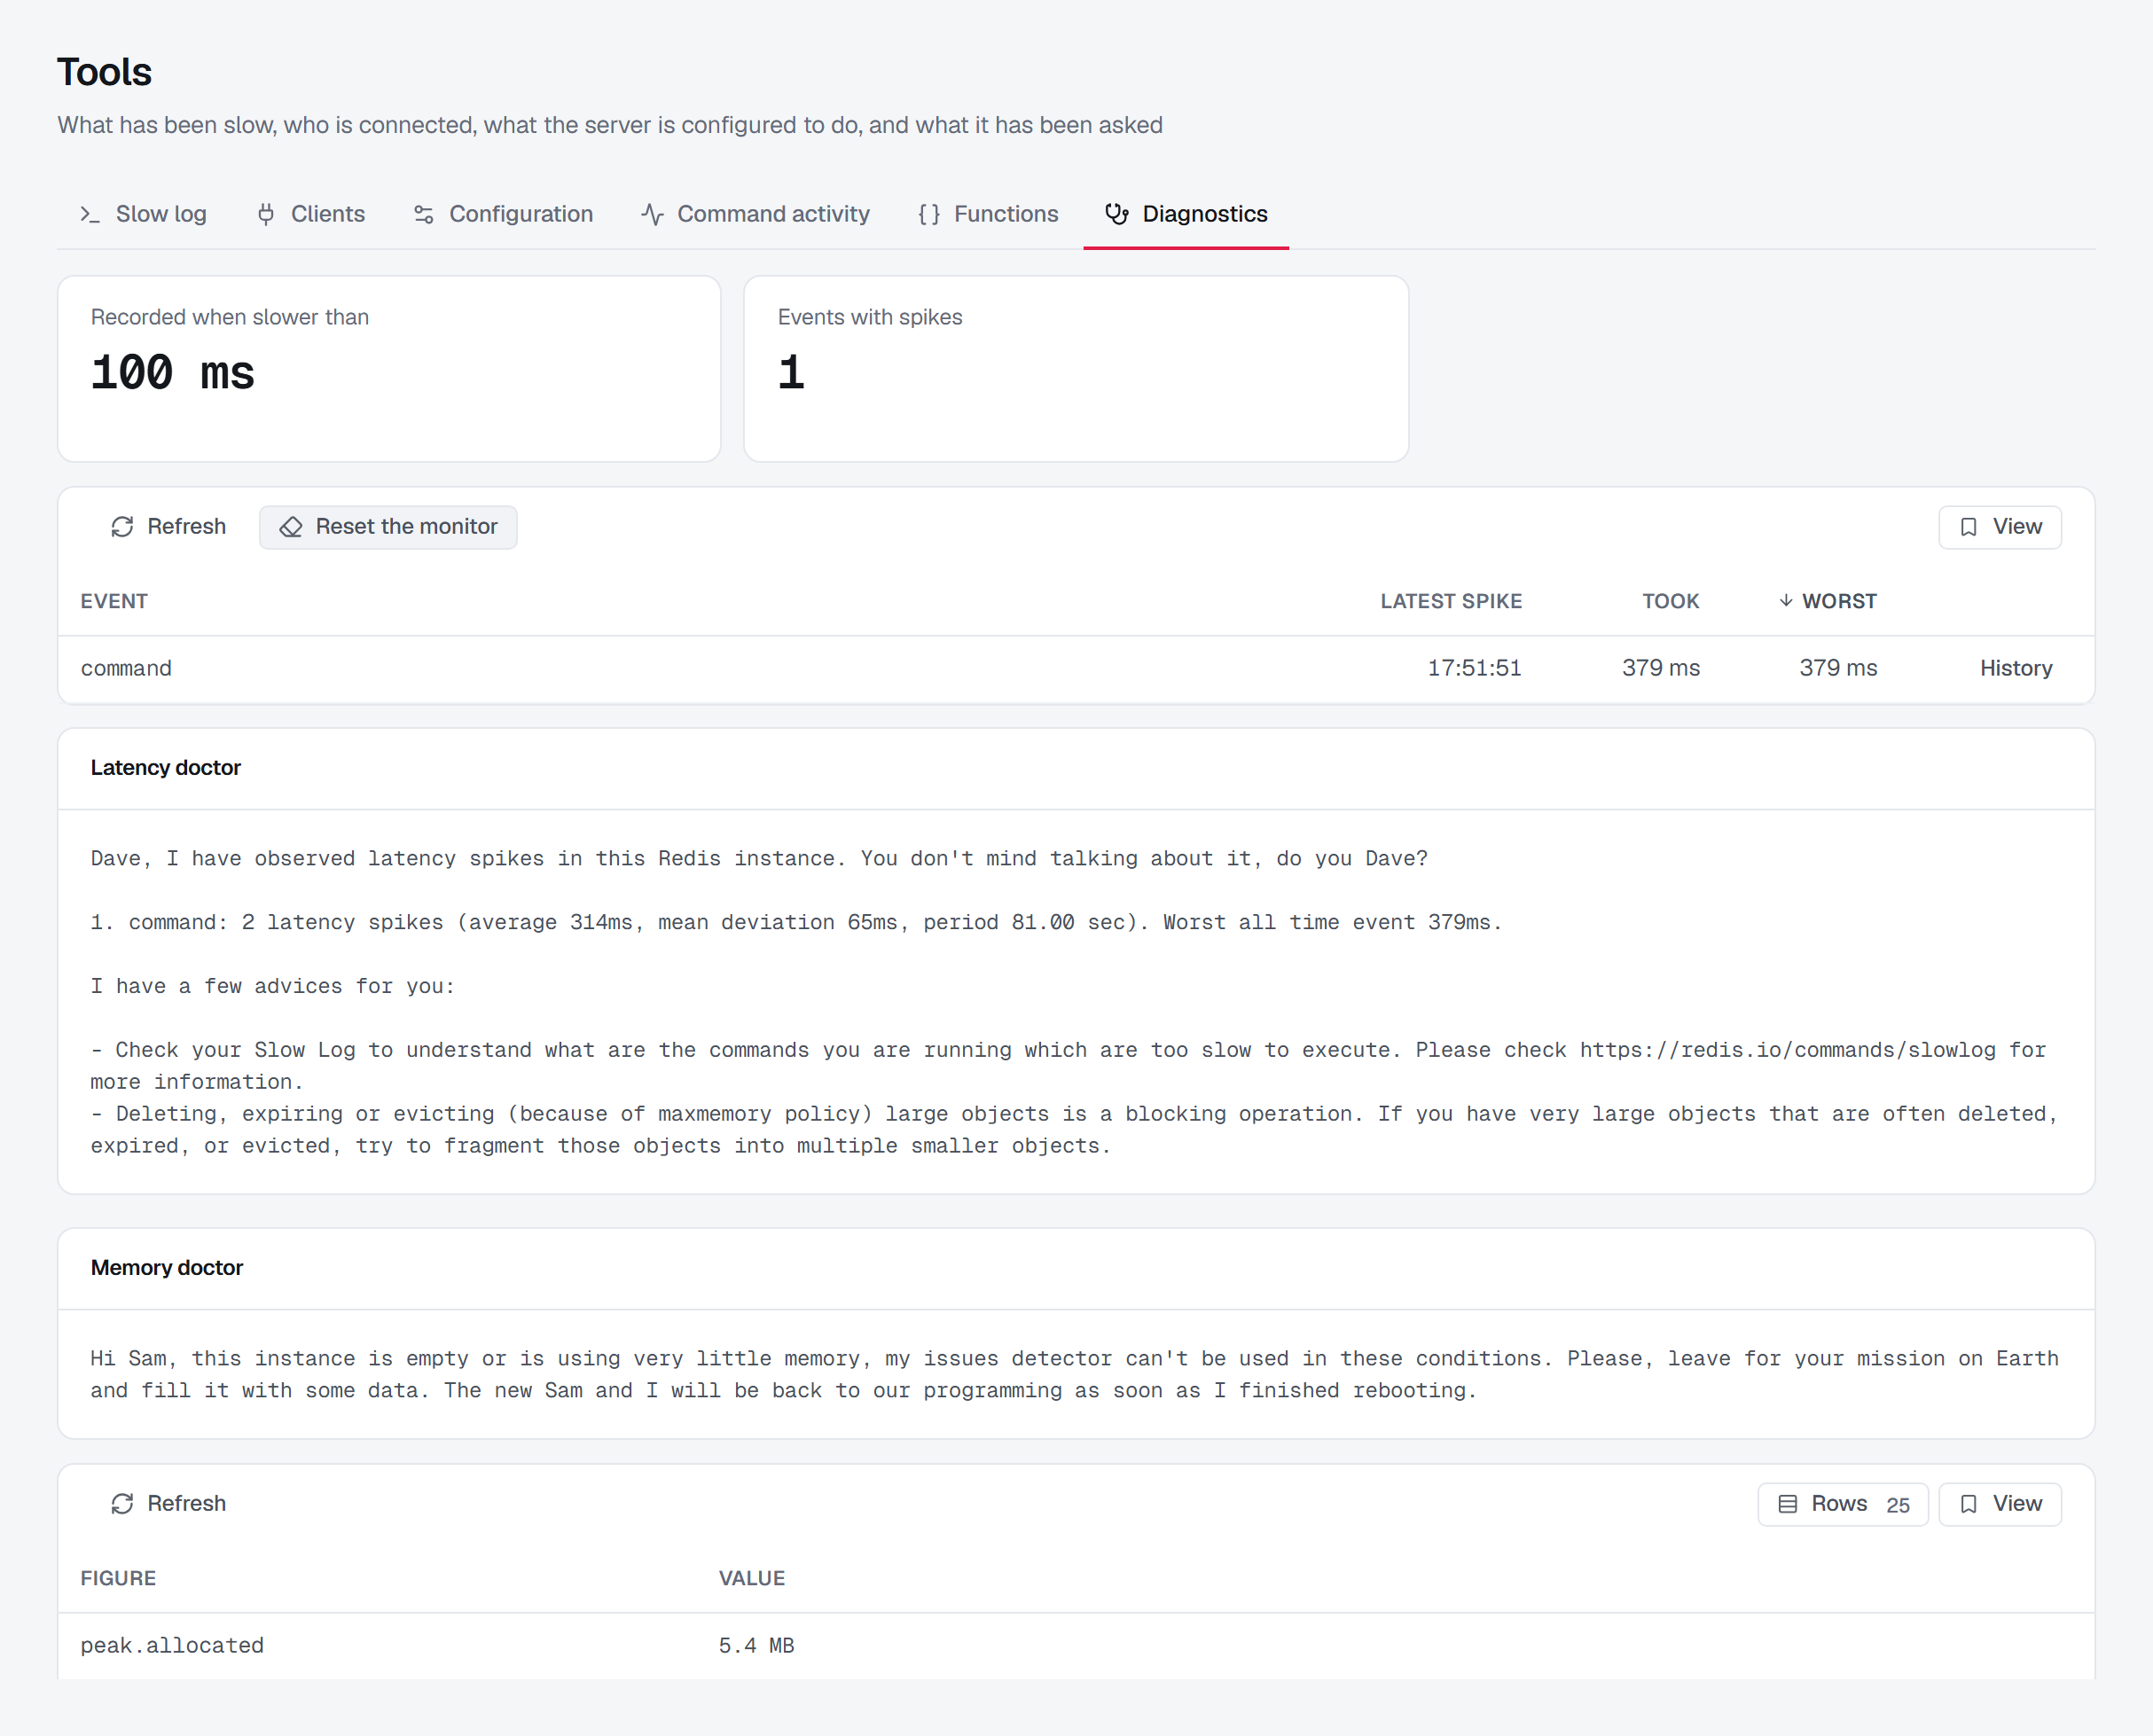
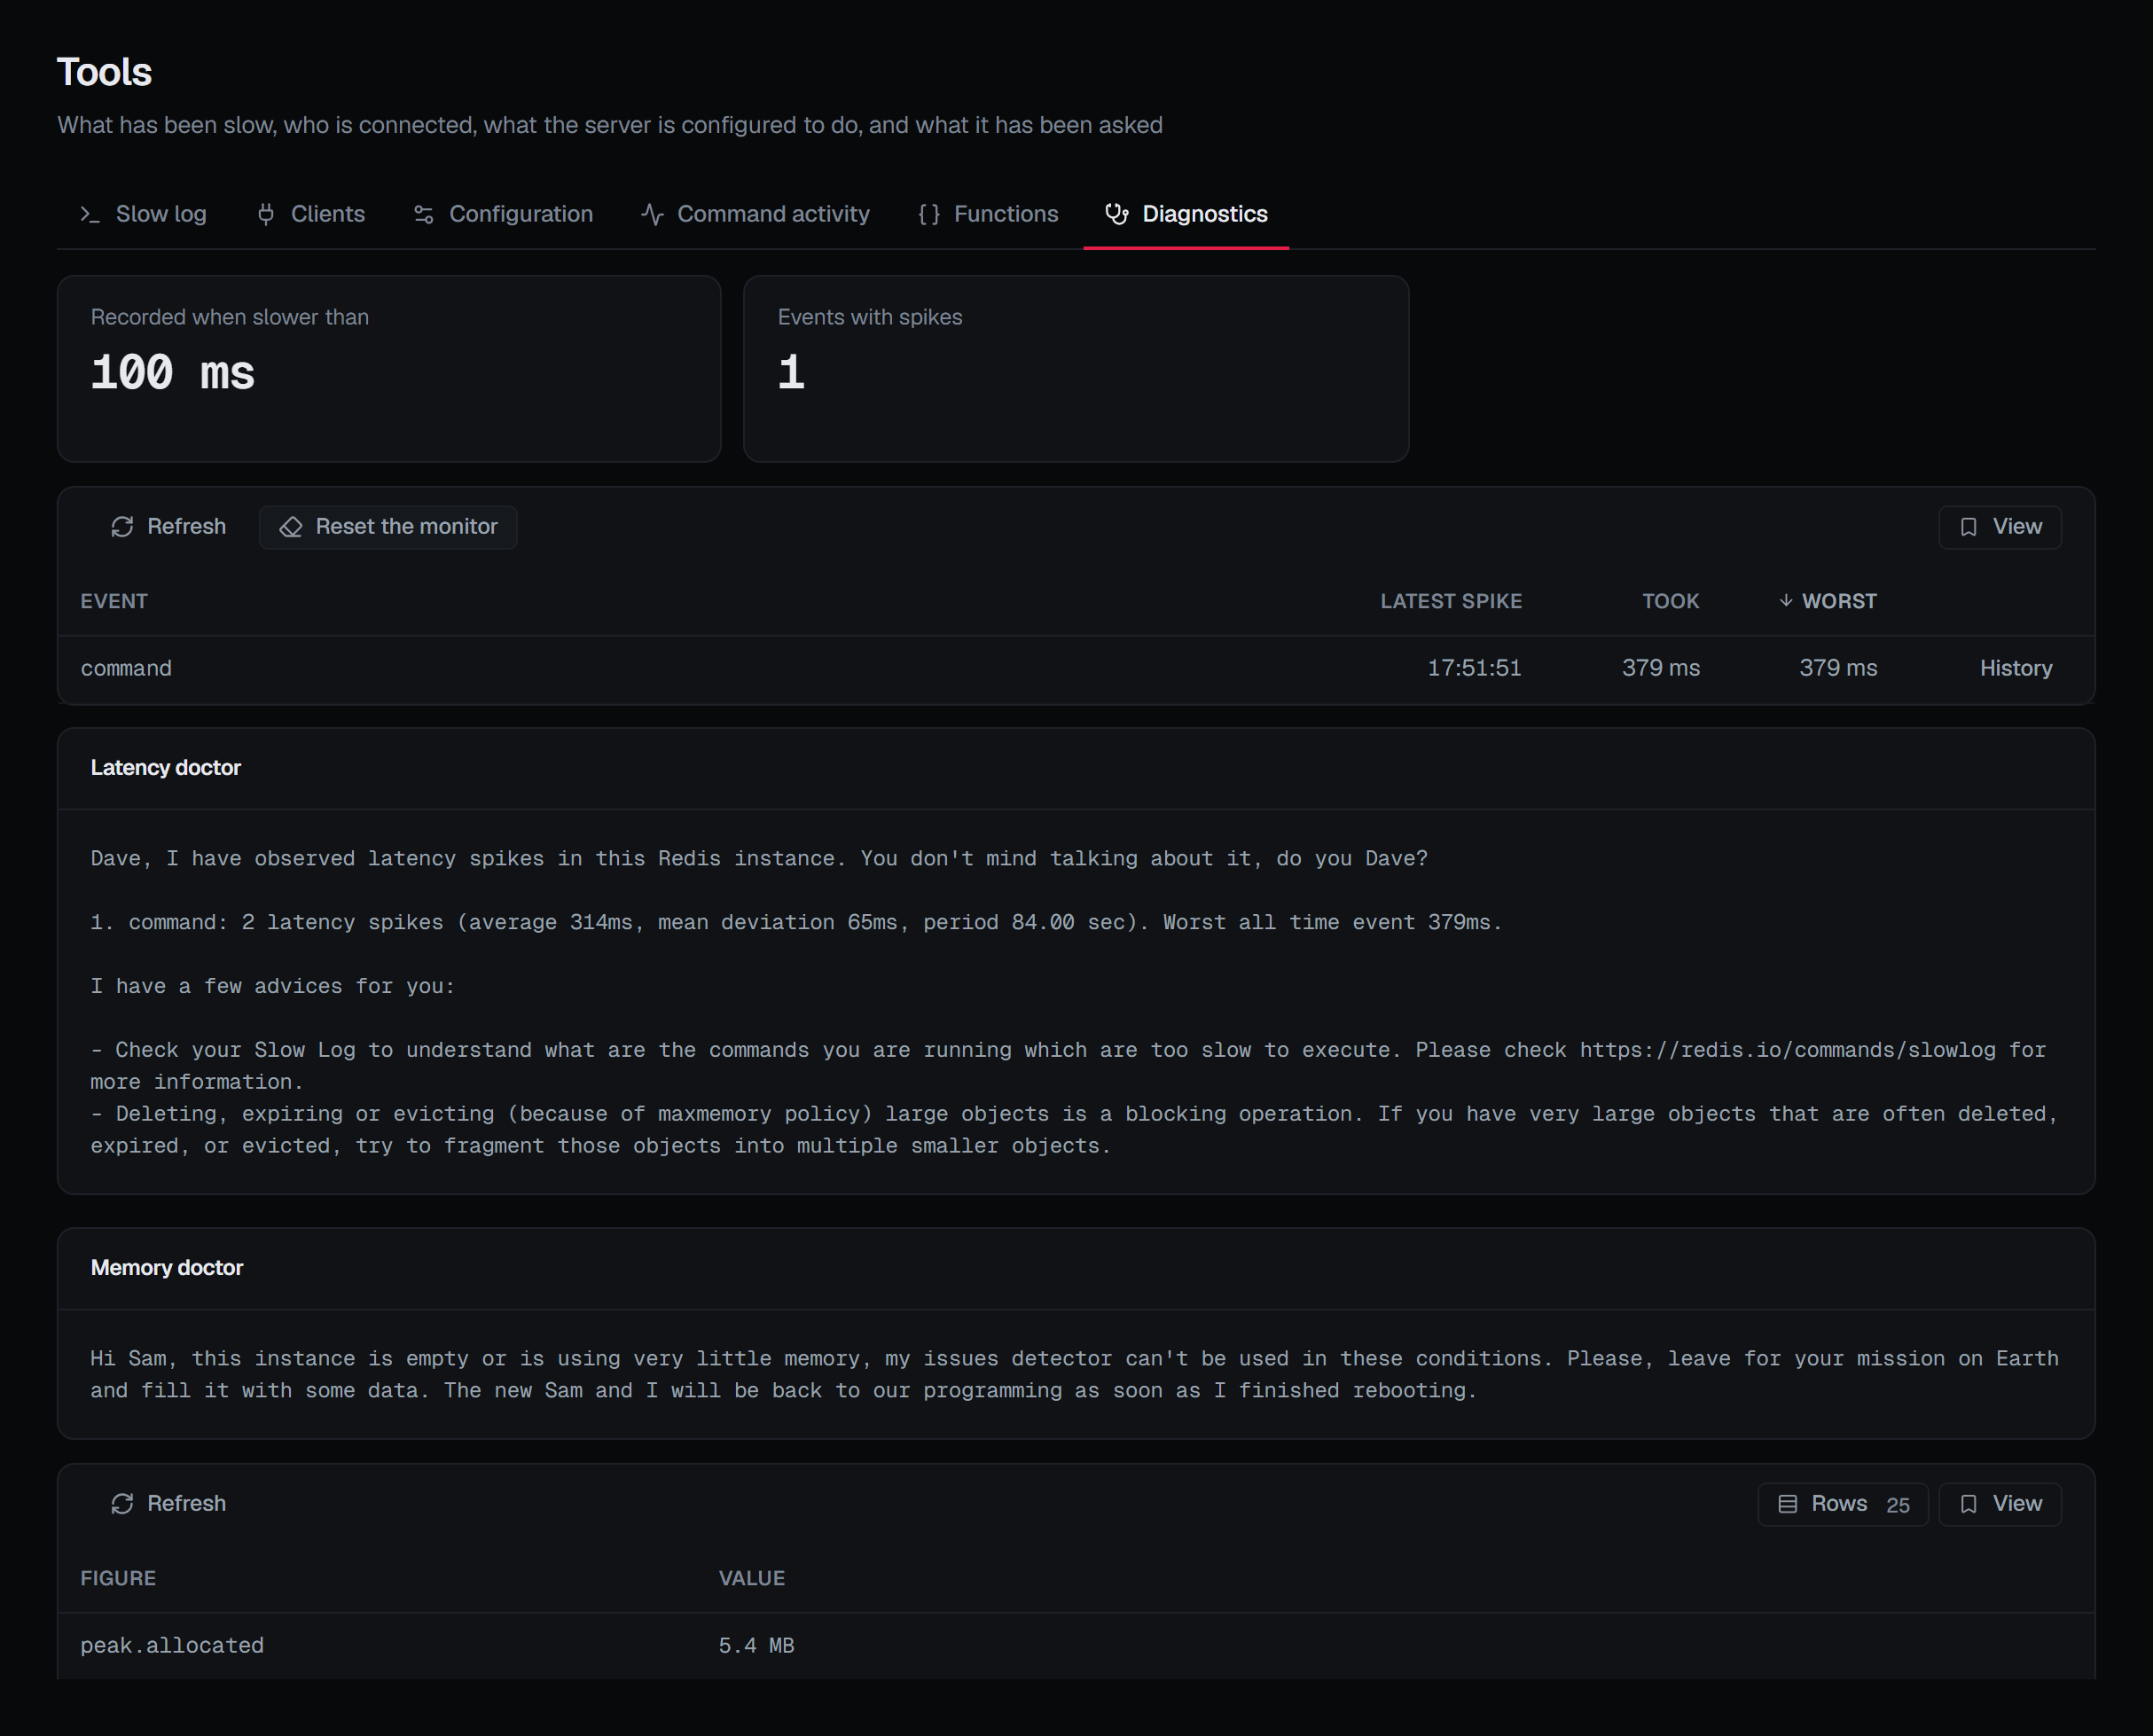
The Diagnostics tab under Redis ▸ Tools shows the server's own diagnosis: its latency monitor, with each event's spikes, and its memory report. Both are read as Redis writes them, so what you see is the server's names and prose rather than BROKA's summary of them. The tab sits beside the slow log on Tools, and like the rest of that page it is there only when the connection's Redis user may run the operational commands.
The latency monitor
Redis's latency monitor records every event that took longer than a threshold. Two figures open the section, and the threshold comes first:
- Recorded when slower than — the threshold, in milliseconds. Like the slow log, an empty list means
nothing without it. It reads never when the threshold is 0, and — when the server would not say: the
threshold is read with
CONFIG GET, and a Redis user allowed the latency commands but refusedCONFIGstill gets the events, with the threshold unknown rather than off. - Events with spikes — how many events have anything recorded.
At 0 the monitor is off, and the screen says so in a warning above the list: nothing is being recorded, and
an empty list then says nothing about how fast the server is. The empty list itself reads Recording is off
rather than No latency spike recorded. The threshold is the runtime parameter
latency-monitor-threshold, so it can be set on the Configuration tab.
Each event is listed with its Latest spike — the time of day it happened — how long that spike took (Took), and the Worst it has been, both in milliseconds. The list is sorted worst first.
History, on an event's row, opens the spikes the server kept for that event below the list: when each happened and how long it took, newest first. Redis keeps the last 160 of each event.
Below the list, the Latency doctor is Redis's own reading of what it recorded, in its own words.
Resetting the monitor
Reset the monitor discards every event's recorded spikes. The confirmation, Reset the latency monitor?, says Redis keeps no copy and that the audit entry of the reset will be the only record there were any, and it asks for a reason. The result says how many events' spikes were discarded, and the audit entry records that count.
It needs write permission on the connection, and it is not offered in a read-only environment or on a
connection frozen with its own read-only switch. It is refused on a Redis Cluster: every node keeps its own
monitor, and BROKA would reset only one node's. The refusal says so, and says to run LATENCY RESET on each
node instead.
The memory report
The Memory doctor — Redis's own assessment of its memory, as it wrote it — sits above every figure
MEMORY STATS reports, listed under the server's own names and in its order, so related figures stay
together. A figure the server reports per database is flattened into a dotted name under it, such as
db.0.overhead.hashtable.main. The table pages 25 at a time.
How a figure reads depends on what it is:
- Sizes read in their unit — B, KB, MB, GB — with the exact byte count on hover. A negative size, as
rss-overhead.bytescan be, keeps its sign. - Counts, percentages and ratios read exactly as the server wrote them.
fragmentationis a ratio, although its name does not say so.
For what the headline memory figures mean — used, peak, resident and the limit — see Memory.
What each half needs from the server
The two halves are separate reads, because the server grants them separately. The LATENCY commands are in
Redis's @admin and @dangerous categories; MEMORY STATS and MEMORY DOCTOR are in neither. If one half
cannot be read, it says why, naming the command, and the other half is unaffected. A refused latency read says,
for example: This Redis user may not run LATENCY LATEST. The LATENCY commands are @admin and @dangerous, so a
least-privilege connection is refused them — grant them on the Redis side.
Reading either half needs only permission to view the connection. Refresh, on each half's toolbar, reads that half again.
When something looks wrong
- The latency list is empty. Look at Recorded when slower than: never means the monitor is off; any other value means nothing has taken longer than it since the server started or the monitor was reset.
- The threshold reads —. The Redis user may run the latency commands but not
CONFIG; the events are still real. - An event's History is empty. The server holds no spikes for that event any more.
- Reset the monitor is refused. The connection is a Redis Cluster; run
LATENCY RESETon each node. - One half shows an error naming a command. The connection's Redis user lacks that command; grant it on the Redis side.