

Tools
Updated 3 October 2026 · applies to 1.0.0 · Commercial
Tools, under Redis in the sidebar, shows what a Redis server found slow, who is connected, what it has been asked to do and which functions it holds. Its six tabs are Slow log, Clients, Configuration, Command activity, Functions and Diagnostics; two of them have pages of their own — Configuration, for reading and changing the running configuration, and Diagnostics, for the server's own report on its latency and its memory.
Slow log
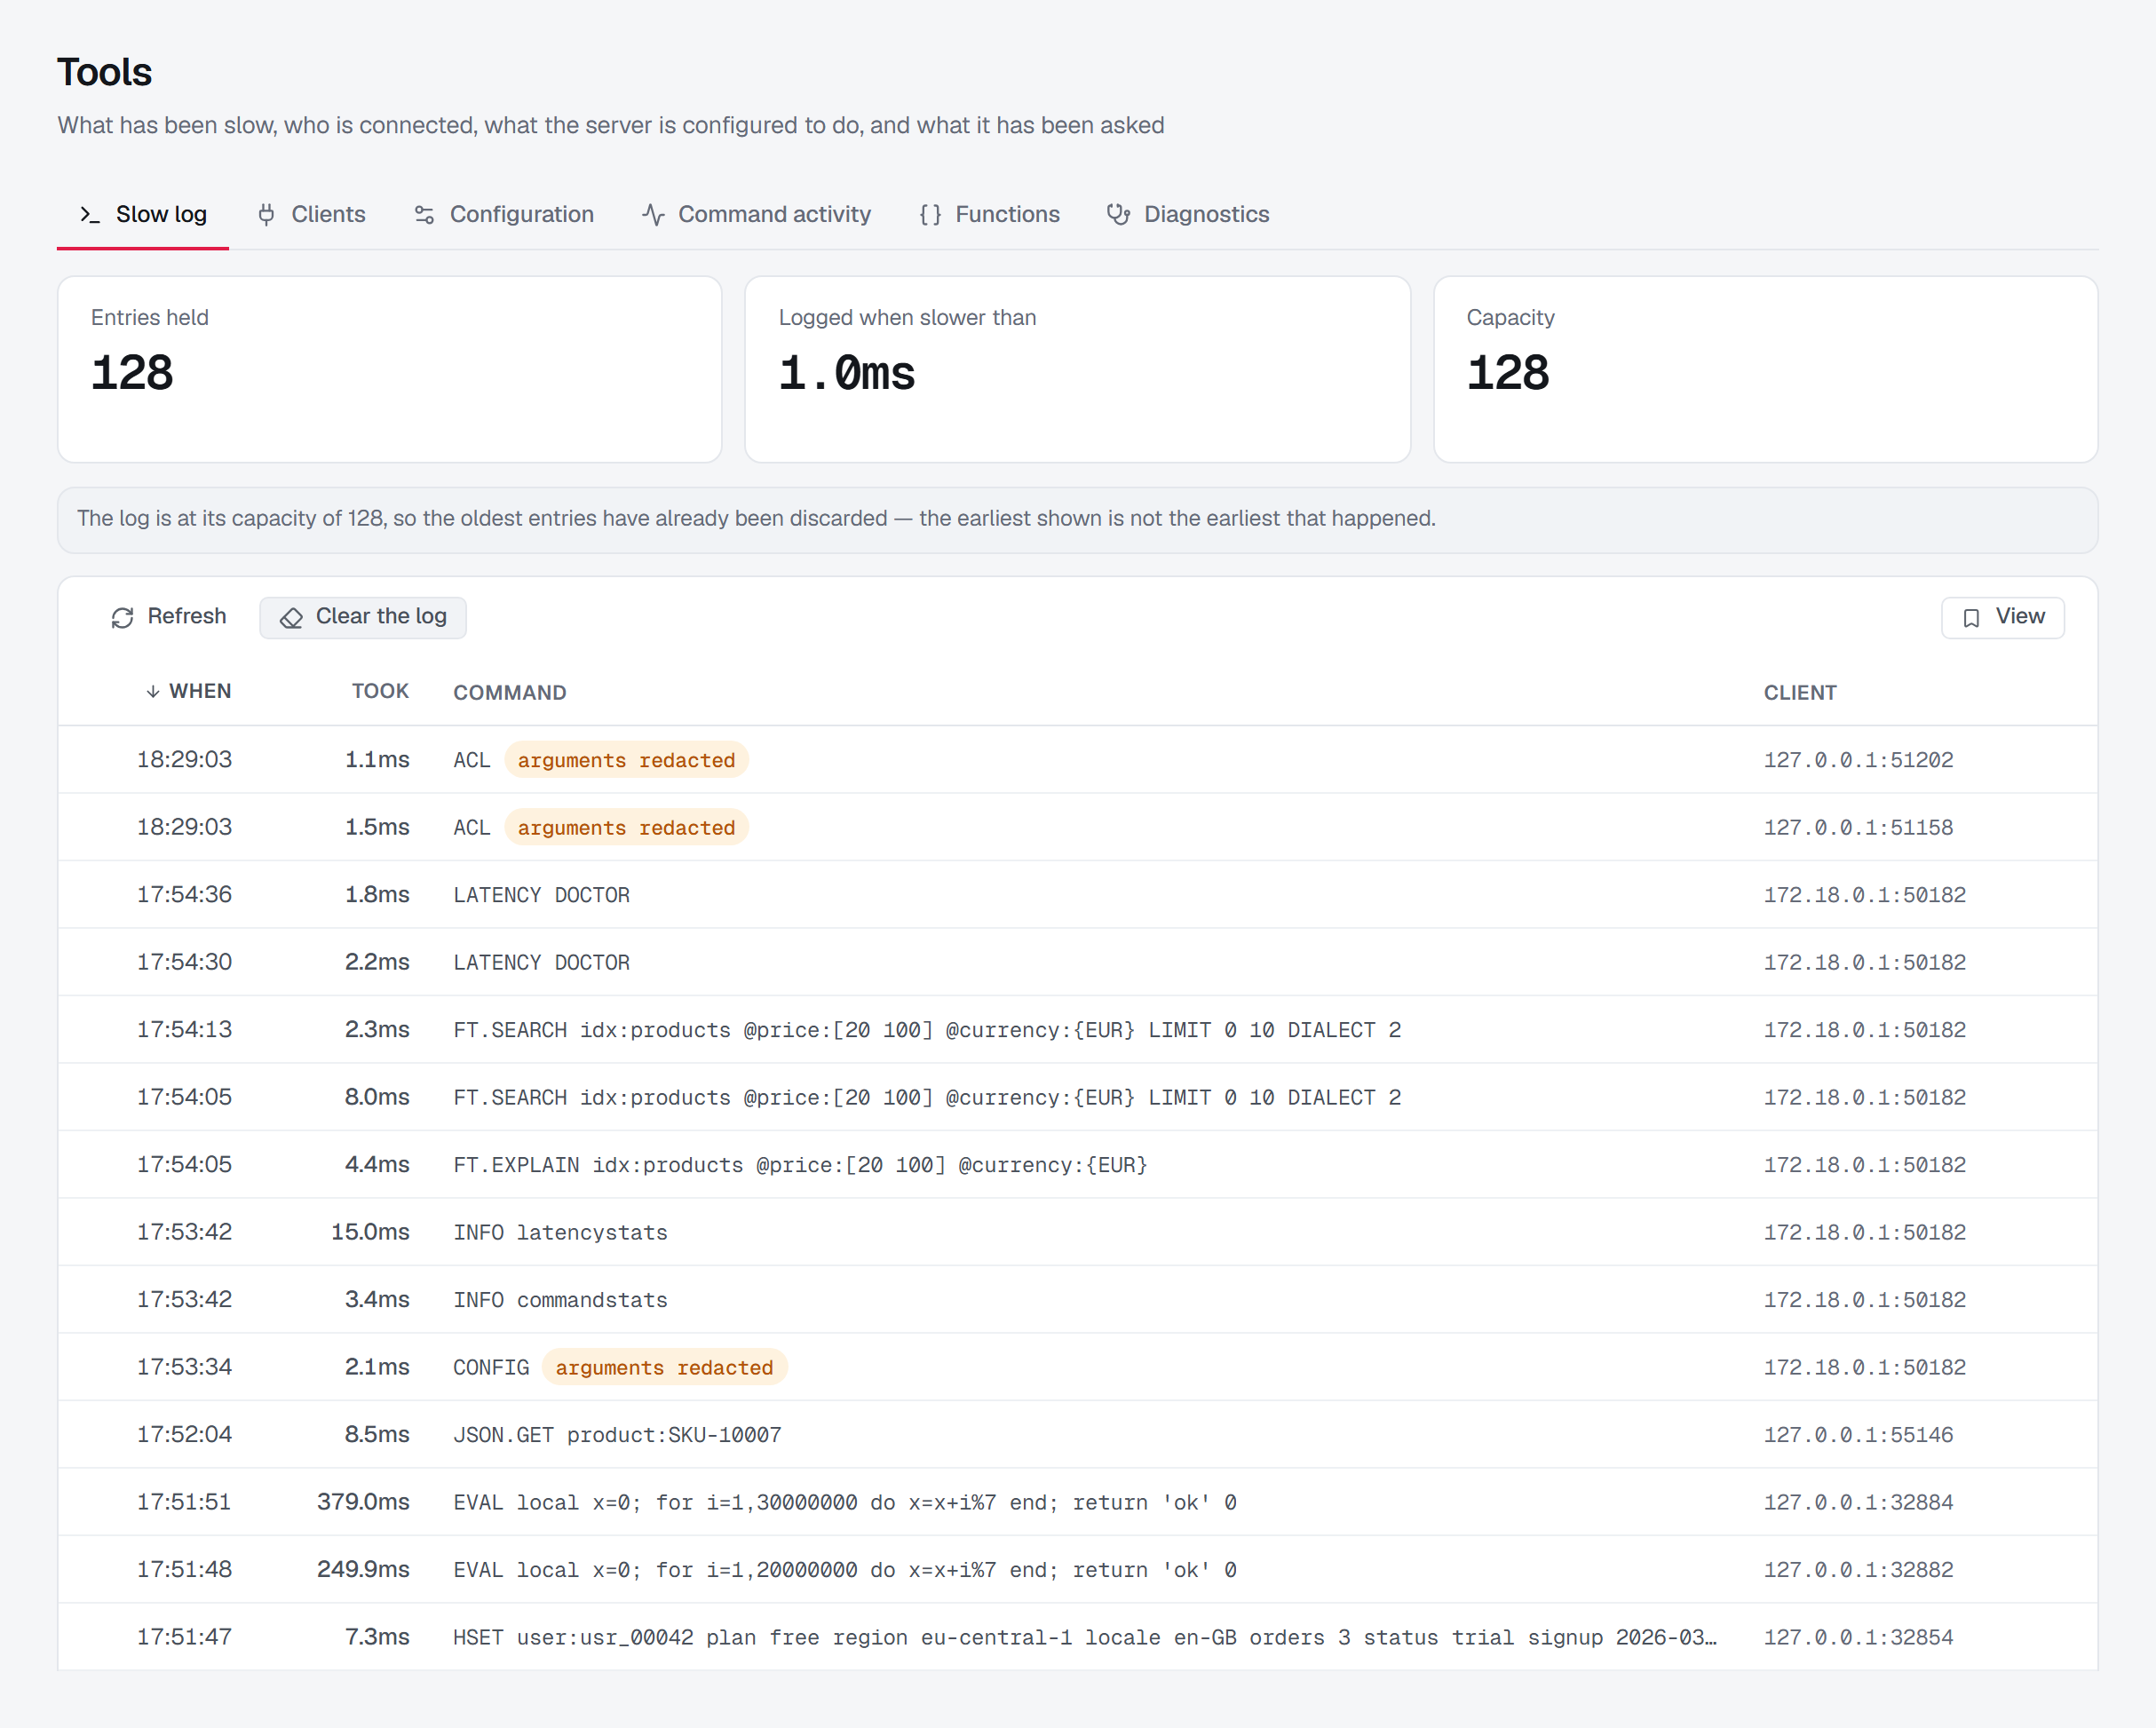
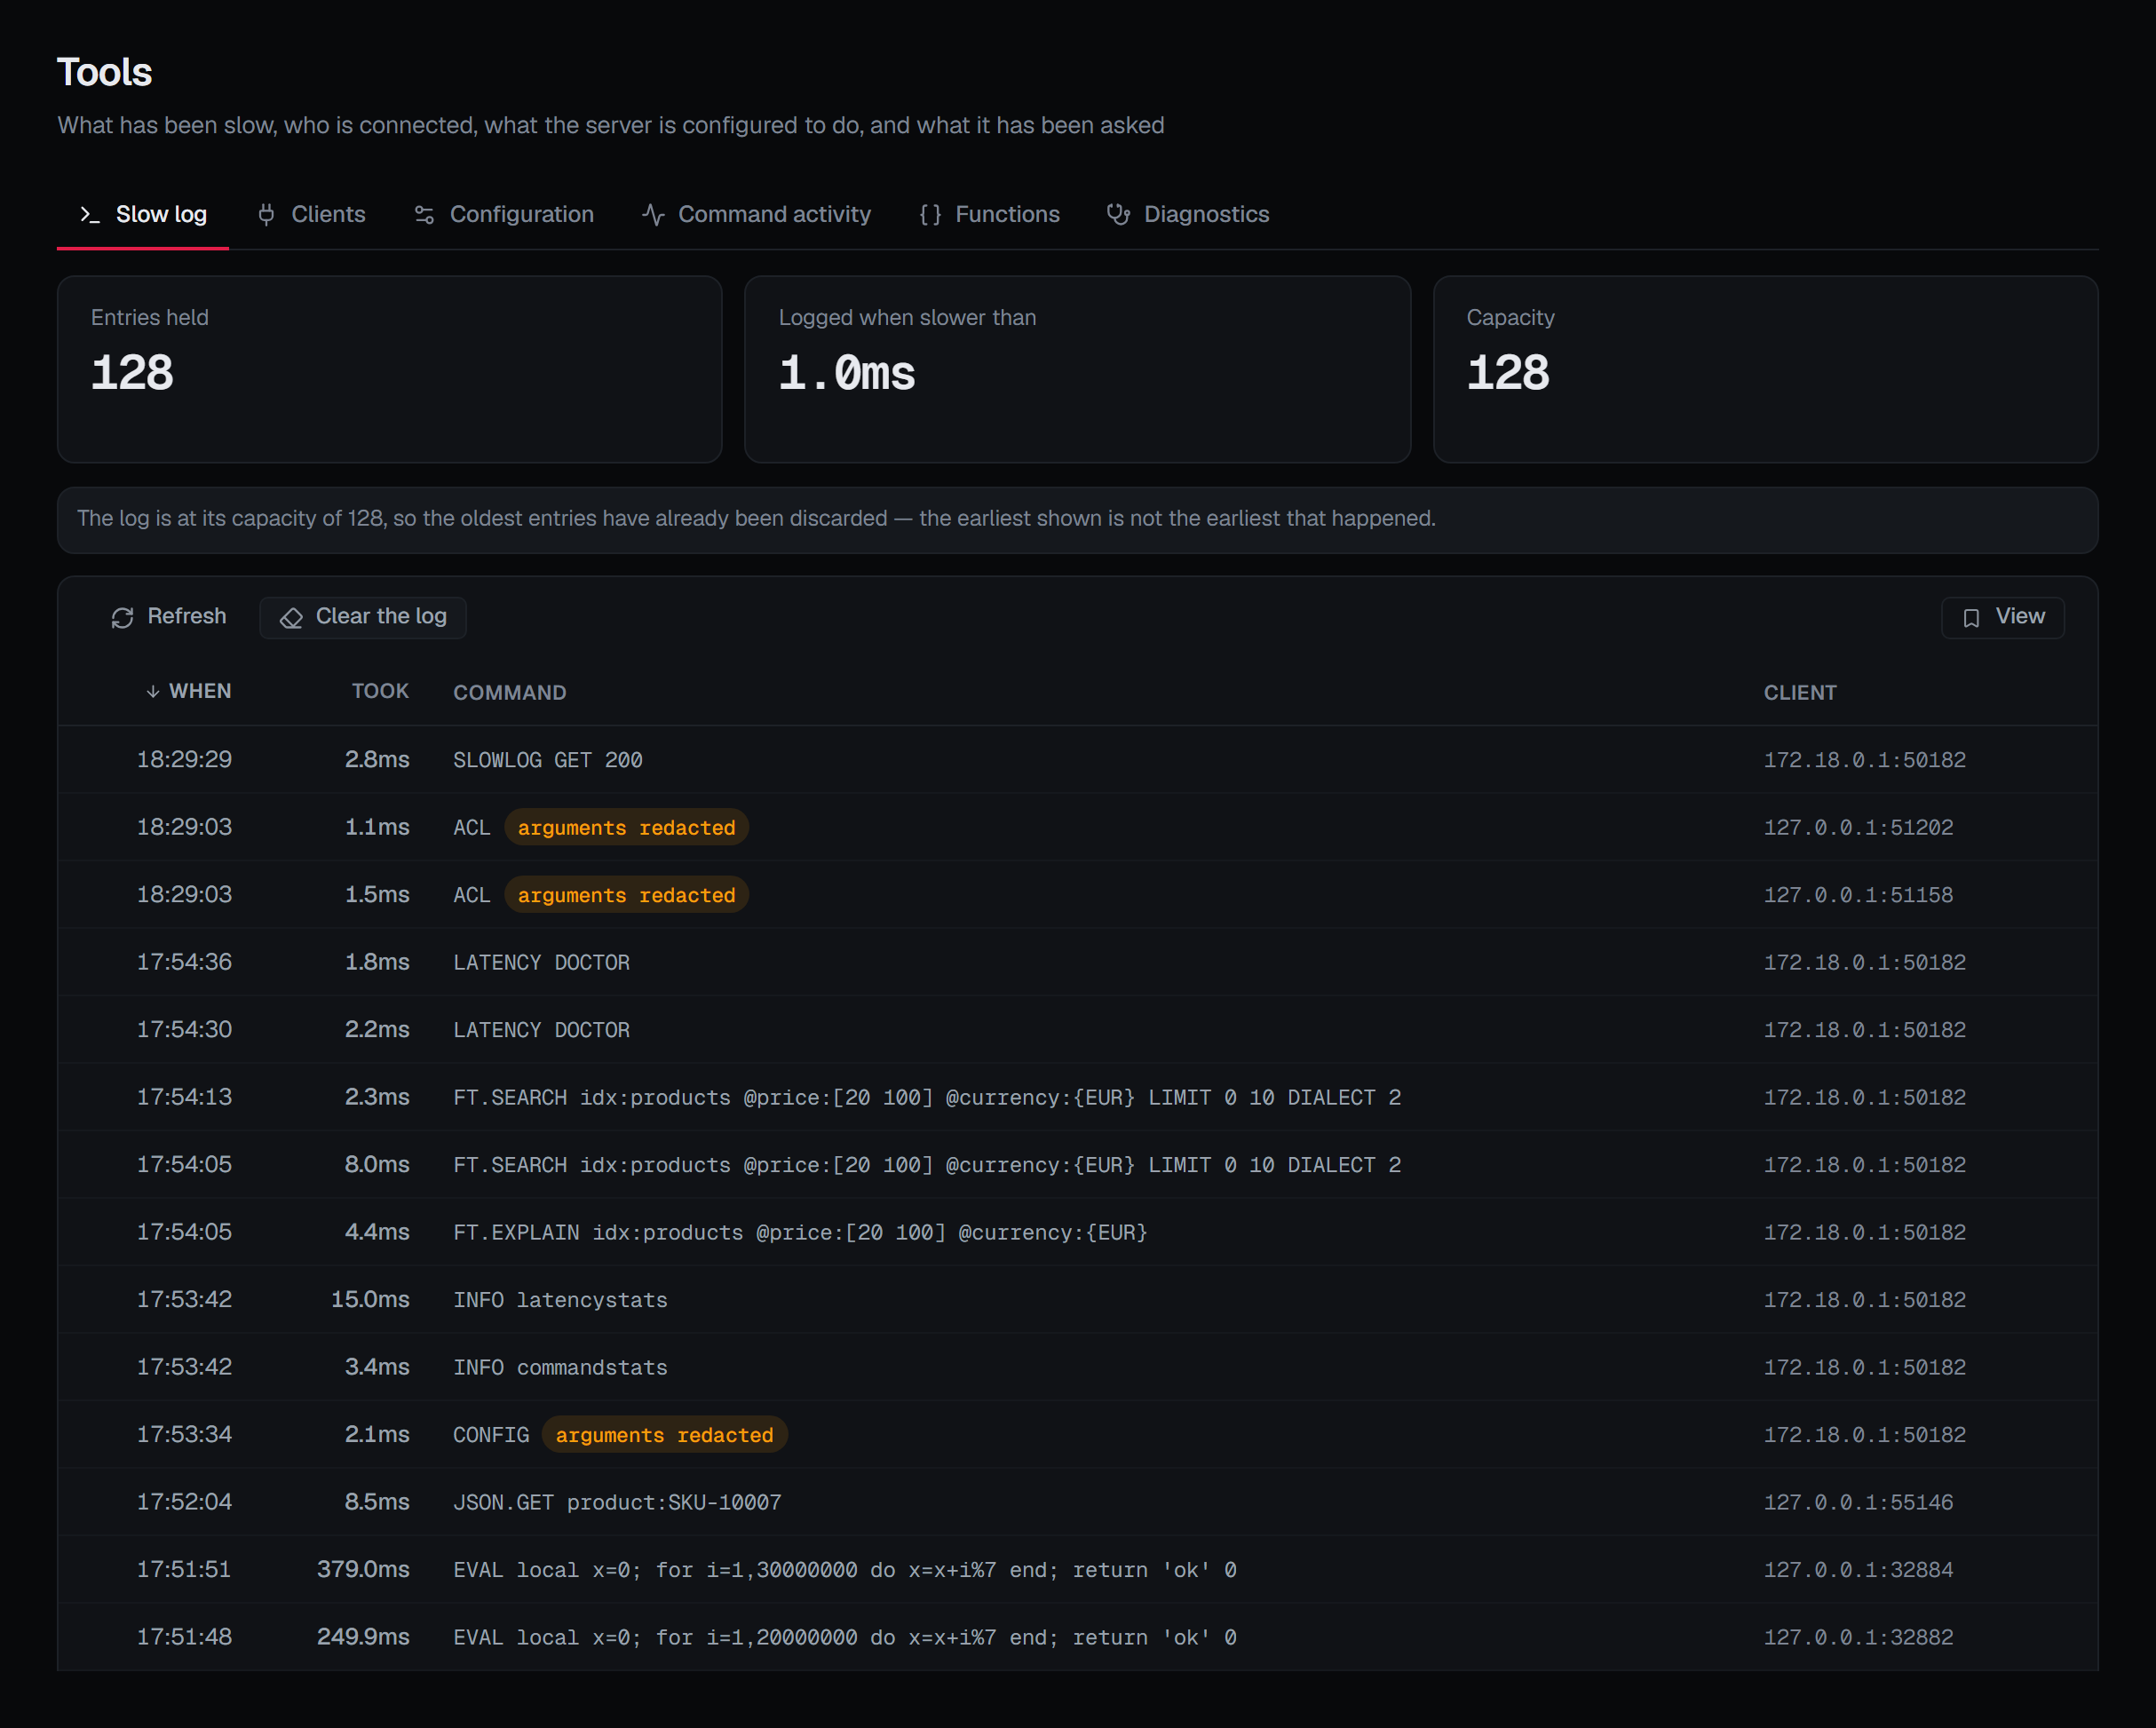
The commands Redis itself recorded as slow, with the threshold that decided that and the capacity of the buffer shown beside them. A count of nine entries means nothing without knowing whether the bar is ten milliseconds or one second, so both are on screen.
If recording is switched off — the threshold set to a negative value — the page says so outright rather than presenting an empty log as a quiet server.
Arguments of credential-bearing commands are stripped before they leave the broker, and the entry is badged to say so. Authentication, configuration and ACL commands can carry a secret in their arguments; a slow-log viewer that faithfully reproduced them would be a credential viewer. The command name is always kept, so the entry is still useful.
Every other entry is the command as Redis logged it, arguments and all — a slow write carries the value
it wrote. So the slow log is read only when you ask: opening Tools reads nothing, and Read the slow
log reads it. Each read is recorded in the audit trail, counting the entries and never their
arguments. Reading it takes Read message contents (messages.read); without it the page says you
are not permitted instead of the log, and somebody denied reading the connection's messages is shown
the server's refusal. Clear the log asks first, and for a reason, in every environment; it empties what the
page shows without reading it again.
If the connection's Redis user may not run the operational commands at all, the page says so as soon as it opens, from what BROKA already knows about the connection — it does not read the slow log to find out.
Clients
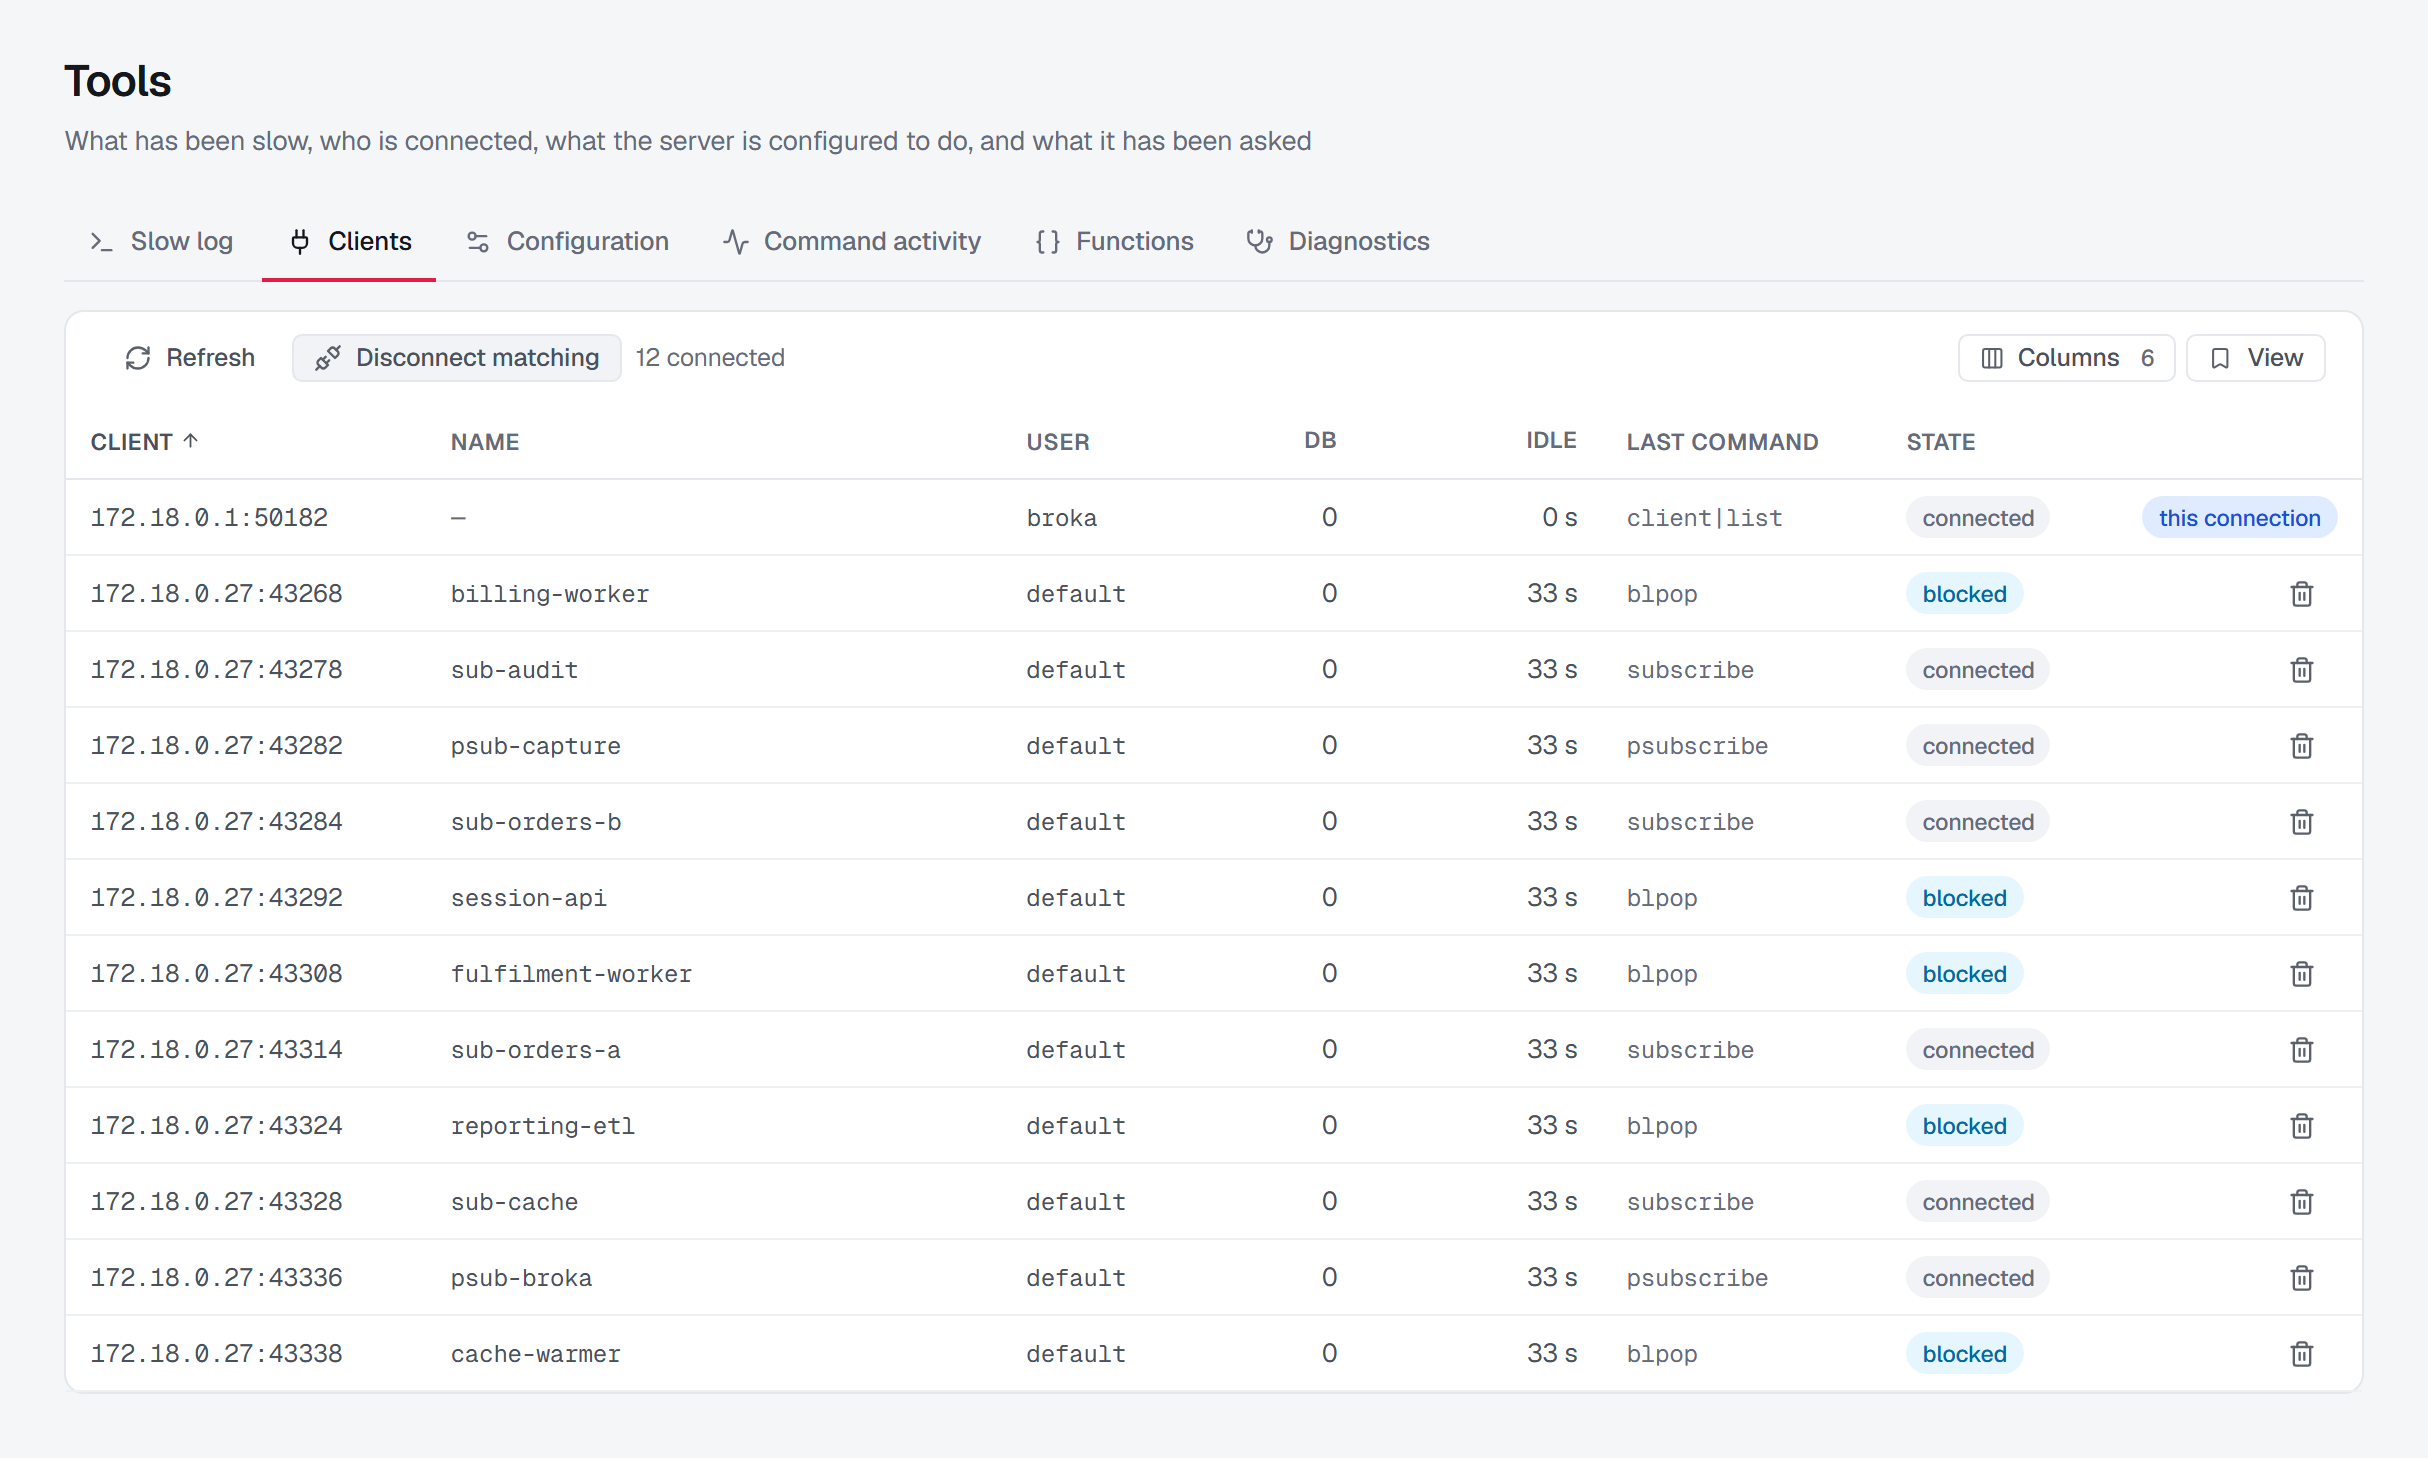
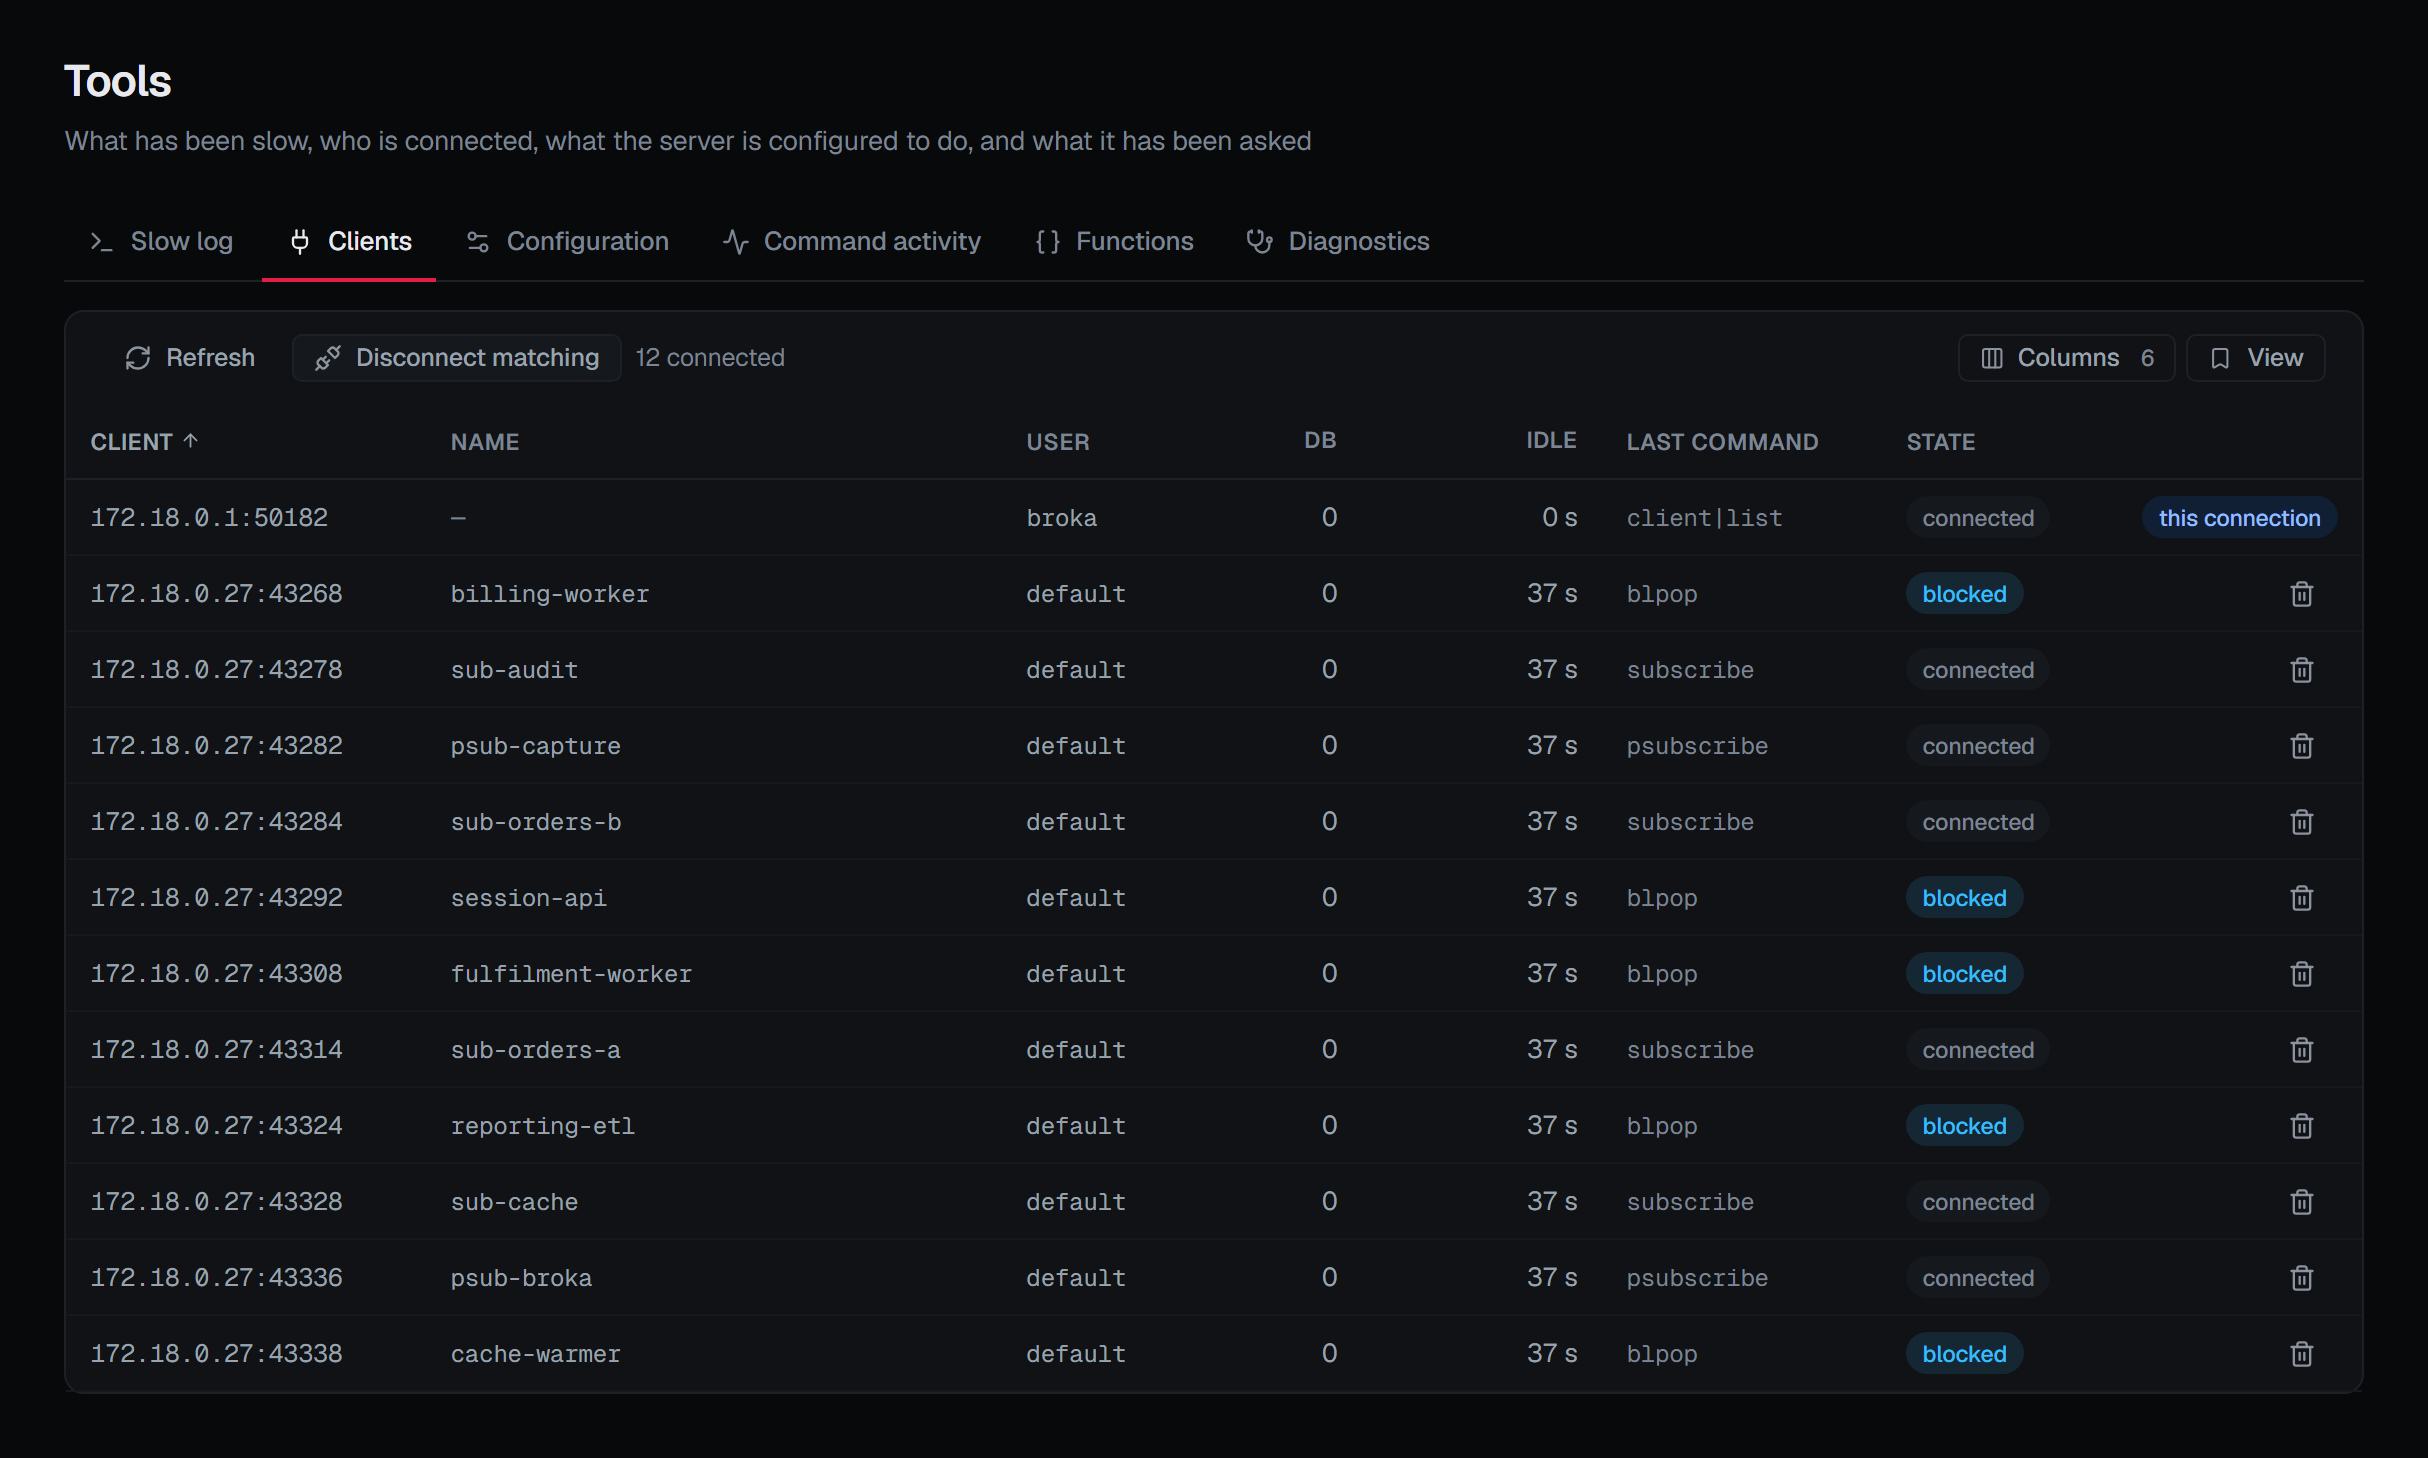
Every connection: where it is from, its name, which user it authenticated as, which database it selected, how long it has been idle, its last command, its state, its output buffer and the client library it is using.
The state column decodes one thing: whether the connection is parked in a blocking command. It matters because it changes how the two columns beside it read — a blocked client's last command is the one it is waiting in rather than the last one it ran, and its idle time is that wait rather than a client doing nothing.
The named ones are the useful ones — a connection that set a client name identifies itself, and the list is where you find out which of your applications is holding fourteen connections.
A client can be disconnected from here, and the console's own row says so rather than offering a button that will not work. When it cannot work out which row is its own it withholds Disconnect from every row and says why — "we could not establish which one is ours" is a different statement from "none of them is". BROKA refuses to kill its own connection to the server, because doing so would take down the screen making the request.
Disconnecting a client that had already gone is reported as that, not as an error. Each disconnect asks first, and for a reason, in every environment.
Disconnect matching, beside Refresh, disconnects many clients at once: every client authenticated as a given user, of a given type, connected longer than a number of seconds, or any combination — a client must match everything you fill in. Before you confirm, the dialog states the selection in one sentence — this disconnects every client authenticated as reporting and connected longer than 3600s — and it asks for a reason. The connection BROKA sends the command on is never among the clients it disconnects. The audit entry records what the selection was made by, not the user named in it, and the result says how many clients went — or that nothing matched.
Clearing the slow log, disconnecting and Disconnect matching appear only where you may write to the connection; a read-only environment or a connection frozen with its own read-only switch refuses them.
Configuration
The running configuration — reading it, changing a parameter on every node, rewriting the config file and resetting the statistics — is on its own page: Configuration.
Command activity
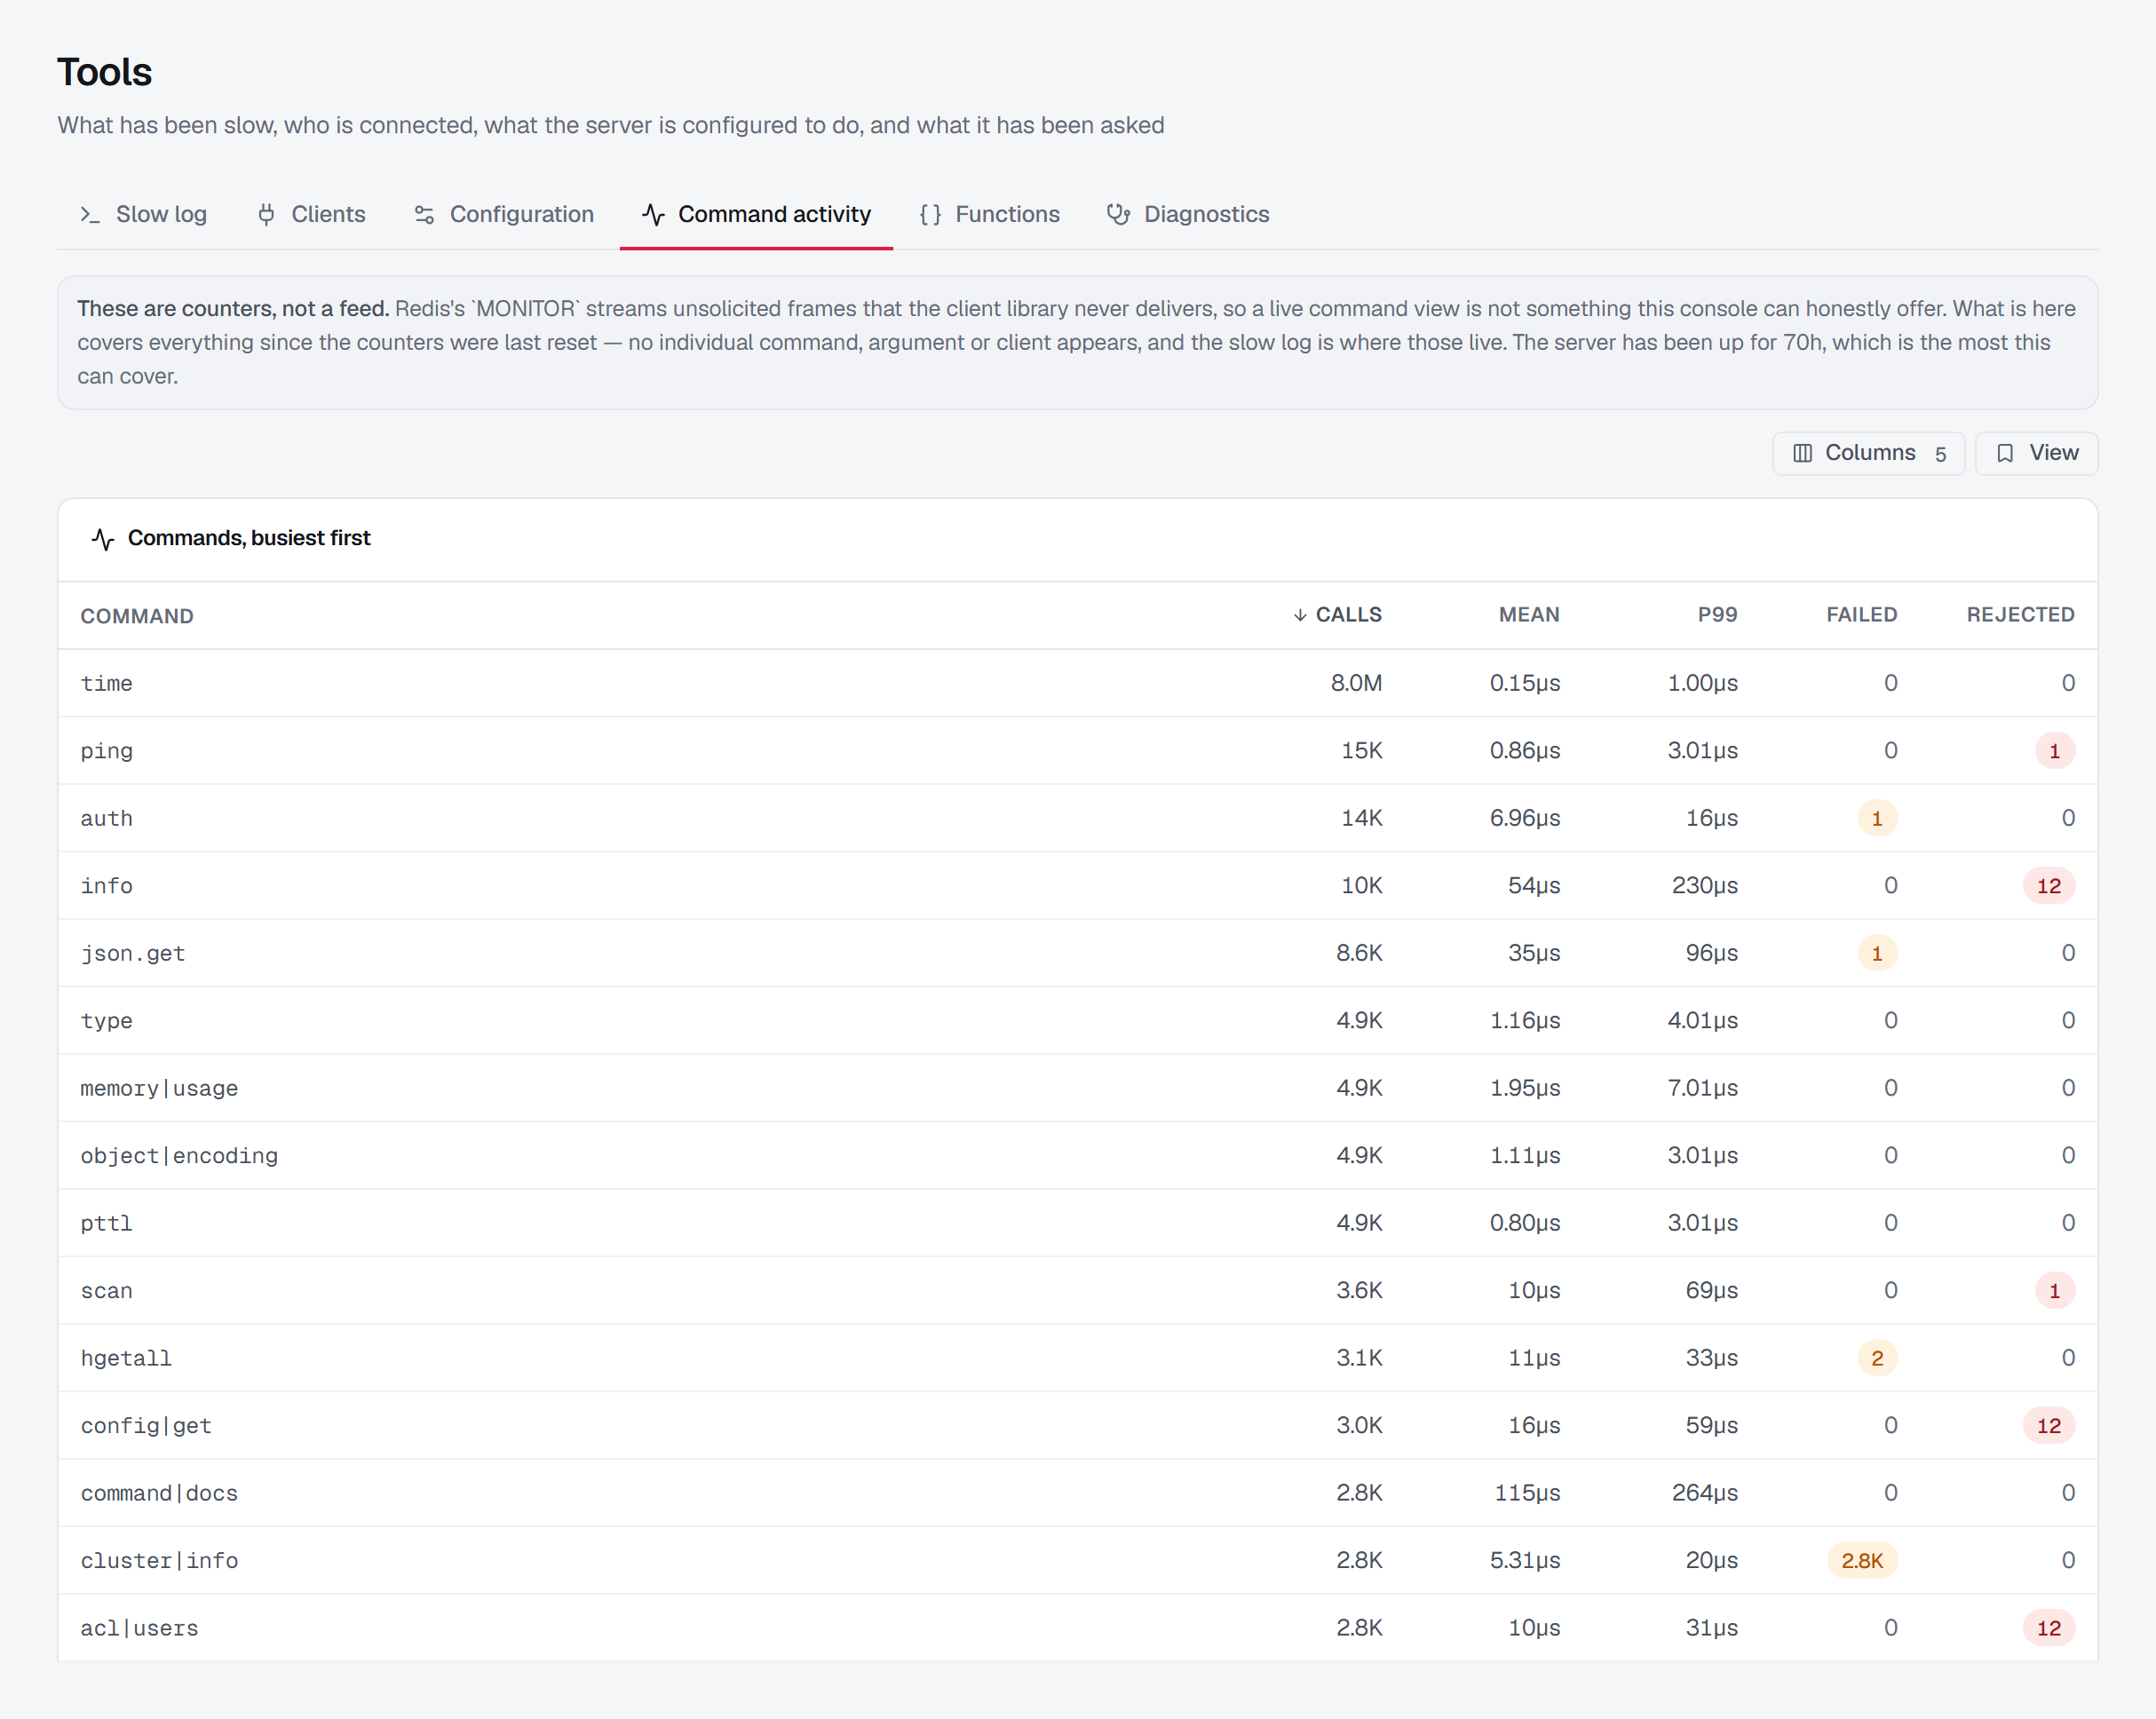
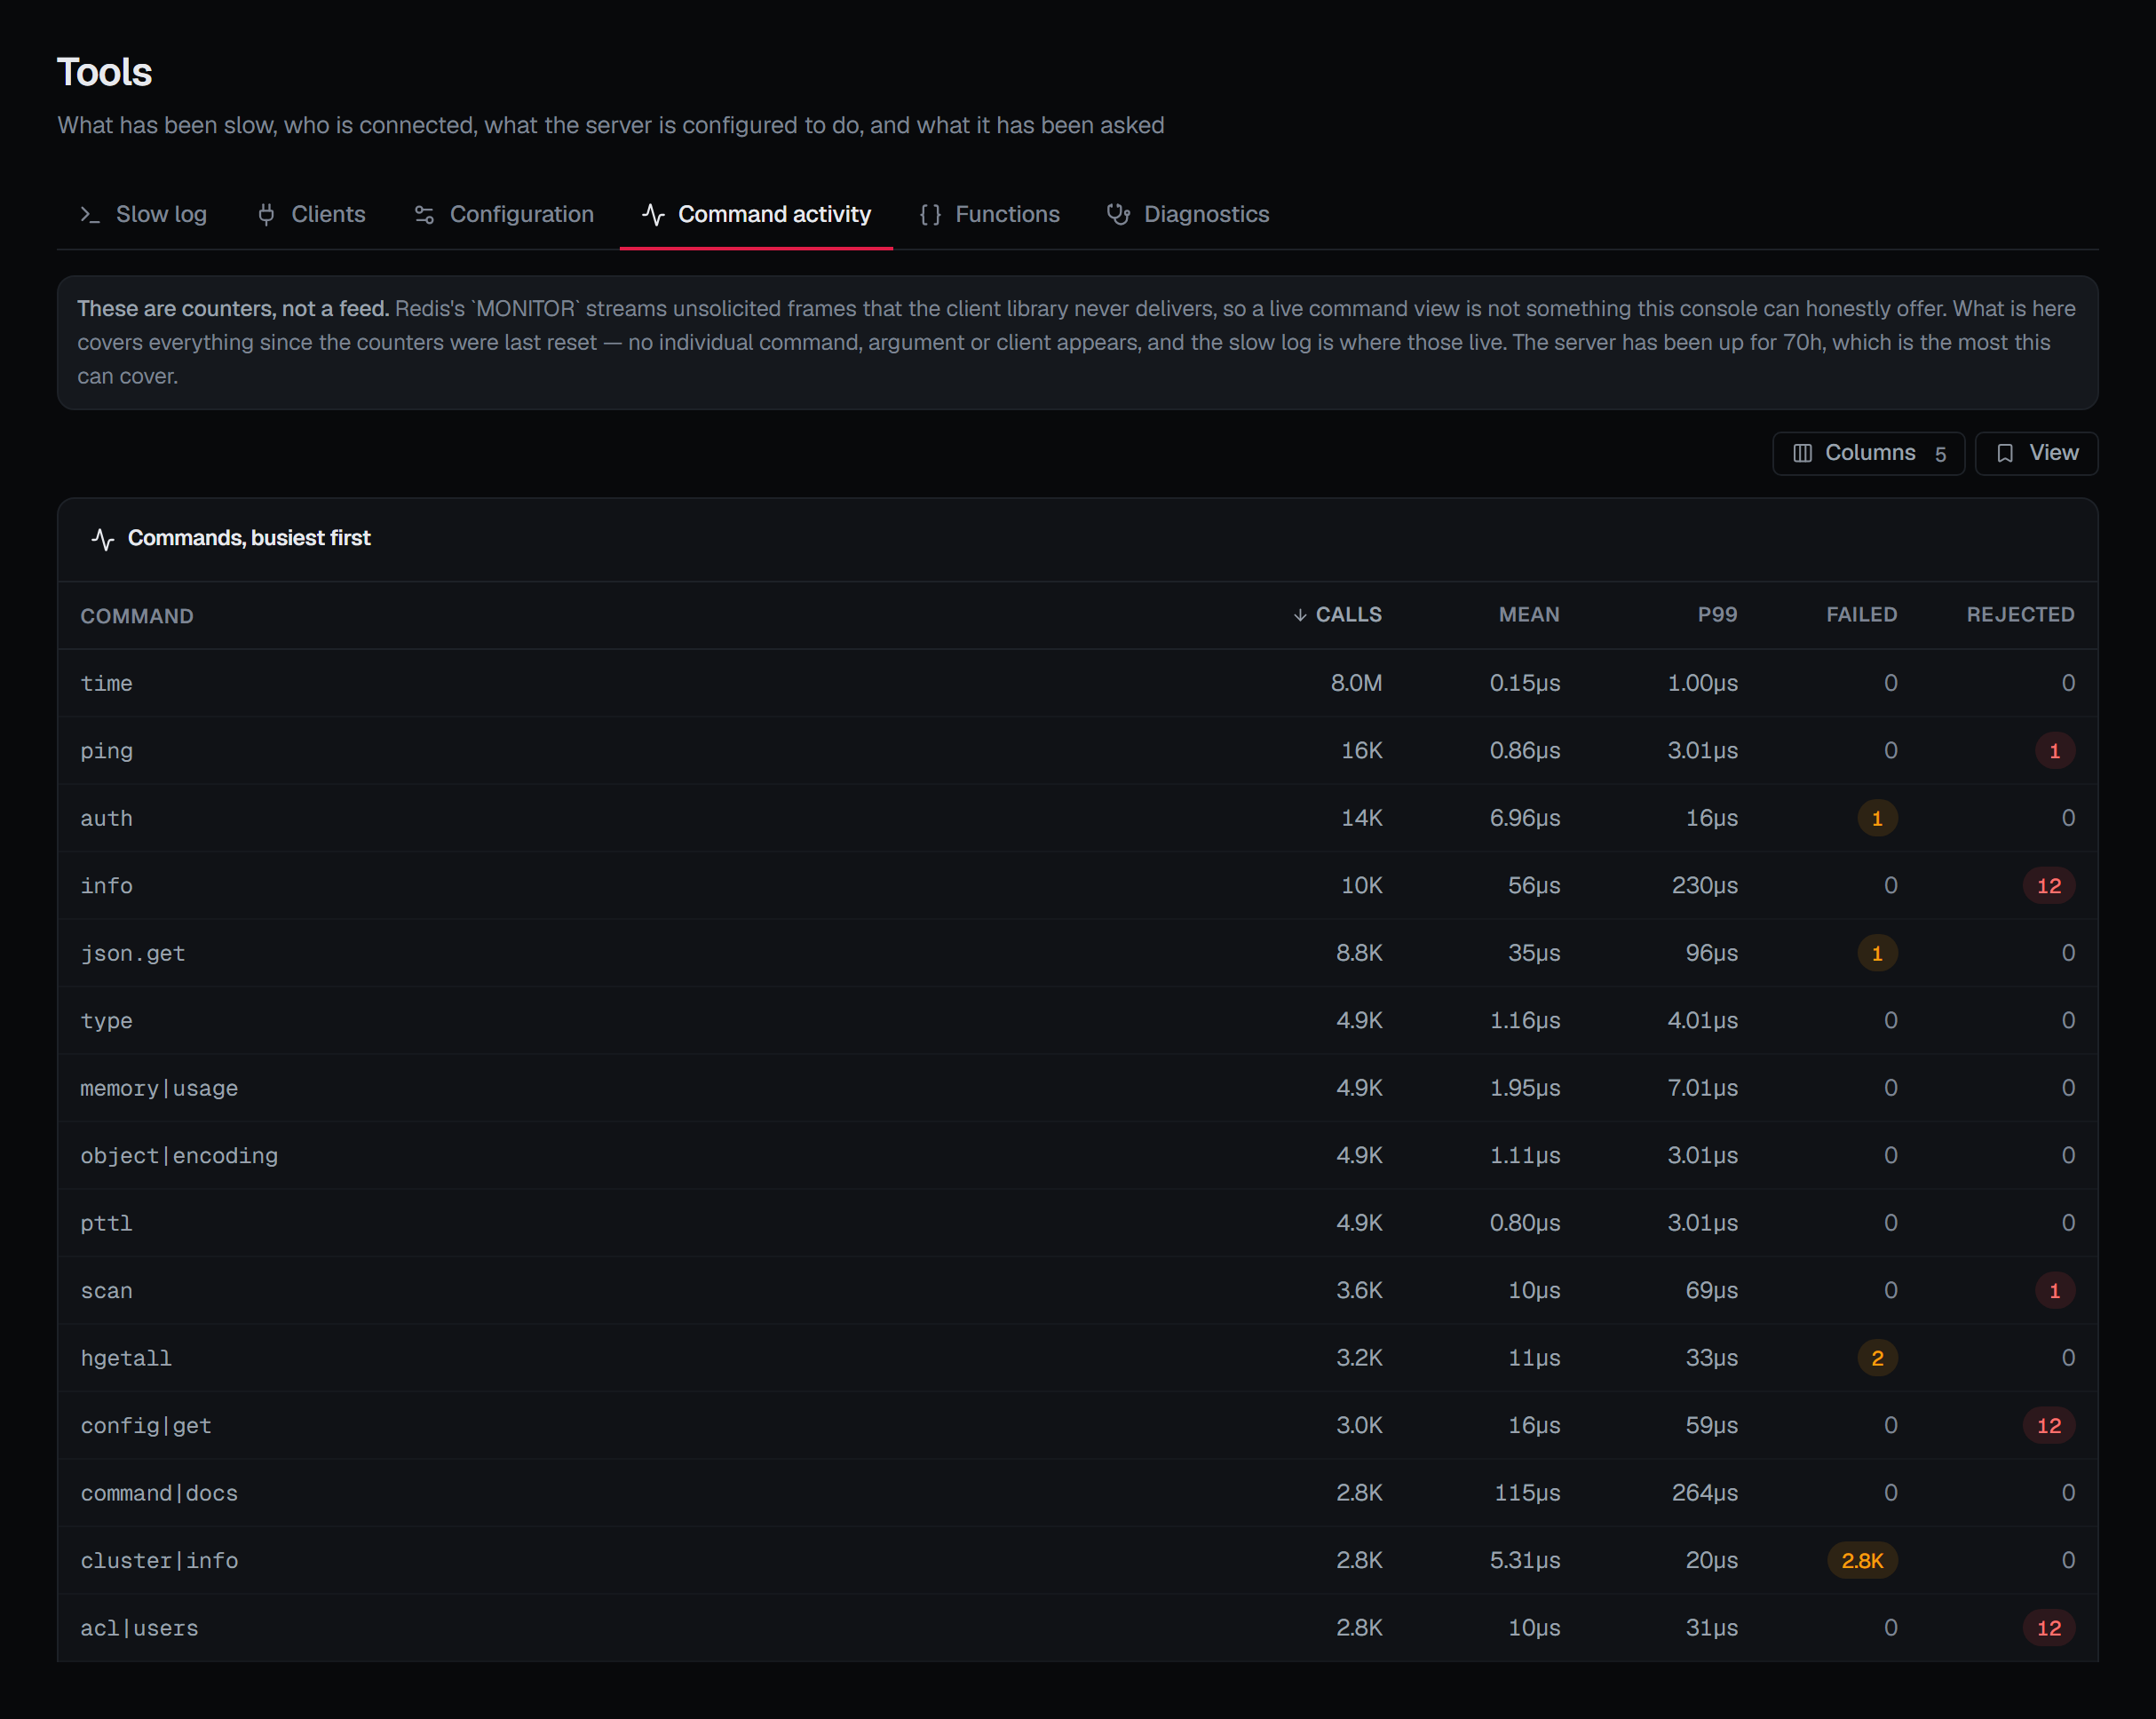
What the server has been asked to do since it started, per command: how many calls, the mean and the 99th-percentile latency, and how many were rejected or failed — with the error codes it returned ranked by frequency.
This is a set of counters, not a live feed, and the screen says so. It also states its own coverage: the server's uptime is the most this can cover.
The most, not exactly — because the counters can be reset, on the Configuration tab or by any other client, and a reset is not accounted for. The window can be shorter than the uptime and never longer.
There is no live command stream in BROKA, and the reason is mechanical rather than a policy: Redis's streaming command feed replies with an acknowledgement and then emits frames that the client library cannot receive — they are not the kind of unsolicited message its decoder reads. Measured against Redis 8.10, it delivers nothing. Counters answer the same operational questions — what is this server actually doing, and what is failing — without a mechanism that does not work.
Note that rejected and failed are different: one was refused before it ran, the other ran and returned an error.
Functions
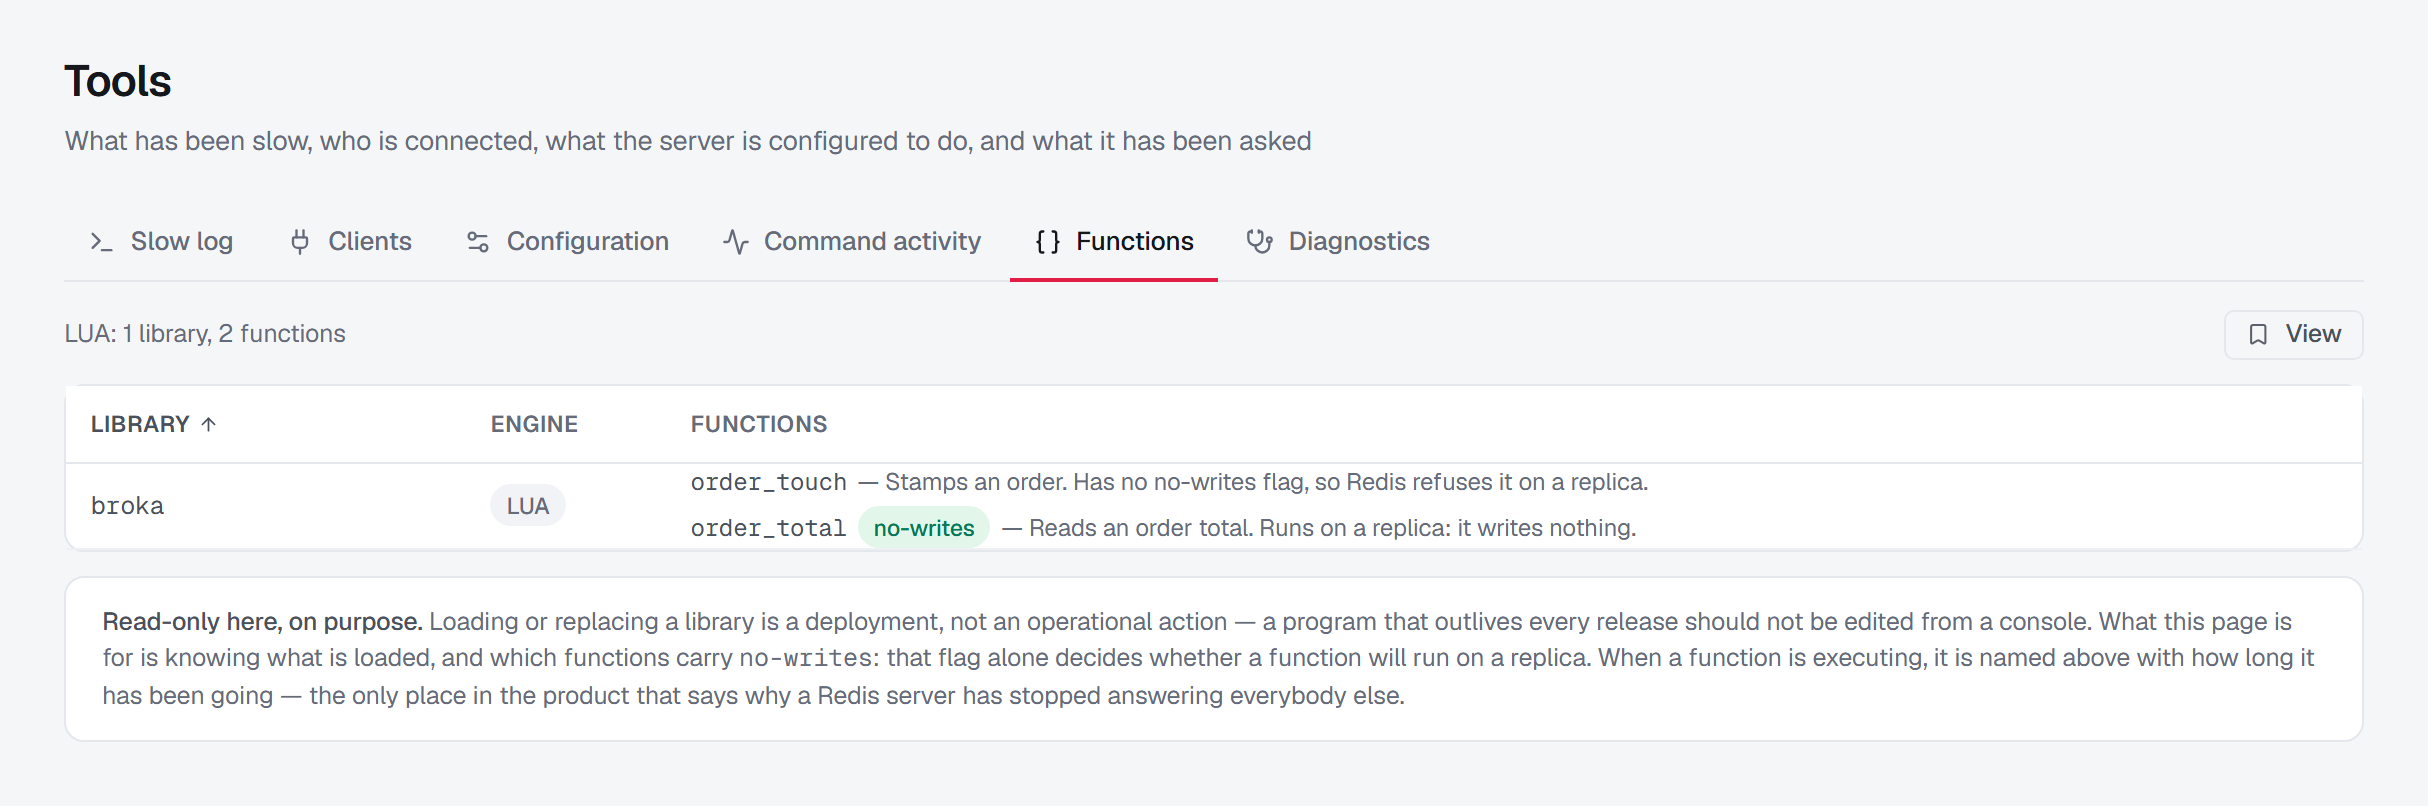
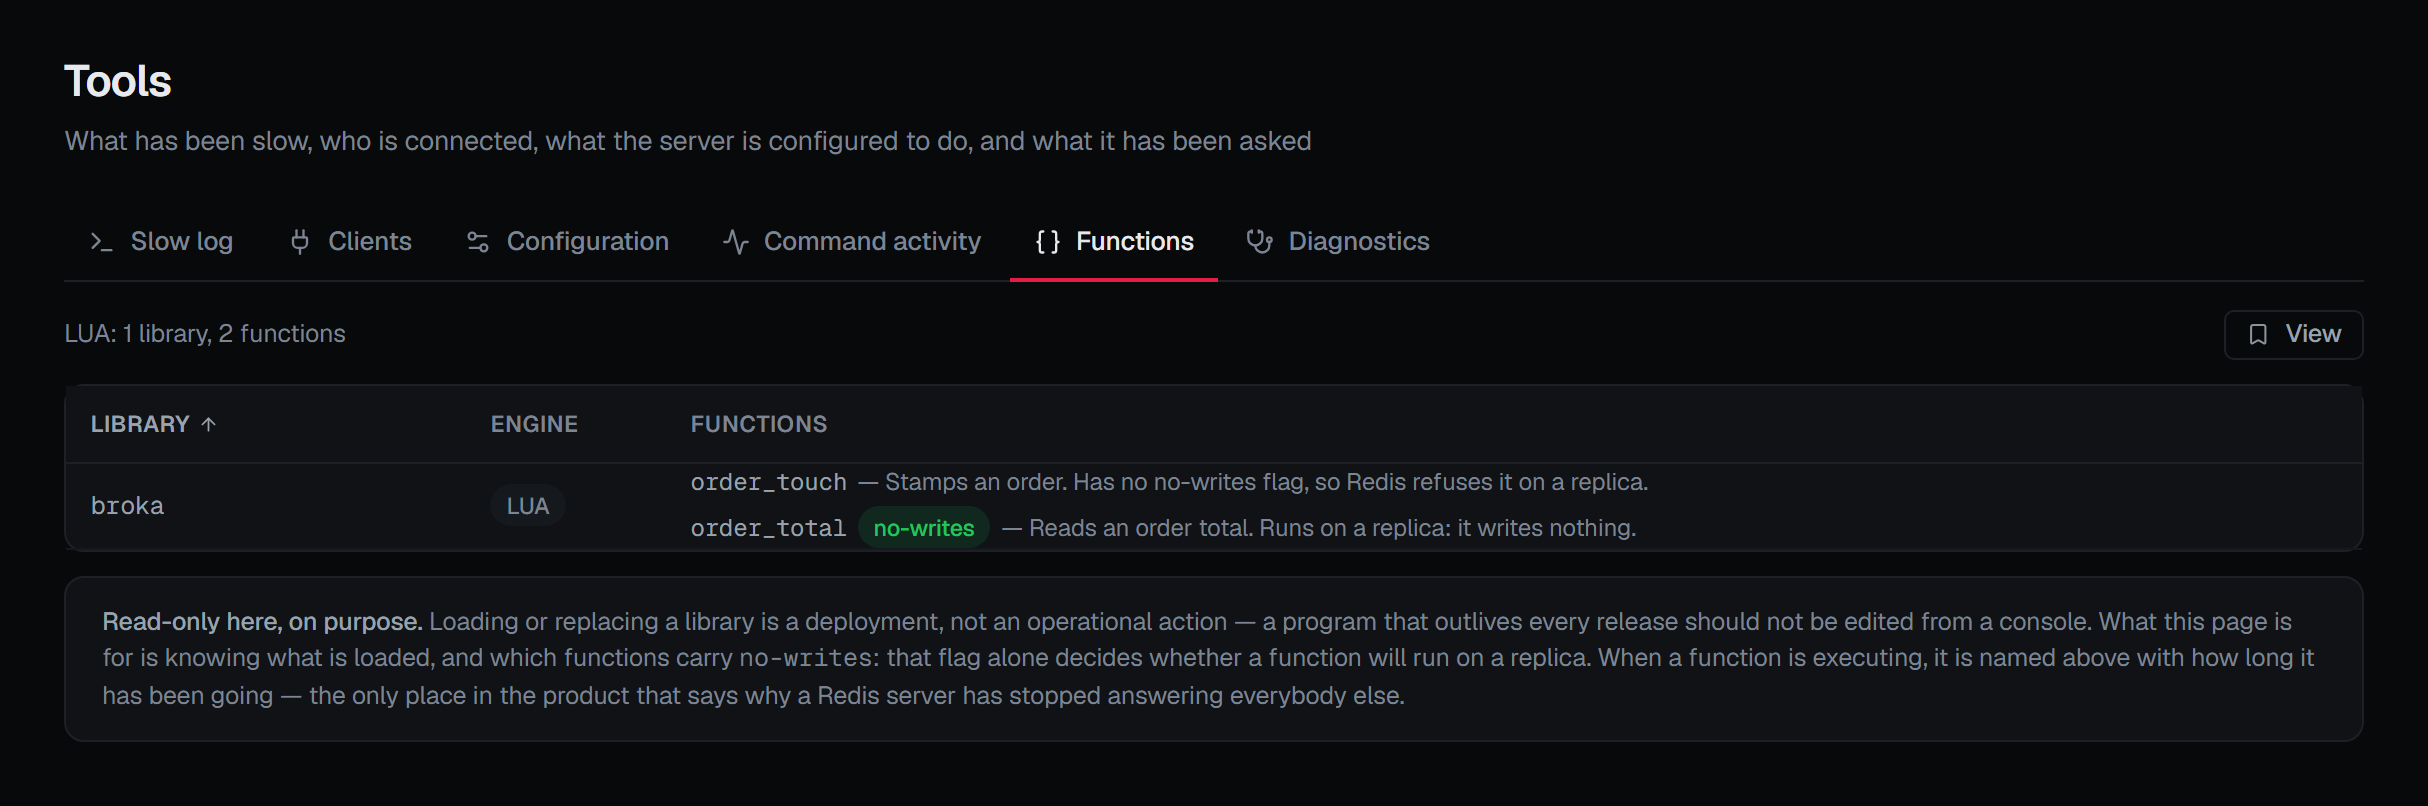
The function libraries loaded into the server, their engine, and each function with its description and flags.
The flag that matters is the one marking a function as making no writes, because that is what decides whether it may run on a replica. A library with one flagged function and one without shows the difference; a list without the flag would show nothing worth knowing.
This view is read-only, and the page says why rather than leaving it looking unfinished.
When a script or function has been running long enough to block the server, the tab names it above the
libraries — what is running, for how long, and the call with its arguments. That read is the one Redis
still answers while it is blocked, so it keeps working at exactly that moment; every other screen on
the connection says the server is busy running a script and that SCRIPT KILL or FUNCTION KILL stops
it, rather than calling a feature unavailable.
Diagnostics
The server's own diagnosis — the latency monitor and the memory report — is on its own page: Diagnostics.