

Memory
Updated 3 October 2026 · applies to 1.0.0 · Commercial
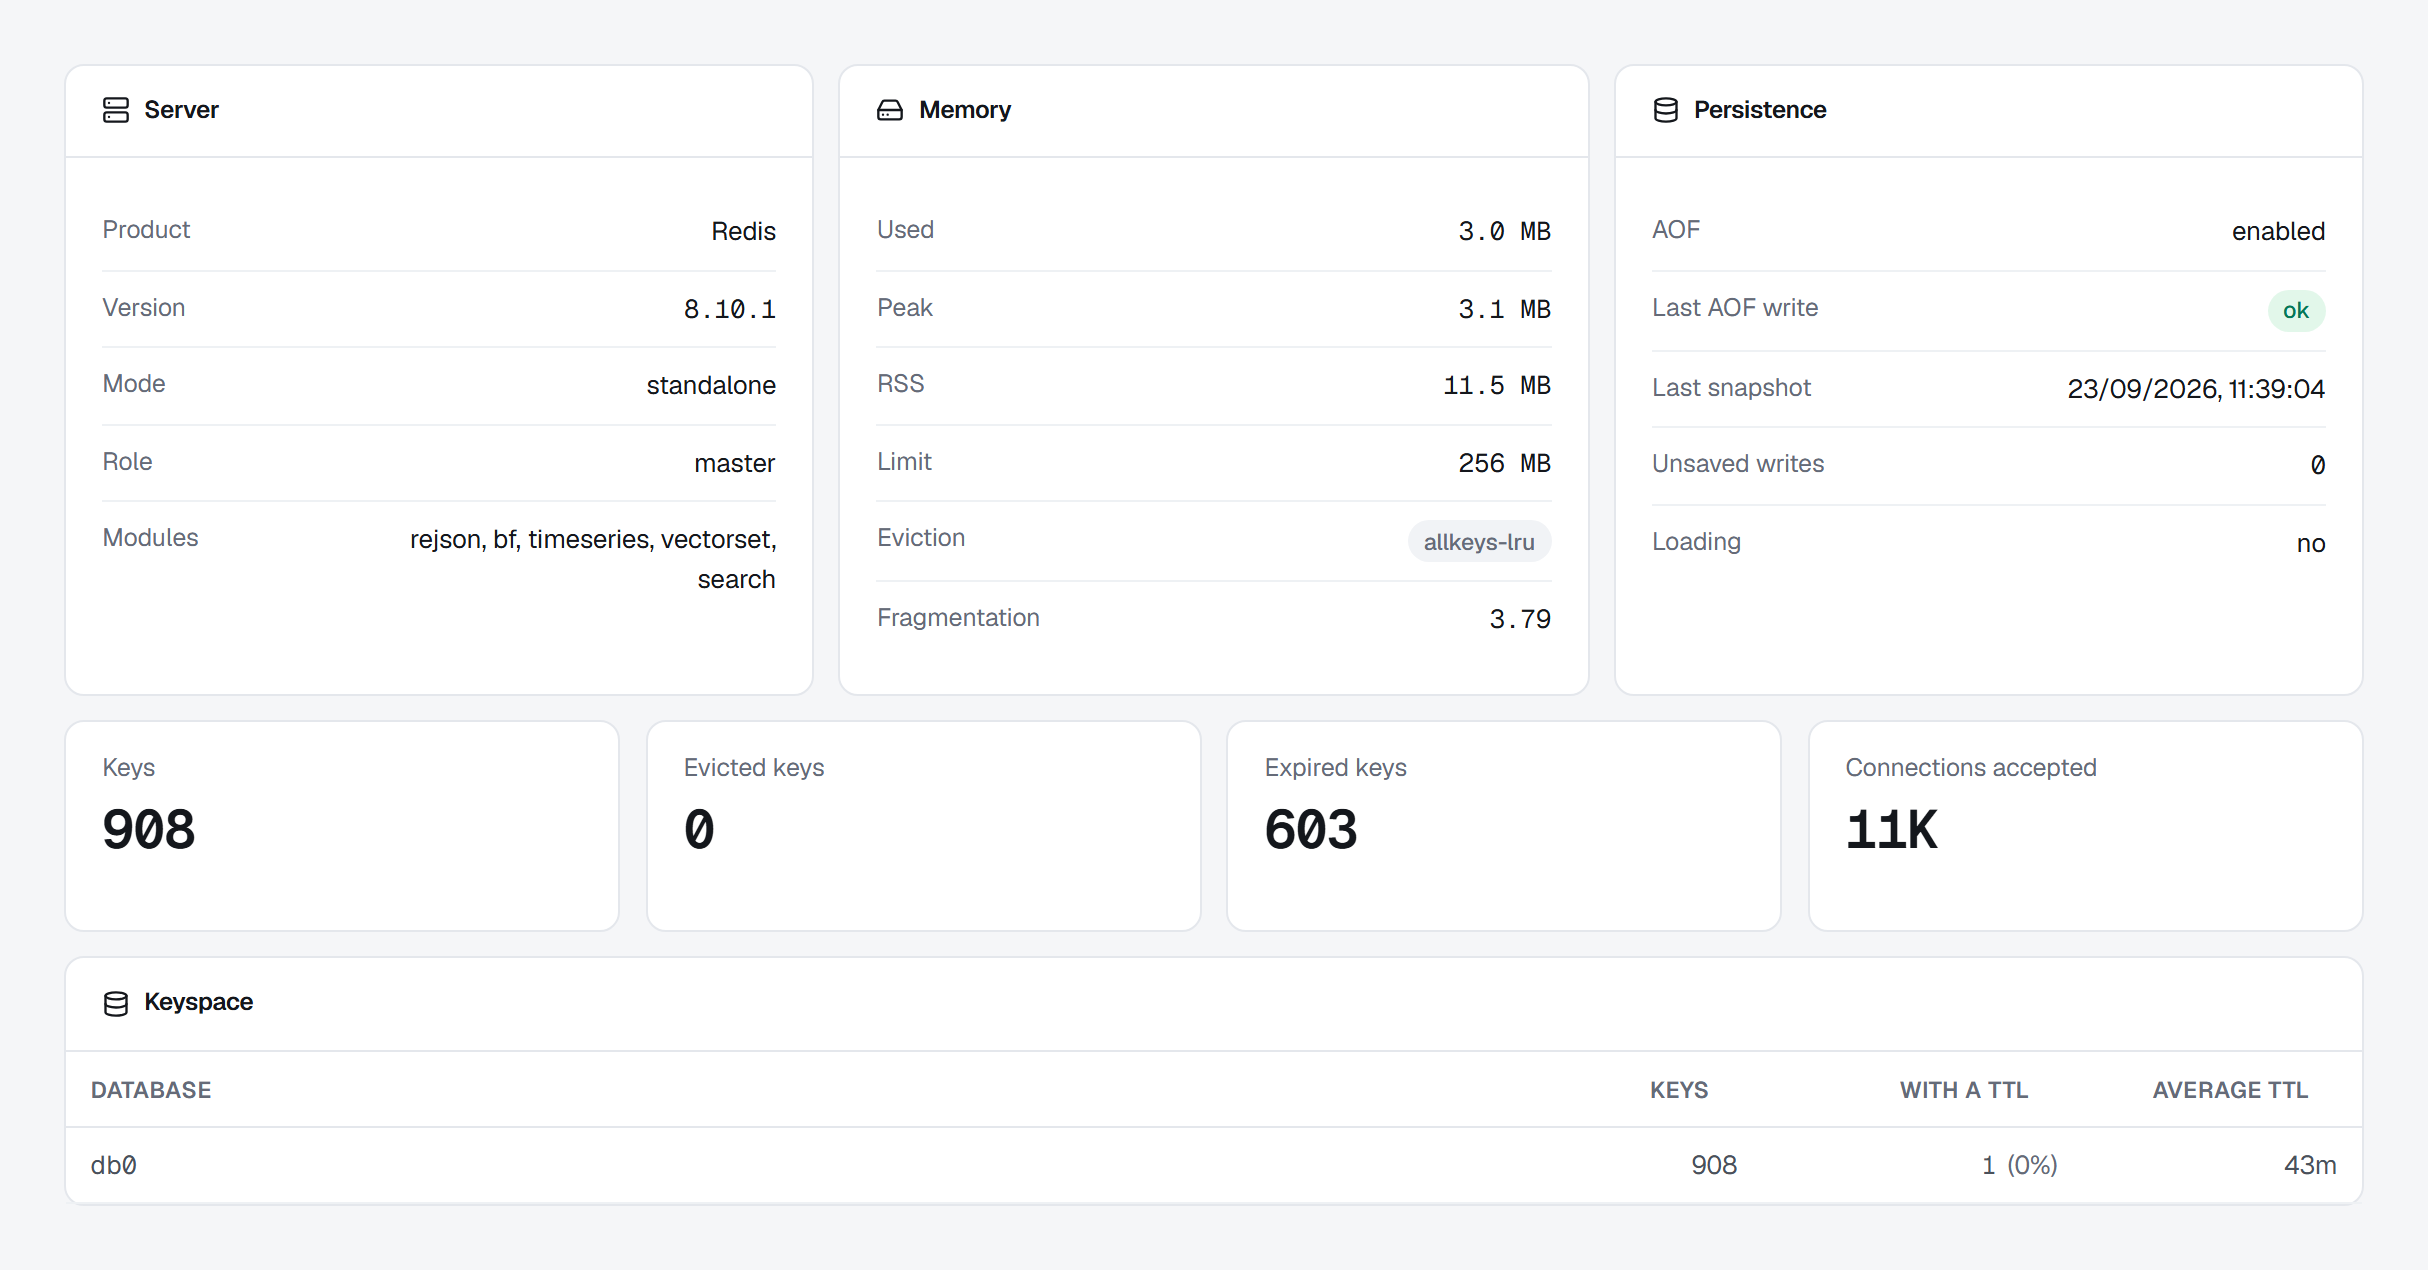
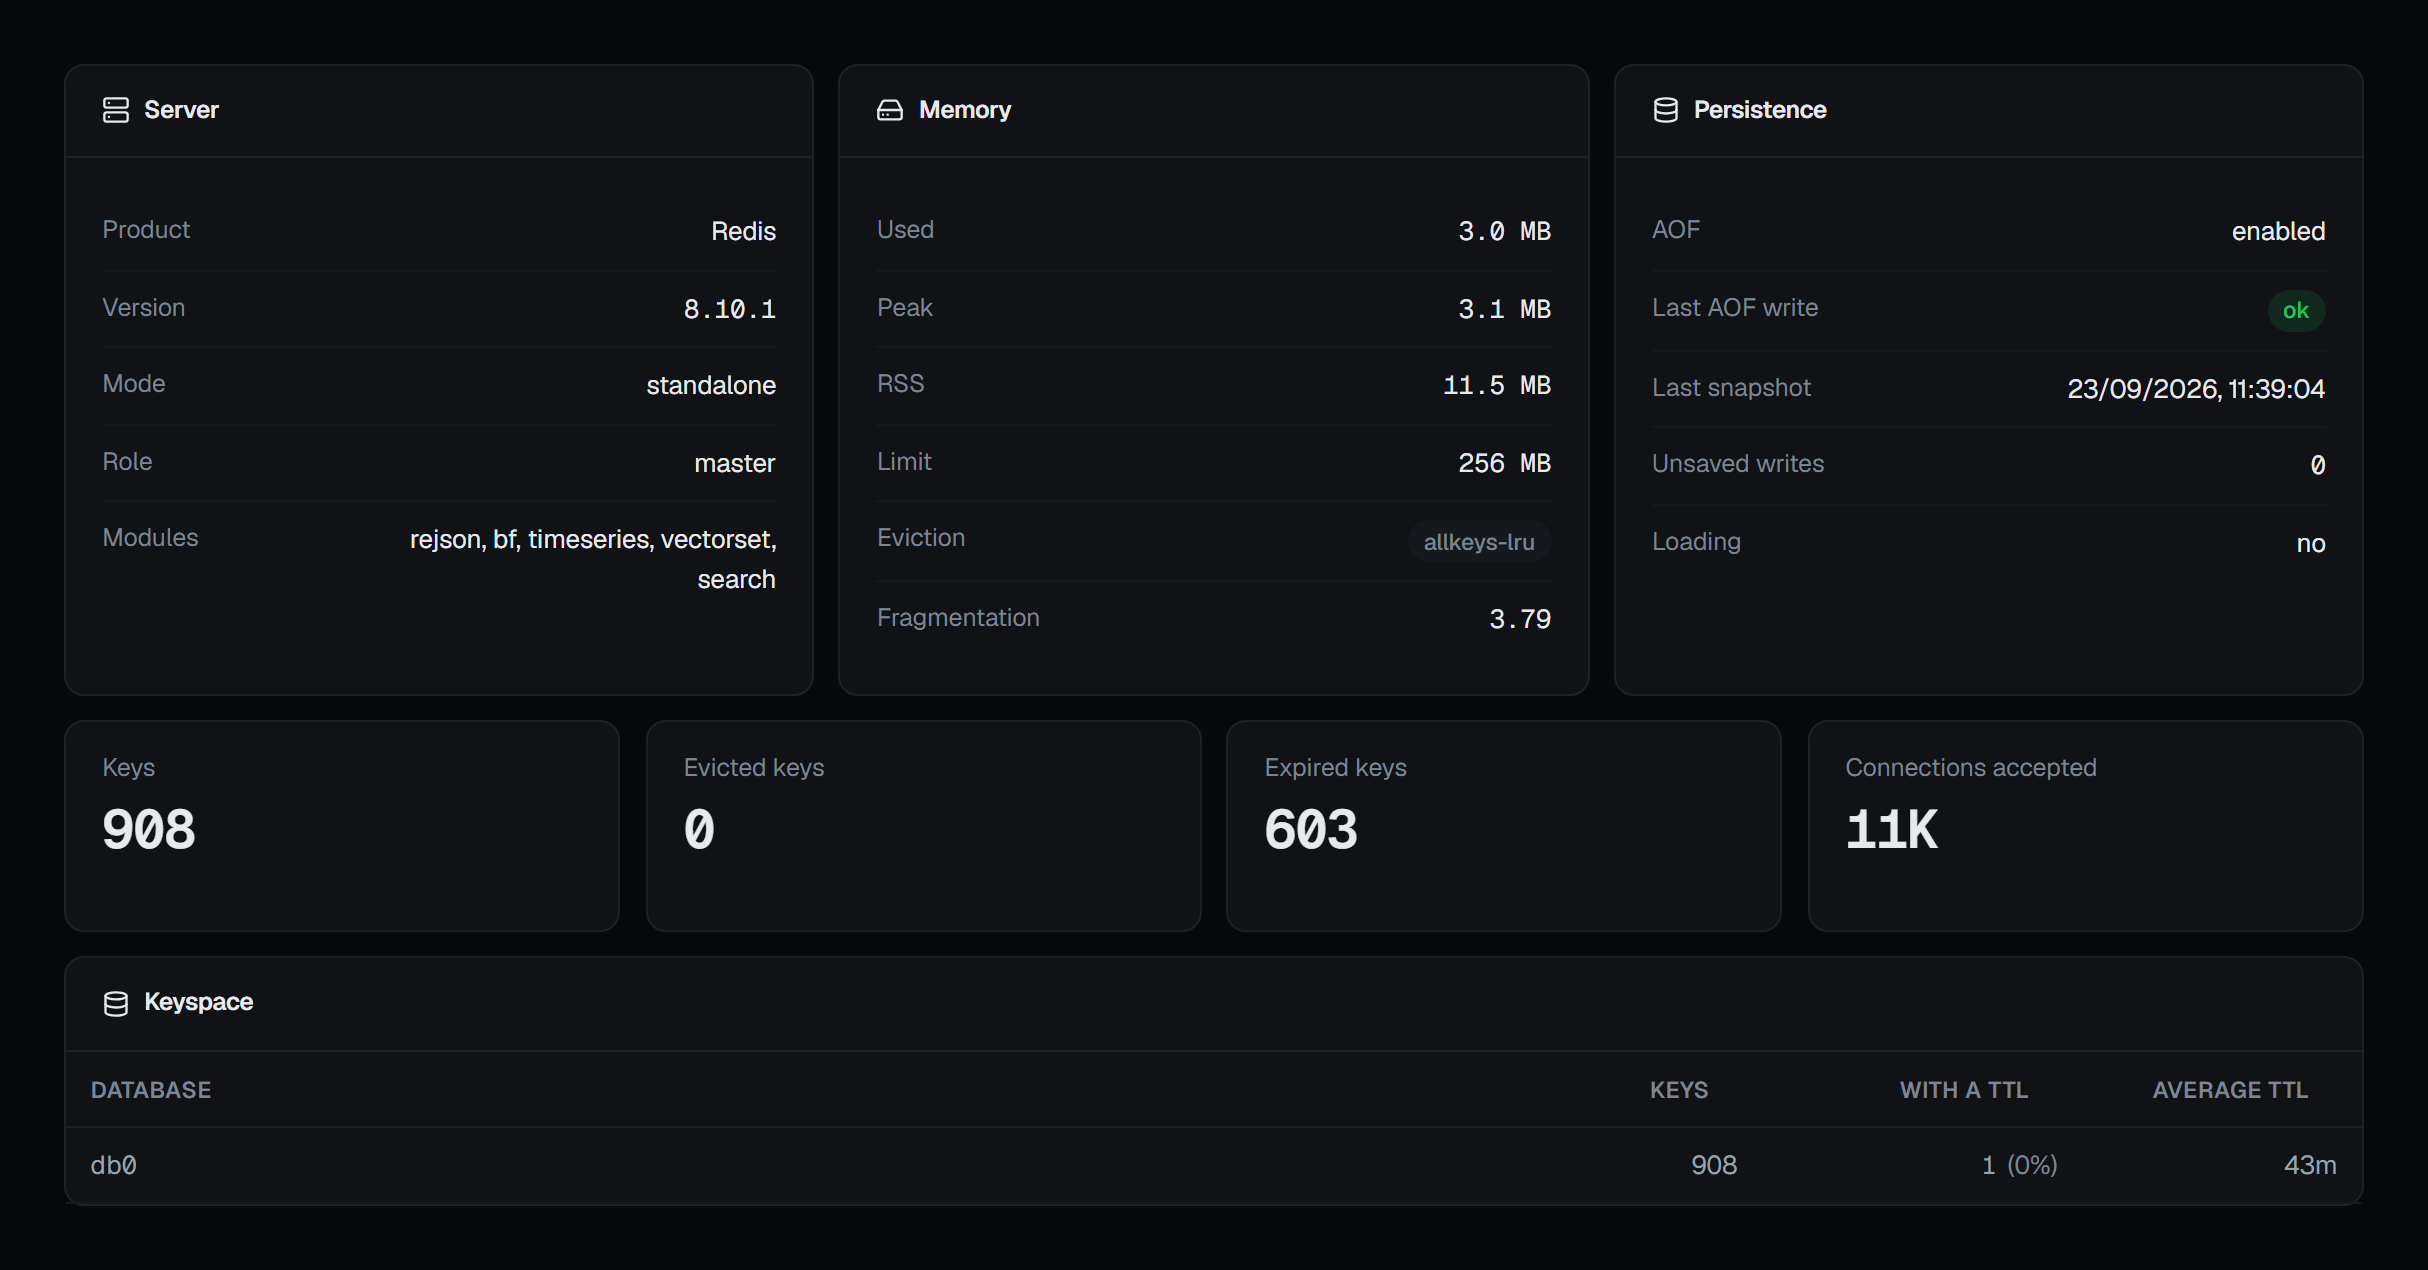
Redis holds your data in memory, so "how much is left" is the question that decides whether the next write succeeds. BROKA reports it from the server's own accounting, and is careful about the difference between the numbers.
The four figures, and why they differ
Used is what Redis believes its data occupies. Peak is the most it has ever used since it started — which is the number that tells you whether today's calm follows a spike. RSS is what the operating system has actually given the process, and it is normally larger than used, because an allocator does not return every freed page.
The limit is what Redis will allow itself before it starts evicting or refusing writes. A server with no limit configured reads unset, and it is not a server with infinite memory; it is one that will keep allocating until the machine stops it, which is a worse failure than an eviction.
Fragmentation is the ratio between the last two. A ratio near 1 means the allocator is returning what Redis frees. A high one means the process is holding memory Redis is no longer using — the shape of an instance that had a large workload and has since shrunk.
What happens when the limit is reached
The eviction policy decides that, and it is shown beside the limit because the two are only meaningful together.
A policy that evicts keys will discard data to make room — which is correct for a cache and wrong for anything treated as a store of record. A policy that does not evict will start refusing writes instead. Knowing which of the two your instance does is knowing what "full" will look like when it happens.
What actually expires
Beside the memory figures is the keyspace: how many keys the instance holds, how many of them carry an expiry, and the average time left on those that do.
That ratio is the one worth watching. A cache where most keys have no expiry is a cache that only ever grows, and it will meet its limit eventually regardless of how it is sized.
A zero average is not rendered as a duration. A database where nothing expires reports zero, and printing that as "0m" would say keys expire instantly — the opposite of the truth. BROKA shows a dash instead, and its hover says which it is: nothing in that database expires, or the server has not computed an average yet.
Where the memory has gone
The keyspace analysis answers that: memory by type, memory by namespace, and the largest individual keys.
It works from a sample, and every figure says which sample it came from — a walk that covered the whole keyspace says so, and one that stopped at its budget says that instead. Namespaces are ranked by measured bytes, so the ordering is useful even where sizes could not be read for every key.
Where sizes were unreadable for part of the sample, the byte totals say how many keys they actually cover. A total that quietly omitted the keys it could not measure would be a smaller number presented as a complete one.
On a cluster
The memory, client and throughput figures at the top describe the node the command reached, and the page says so rather than presenting one node's figures as the deployment's. The Per shard table further down reads every node at once — its keys, memory, clients and operations per second — and a node that did not answer says not answered rather than showing a zero. It has its answer within fifteen seconds; a shard still silent by then is a row saying so.
Numbers BROKA did not measure
A figure the server would not answer is left blank, with the reason, rather than rendered as zero. Some managed Redis tiers block the command that measures a key's memory; that costs the column it belongs to and nothing else.
The same rule governs the cache hit rate: on an instance that has served no reads, a hit rate is not
0% — it is not yet measurable, and 0% would read as a cache that never hits.
The server's own diagnosis
For Redis's own reading of its memory — the memory doctor, and every figure MEMORY STATS reports, each
size in its unit — see Diagnostics.