

Clusters
Updated 3 October 2026 · applies to 1.0.0 · Commercial
RabbitMQ ▸ Overview in the sidebar shows what the management API can tell you about a cluster in one read, starting with whether anything blocks publishers. Around that sit its version, its nodes and what each is running on, what is listening and which plugins are enabled.
BROKA reaches RabbitMQ over its management API. How a connection reaches the cluster — the management URL and AMQP endpoint, a password or OAuth 2.0, TLS and client certificates — and what its test proves are on Connecting and authentication.
The alarm band
This is the part of the screen worth reading first, and the reason it sits above everything else.
RabbitMQ raises a resource alarm when a node goes over its memory watermark or under its free-disk limit. When that happens the broker stops accepting publishes across the entire cluster — not just on the alarmed node. Connections move to blocking and then blocked, and from an application's side publishing simply stops, with no error to read.
An operator looking at a console that does not show this sees a healthy cluster and a stuck producer.
So BROKA puts it first, in its own colour, and says which nodes are alarmed and which kind of alarm it is. It also says the part that matters most:
RabbitMQ blocks publishing until the alarm clears; it cannot be cleared from here — free the resource or change the watermark on the broker.
There is no button. Neither alarm can be cleared over the management API — they clear when the resource pressure does, or when the watermark is changed, which is a broker-side change. BROKA reports it rather than offering an action it cannot perform.
The same condition surfaces in two other places, so you can arrive at it from either end: the alarmed node's state, and — on the Connections screen — a blocked client connection, with a tooltip saying the cause is the cluster and not the client.
The nodes
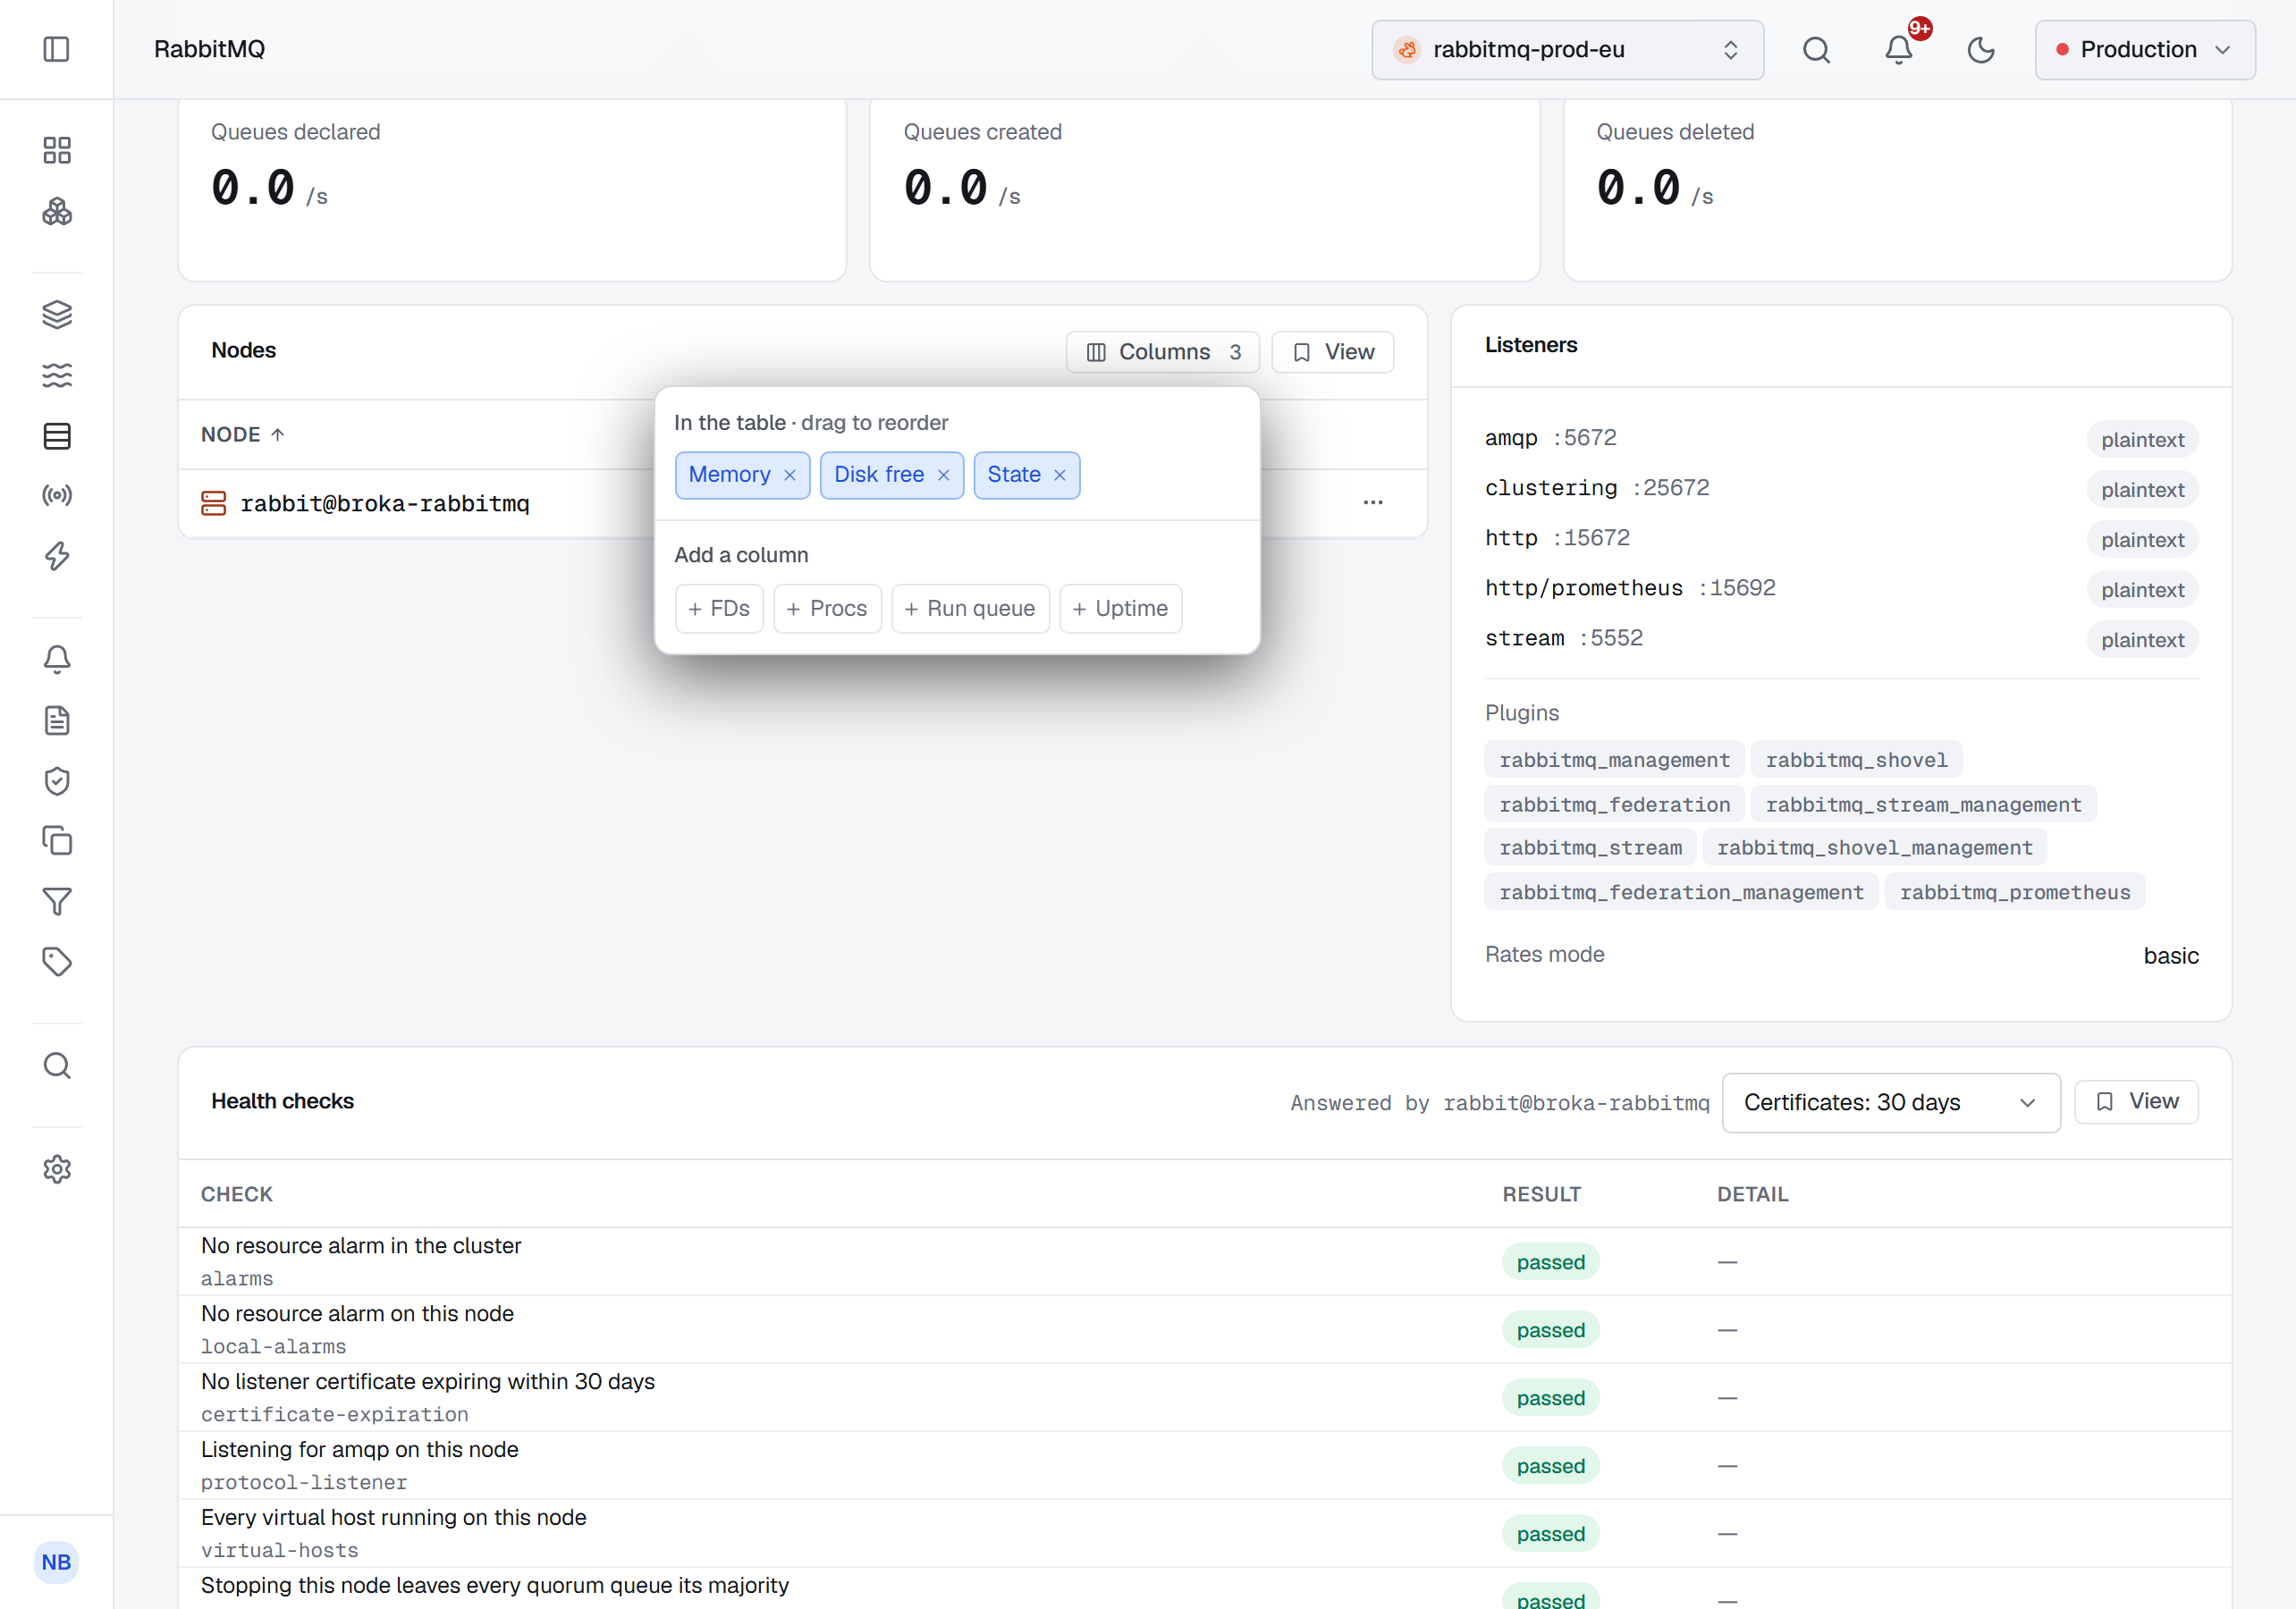
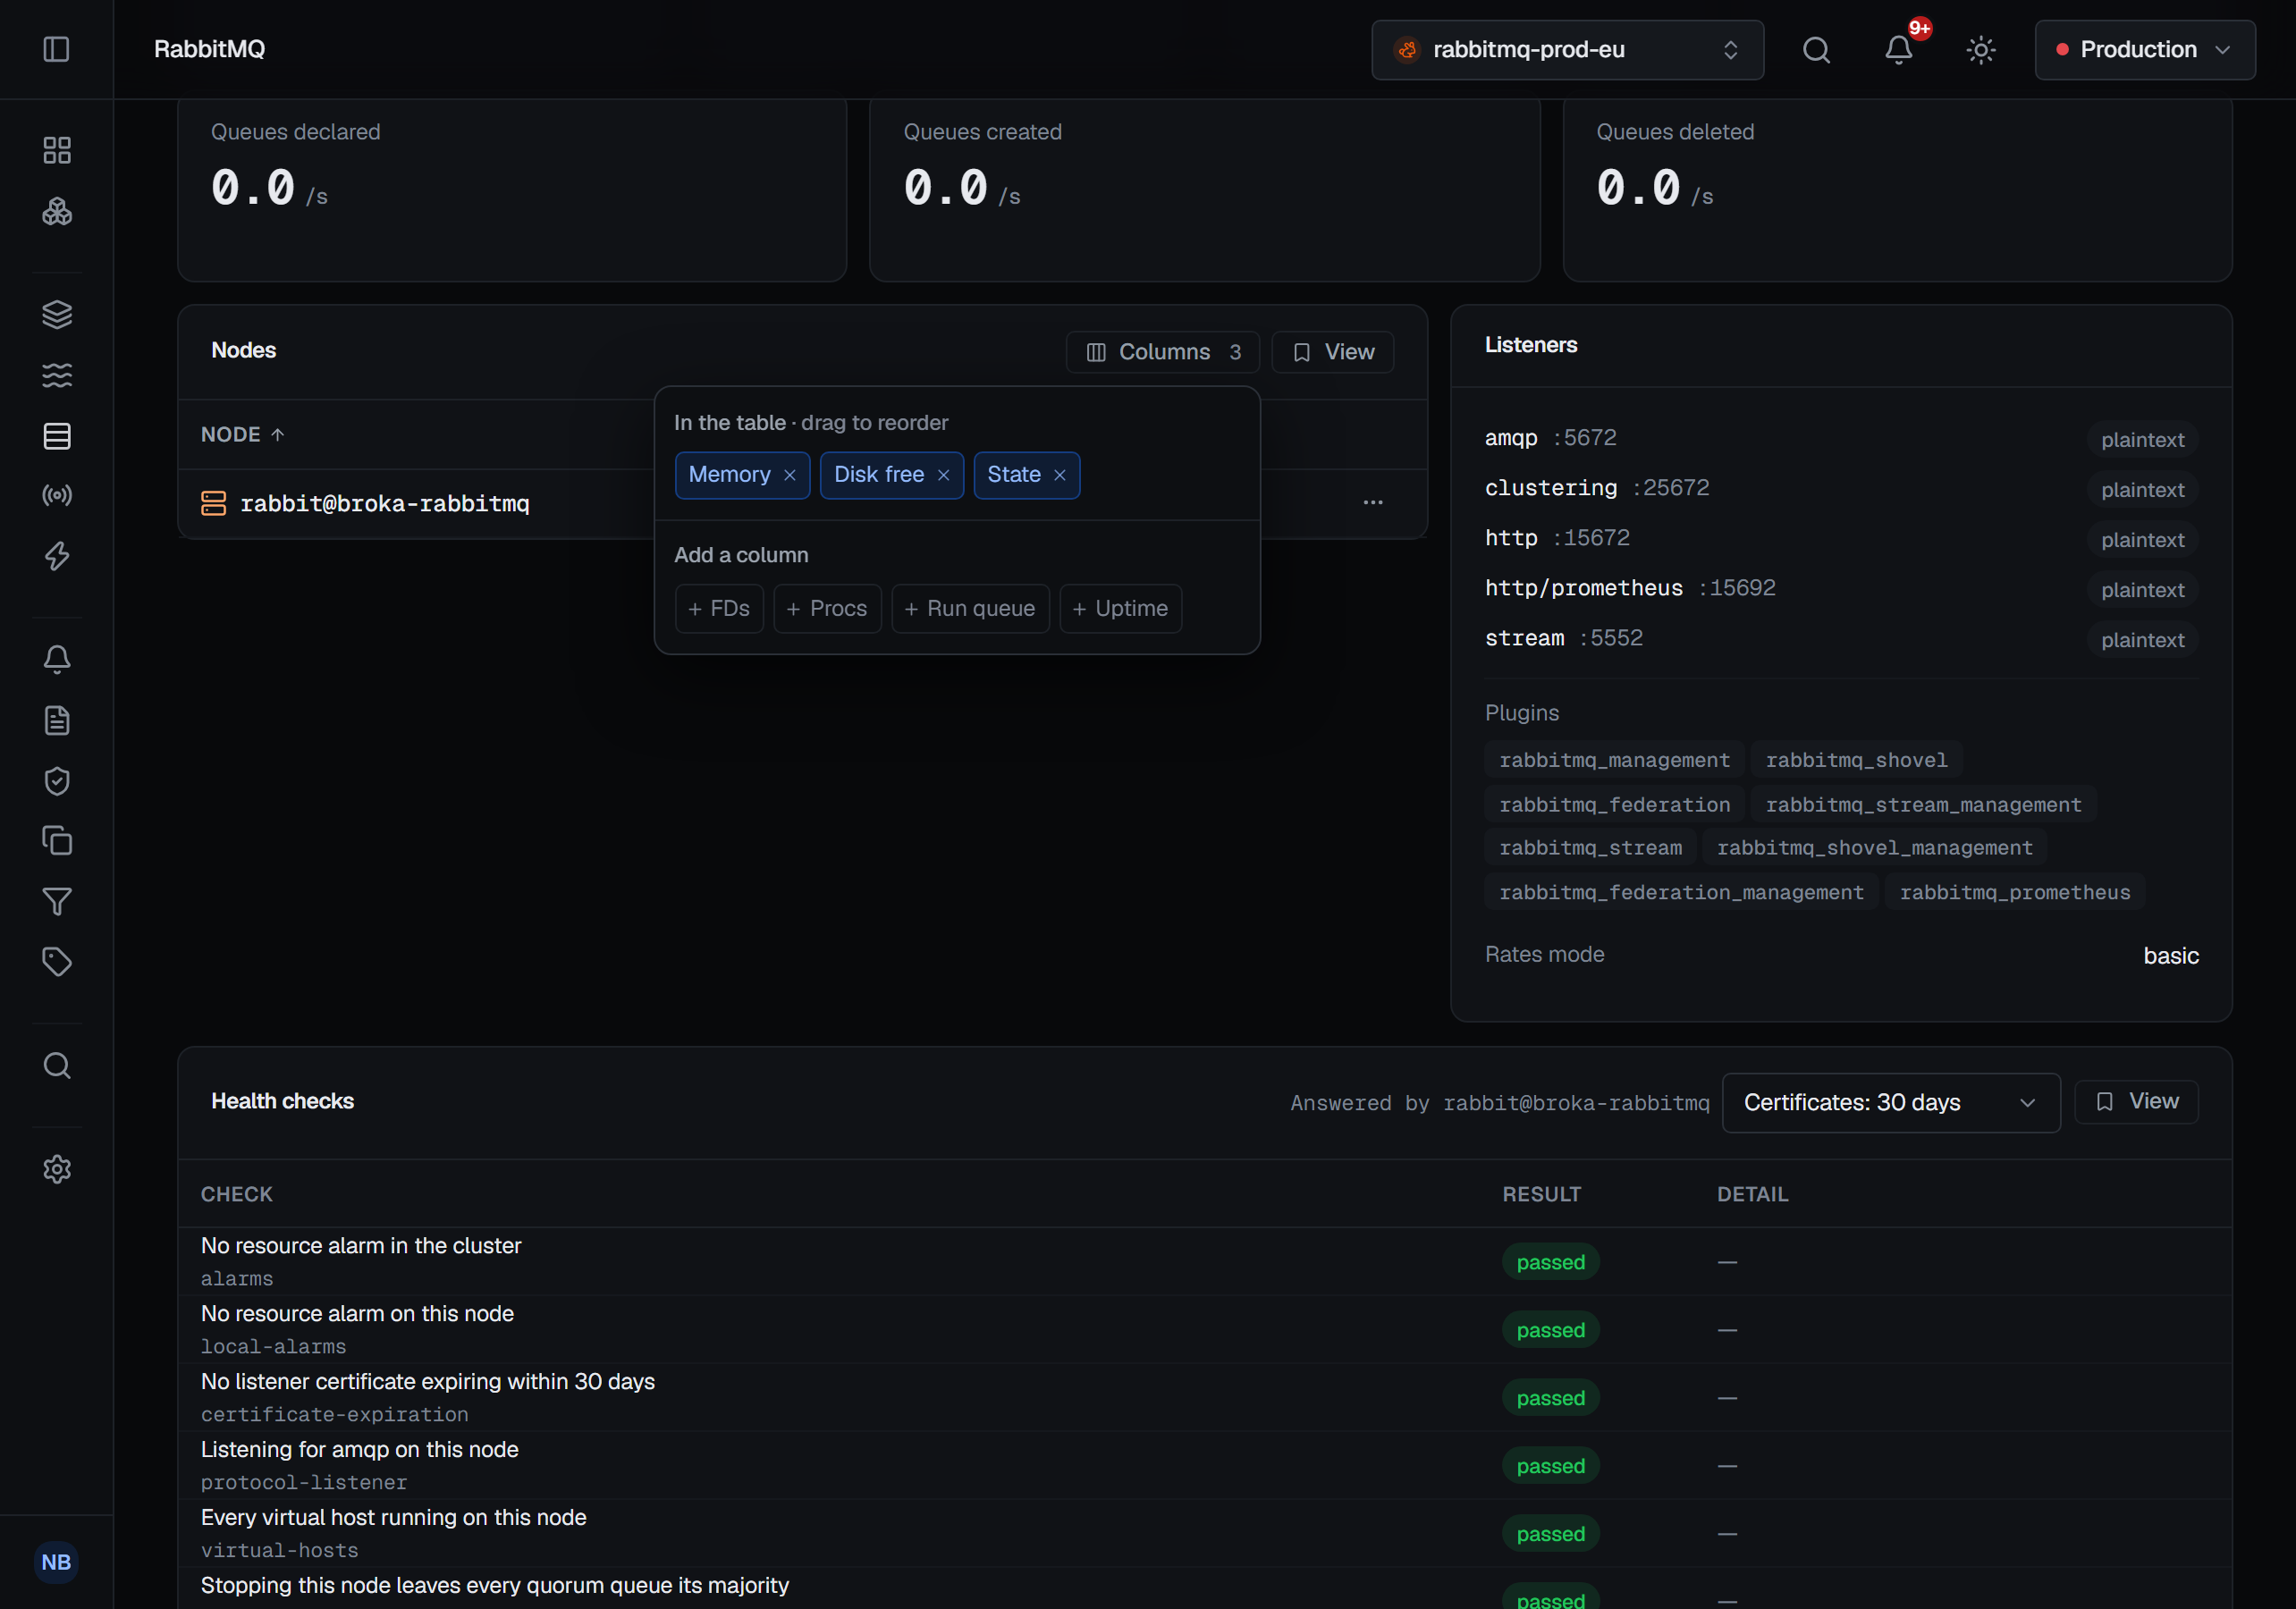
Each node shows its memory against its limit, its free disk and its state — down, alarm when it holds a memory or free-disk alarm, or running. A node being drained or partitioned is marked as such beside its name. The card's Columns control adds its file descriptors (FDs), Erlang processes (Procs), Run queue and Uptime.
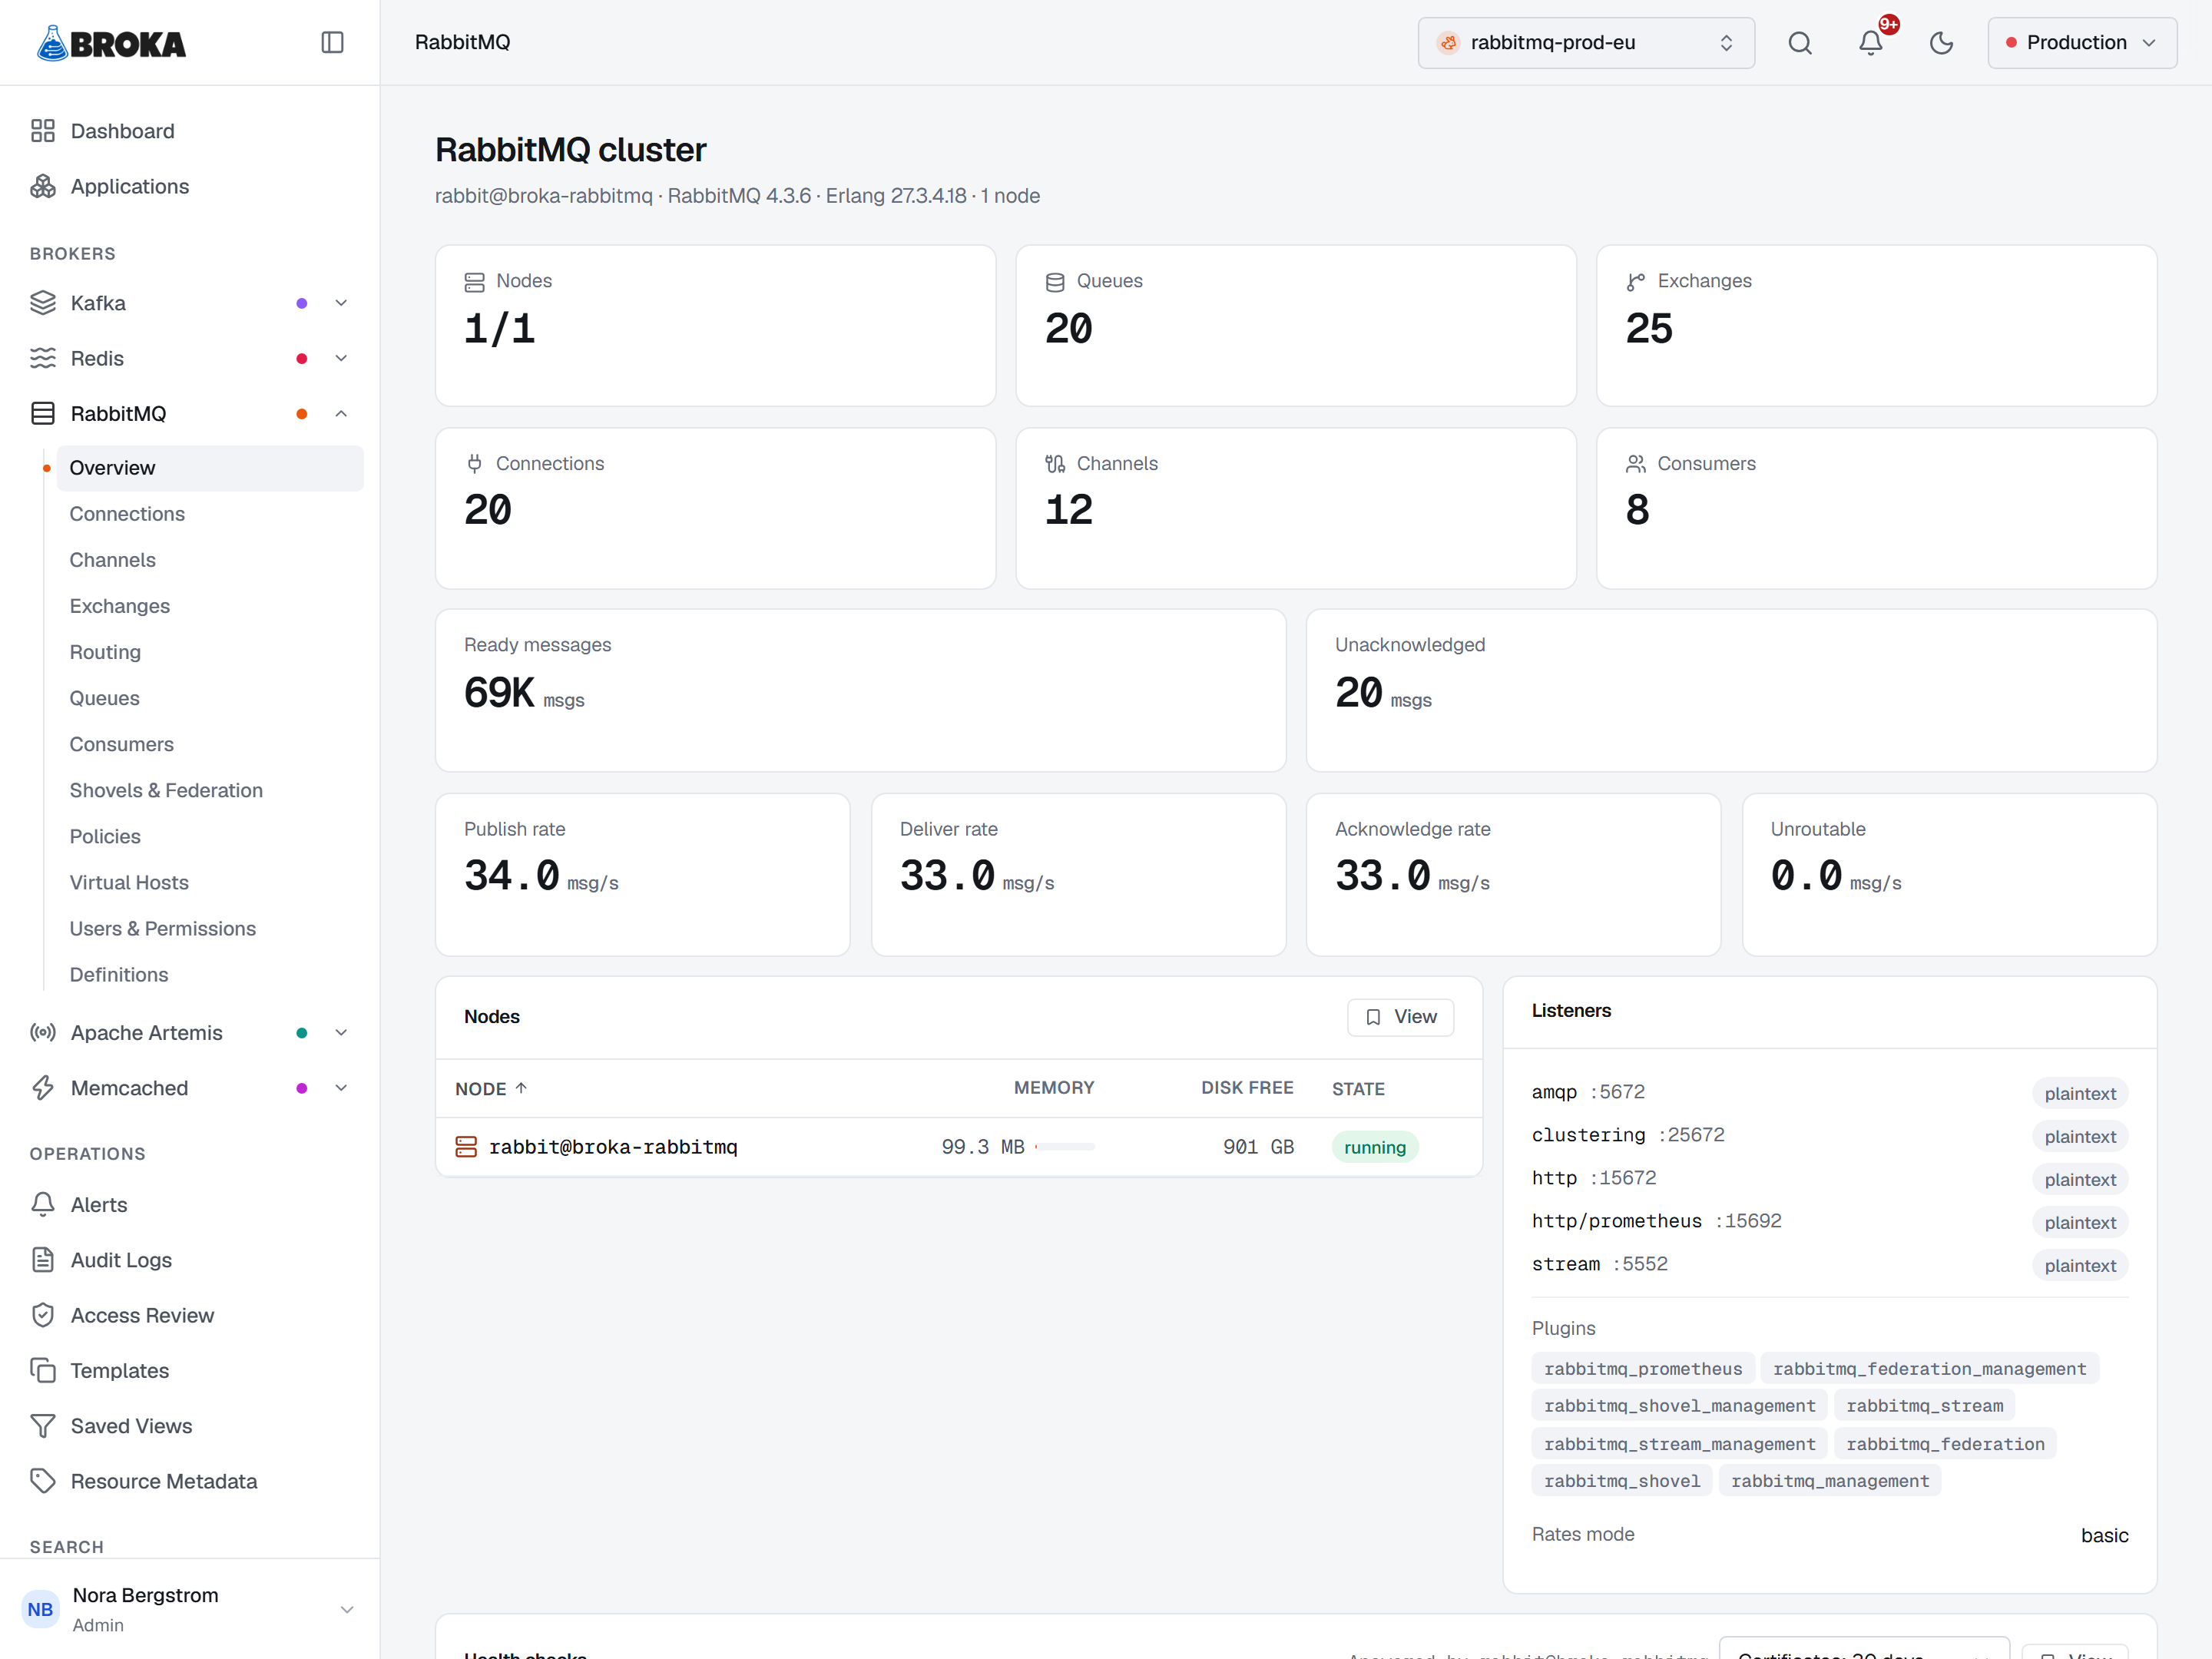
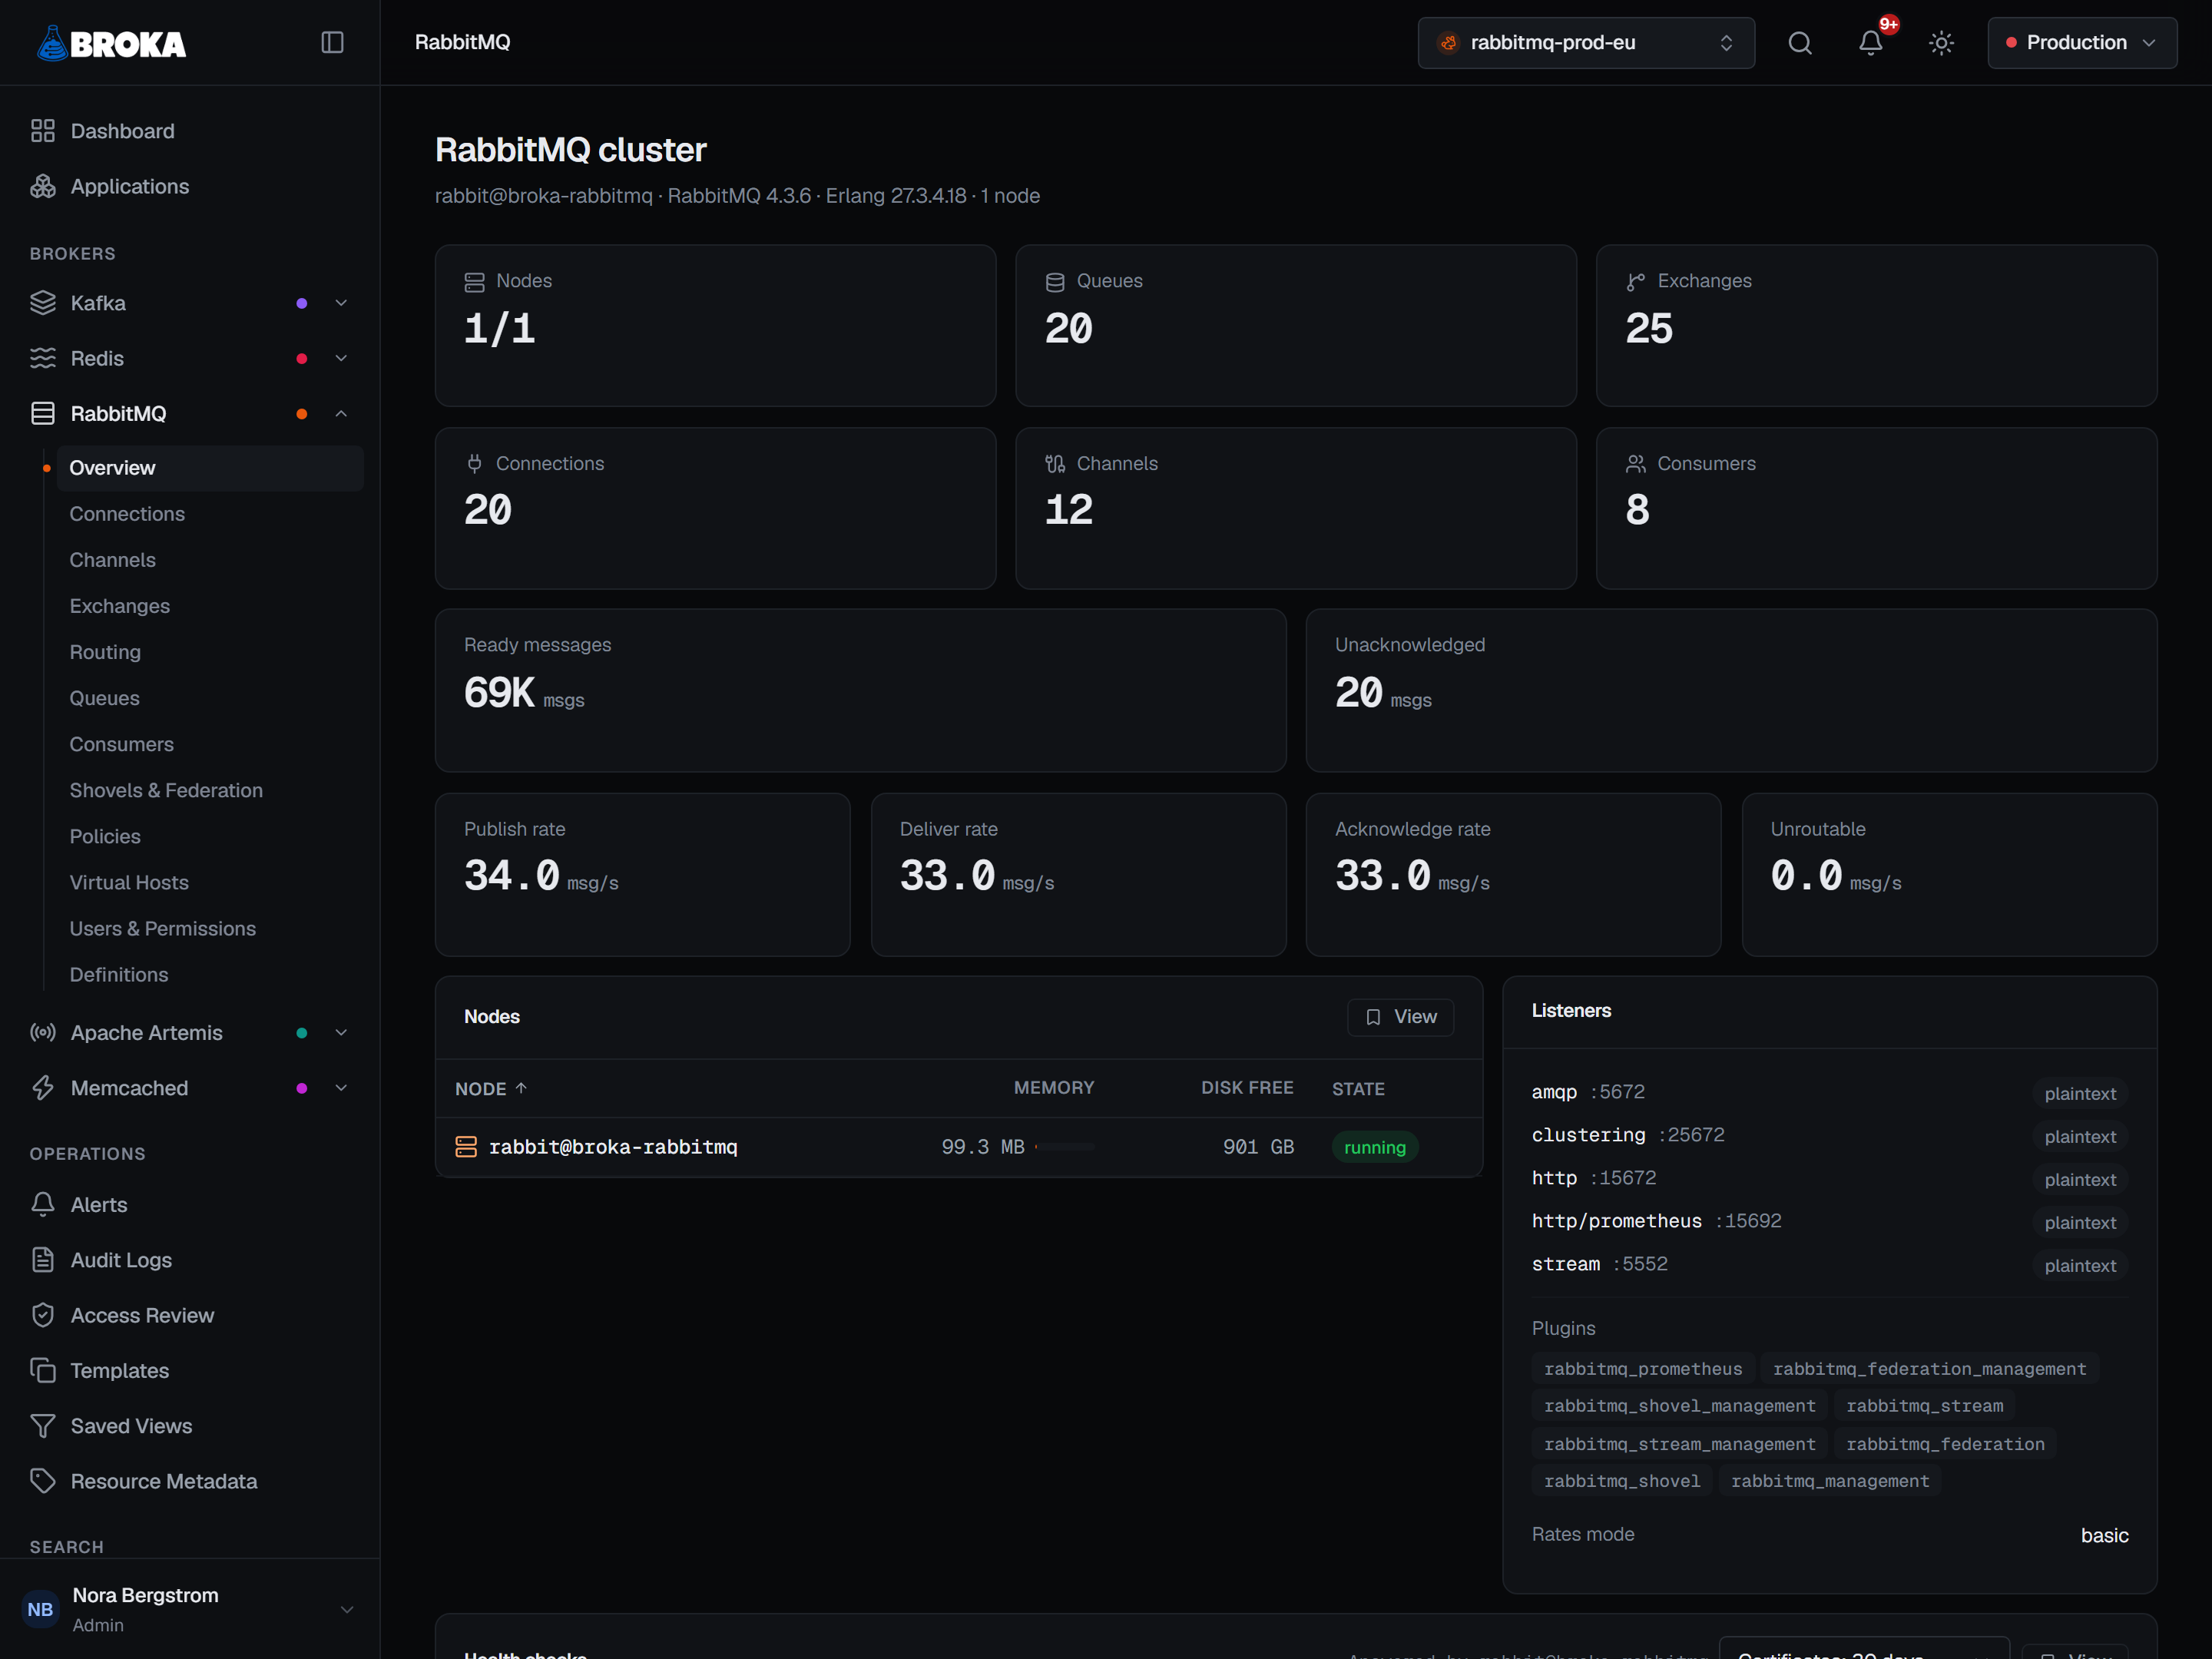
Memory is shown proportionally, because "159 MB" means nothing without the watermark it is measured against.
Opening a node's row shows where that memory goes: the broker's own breakdown of the node's memory into its categories — connections, queues, binaries, the internal tables and the rest — each with its size and its share, in the broker's order. It is the read to make before touching the watermark: a node near its limit because of connection buffers needs a different fix from one holding a deep queue in memory. A node that is not running reports no breakdown, and the dialog says so.
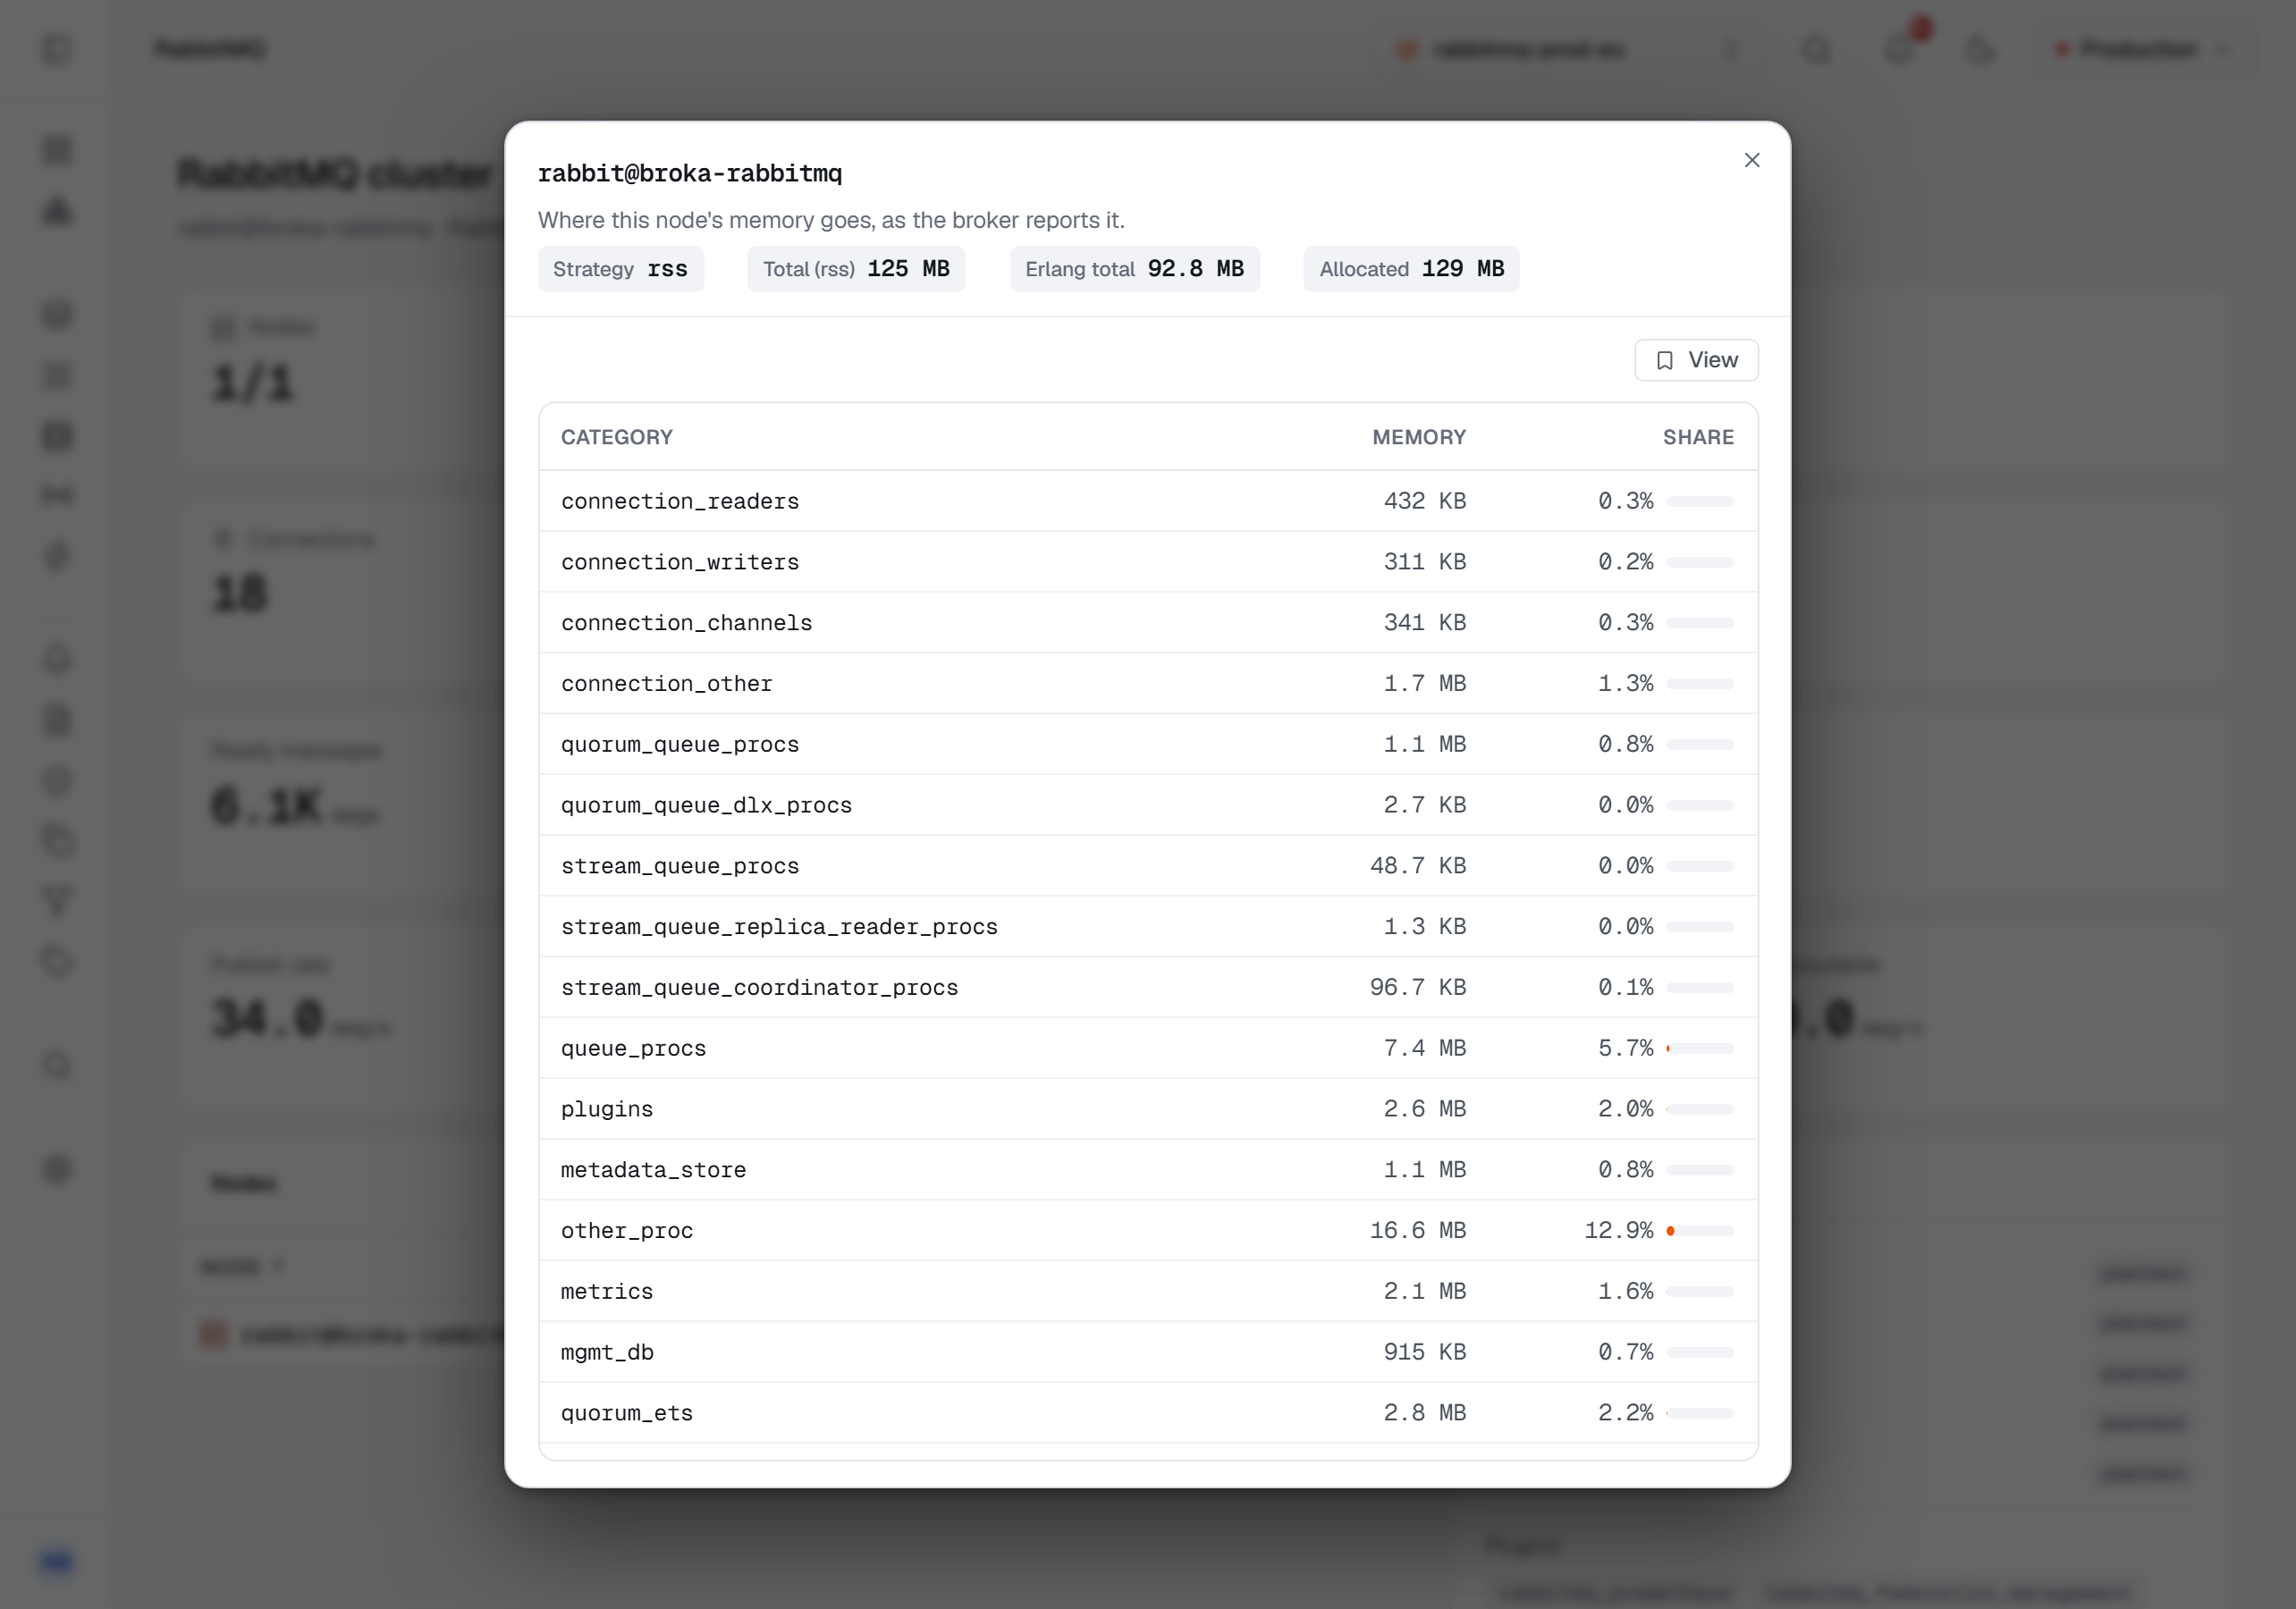
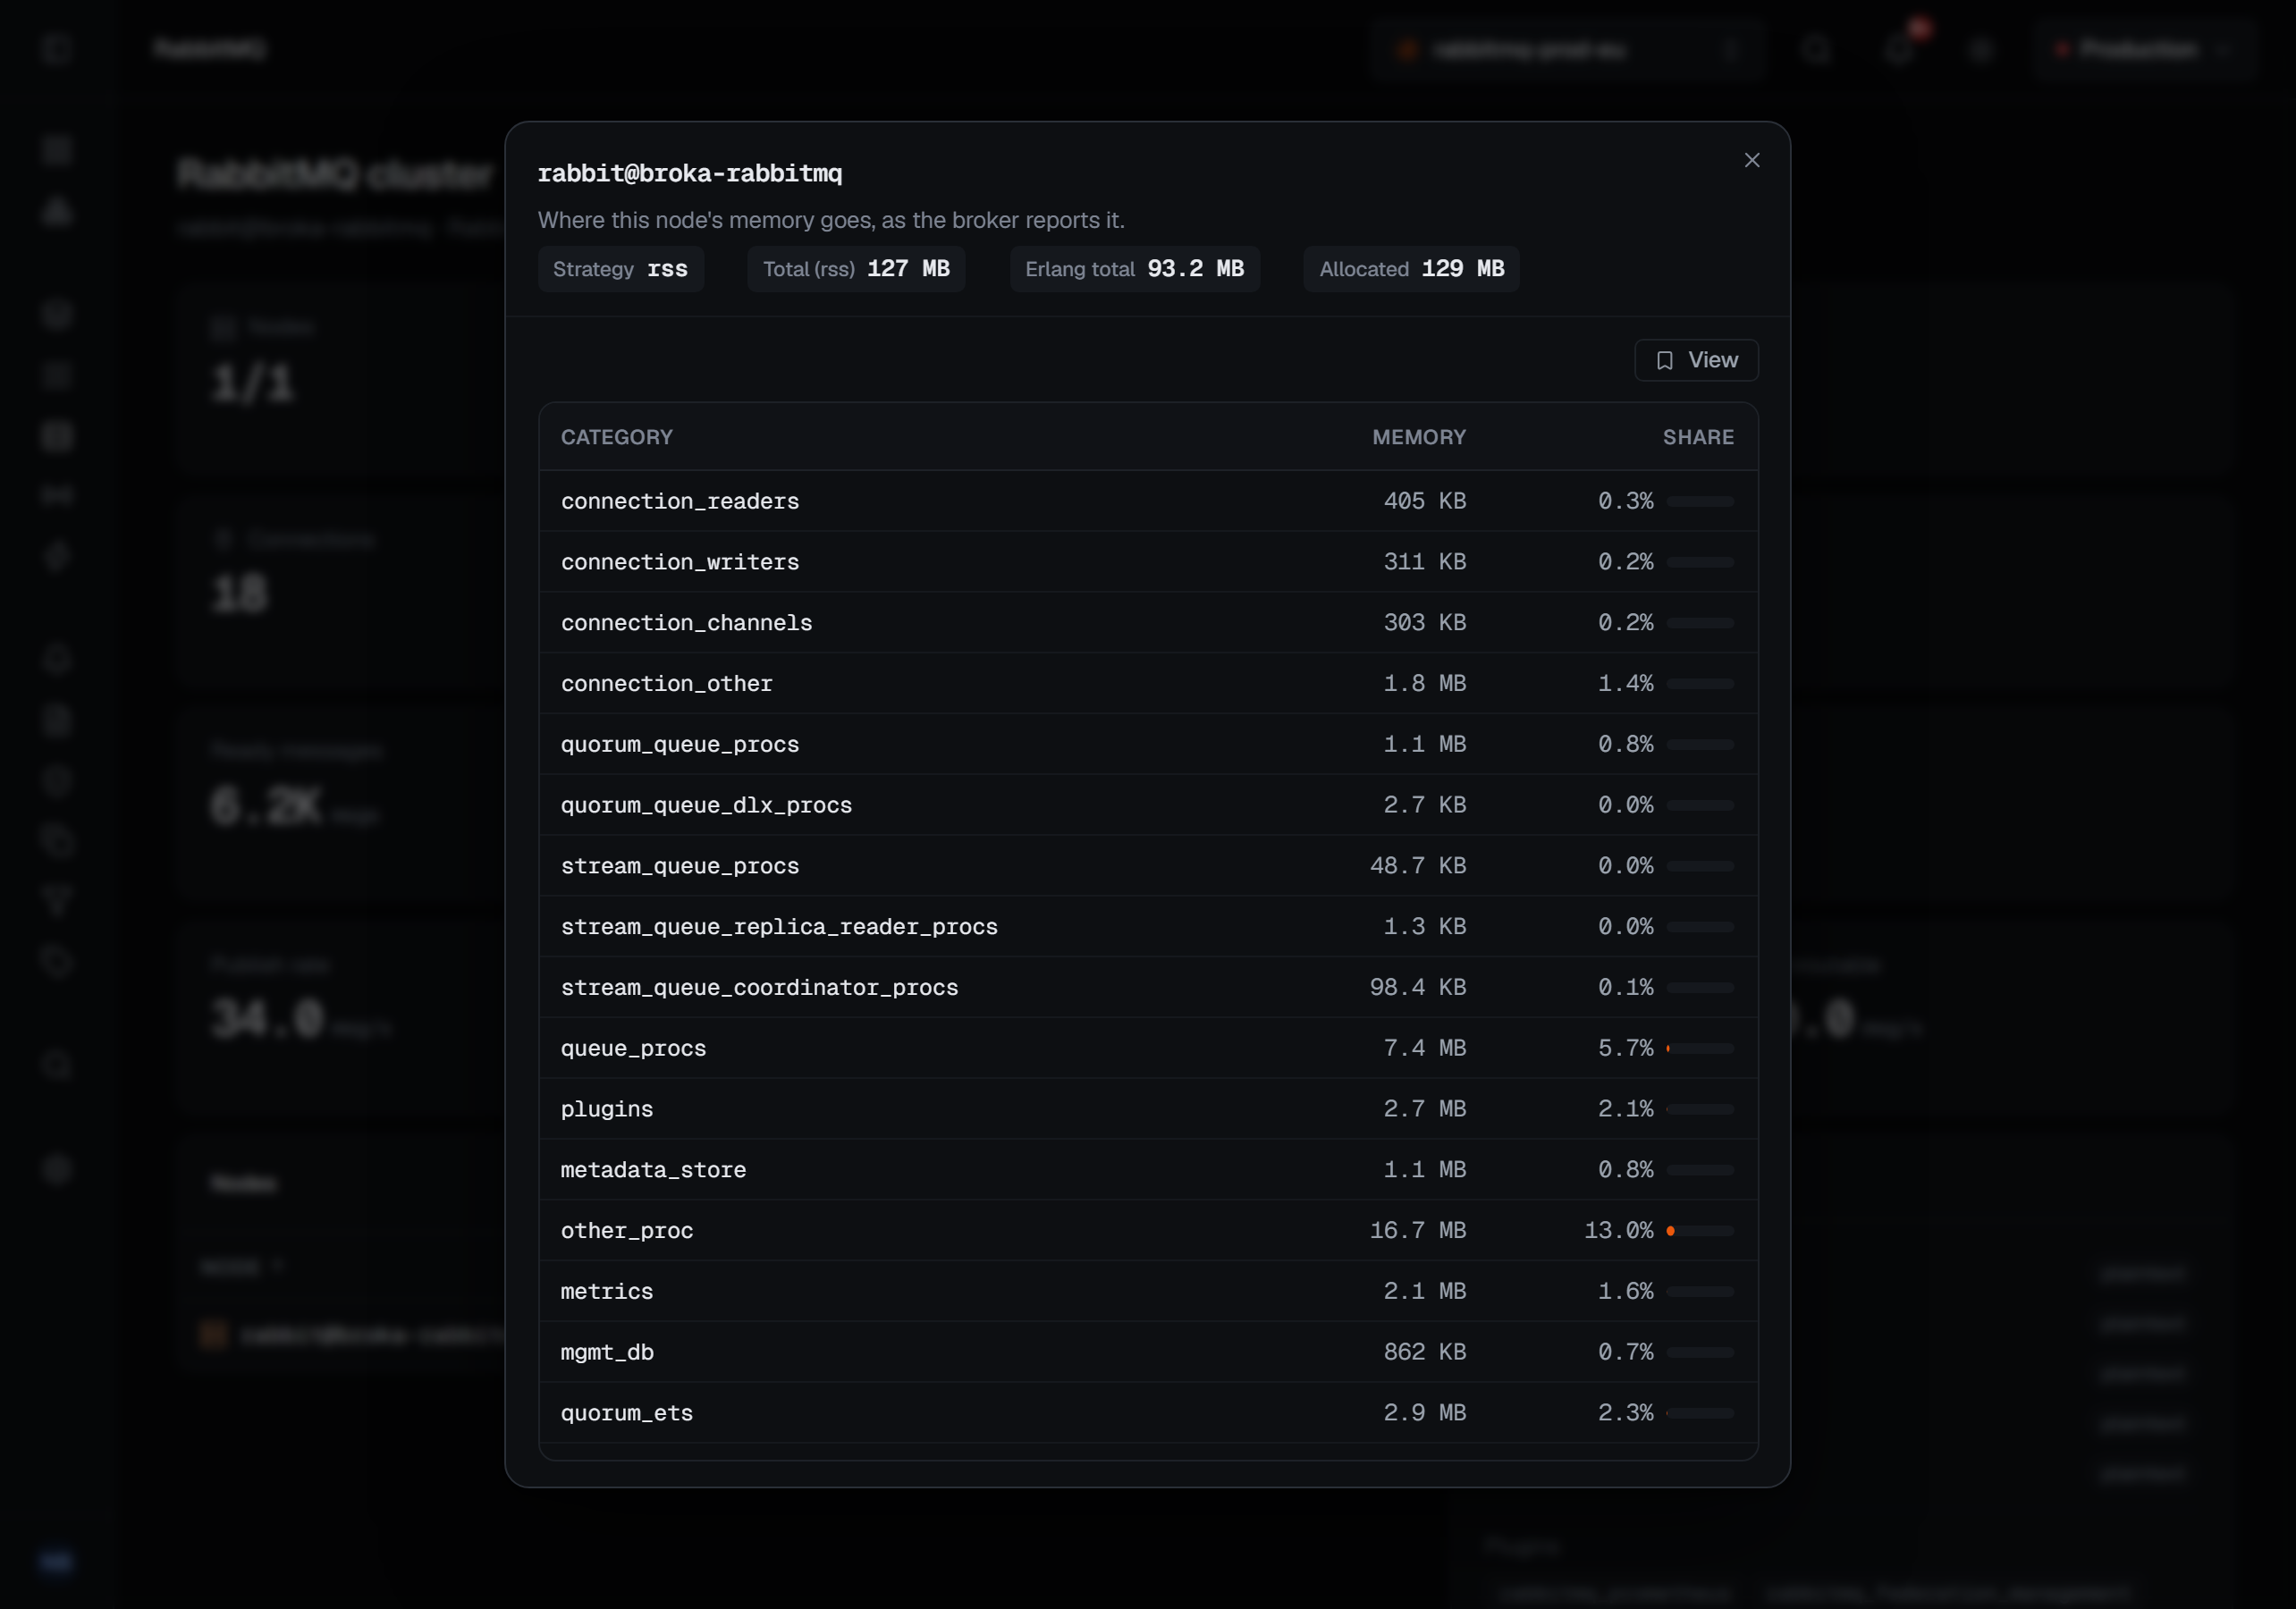
Each node row also has a menu that grows quorum queues onto that node or removes its replicas, and the header has Rebalance queue leaders — see Quorum replicas.
Churn
Below the message rates, seven cards count what is opening and closing, per second: Connections opened, Connections closed, Channels opened, Channels closed, Queues declared, Queues created and Queues deleted.
They answer the question the message rates never do. An application that opens a connection for every publish looks idle on every other card, and here it is the busiest thing on the cluster. Like the message rates, these cards appear only while the broker collects statistics.
Health checks
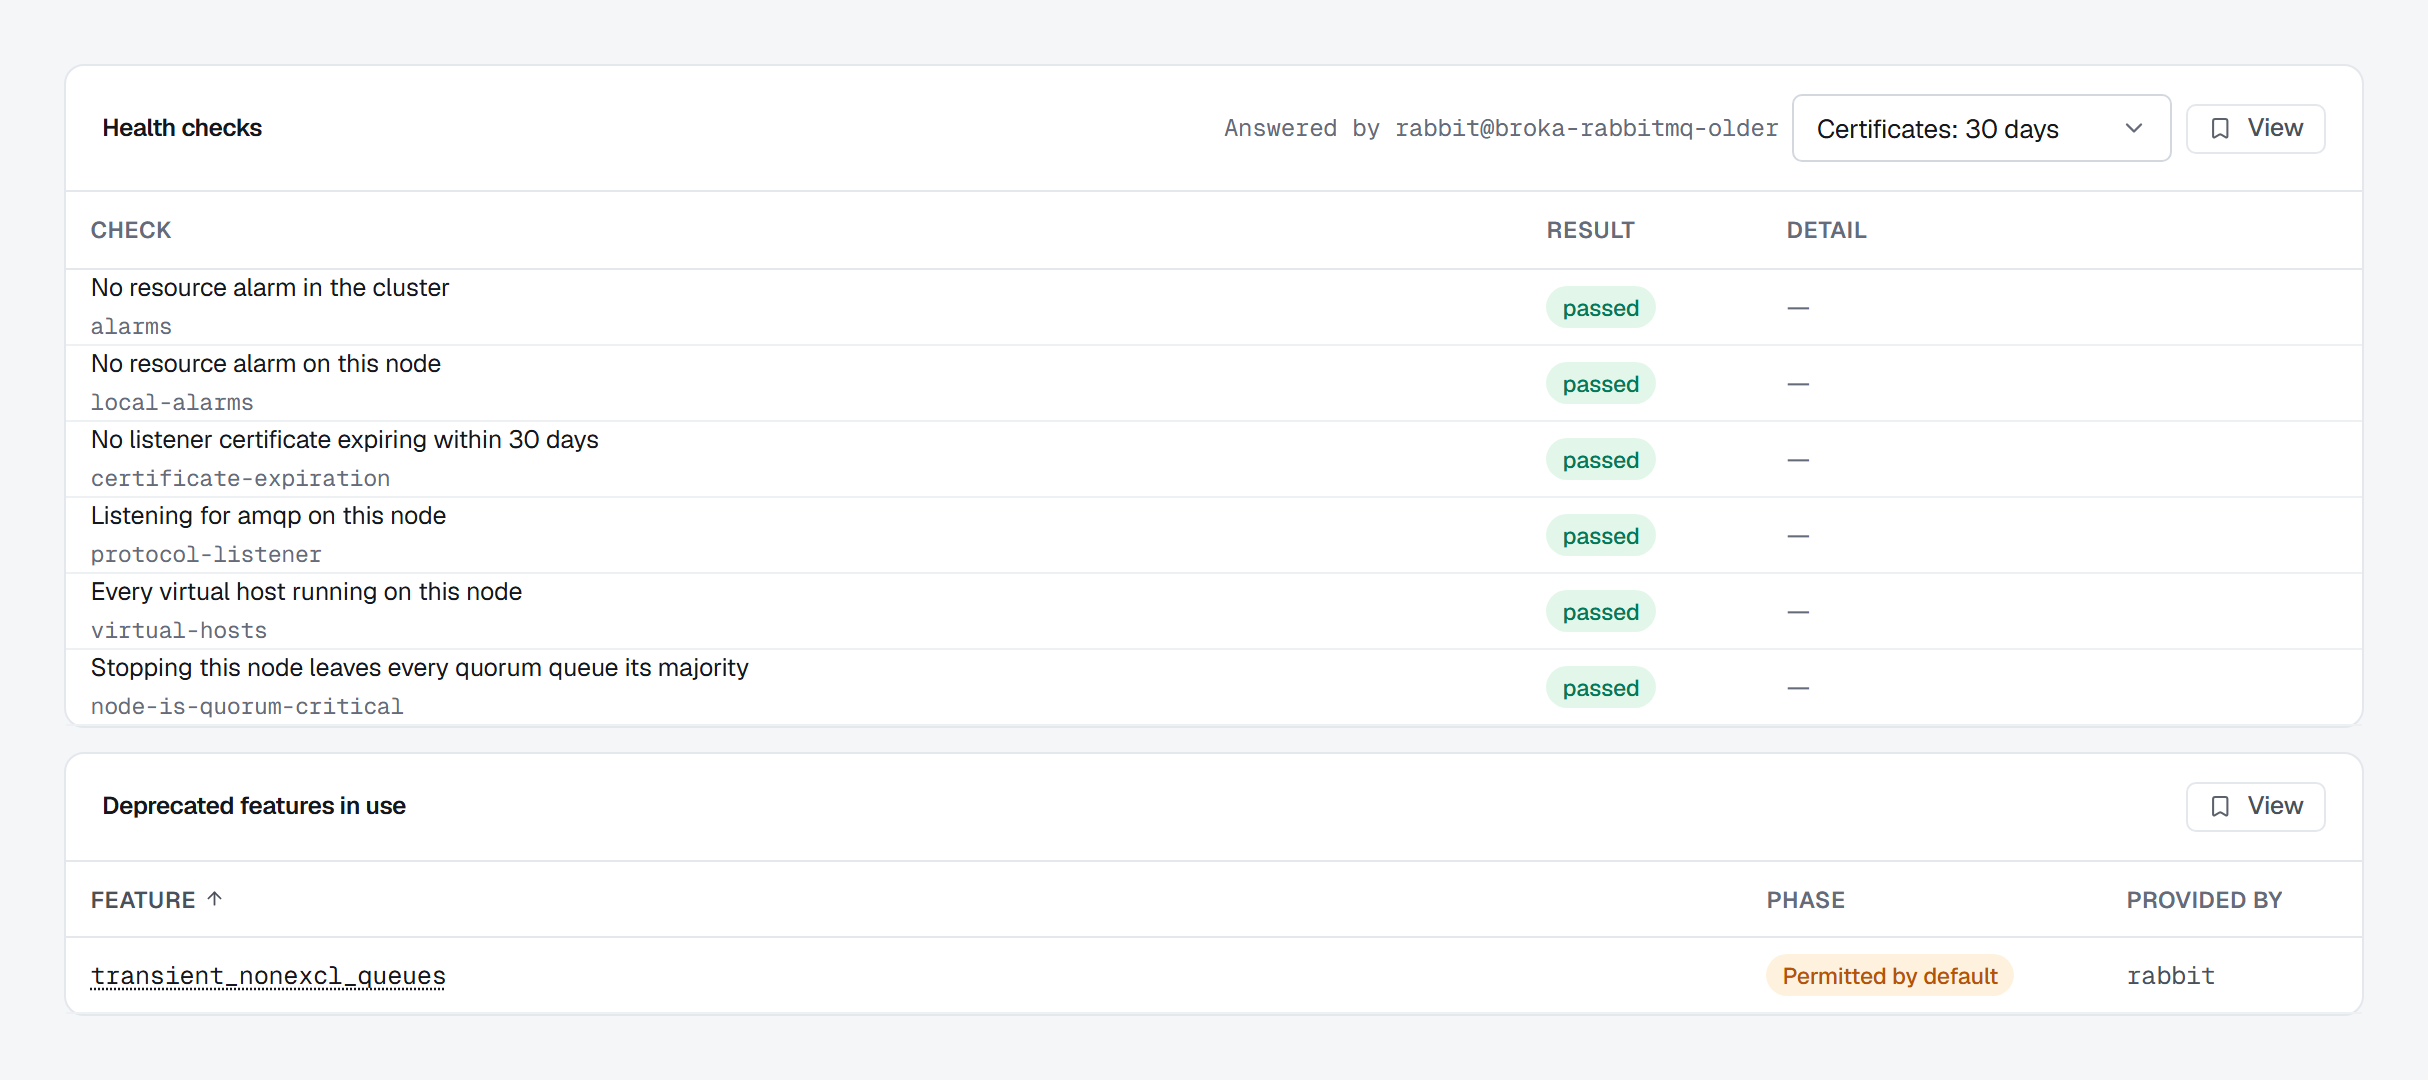
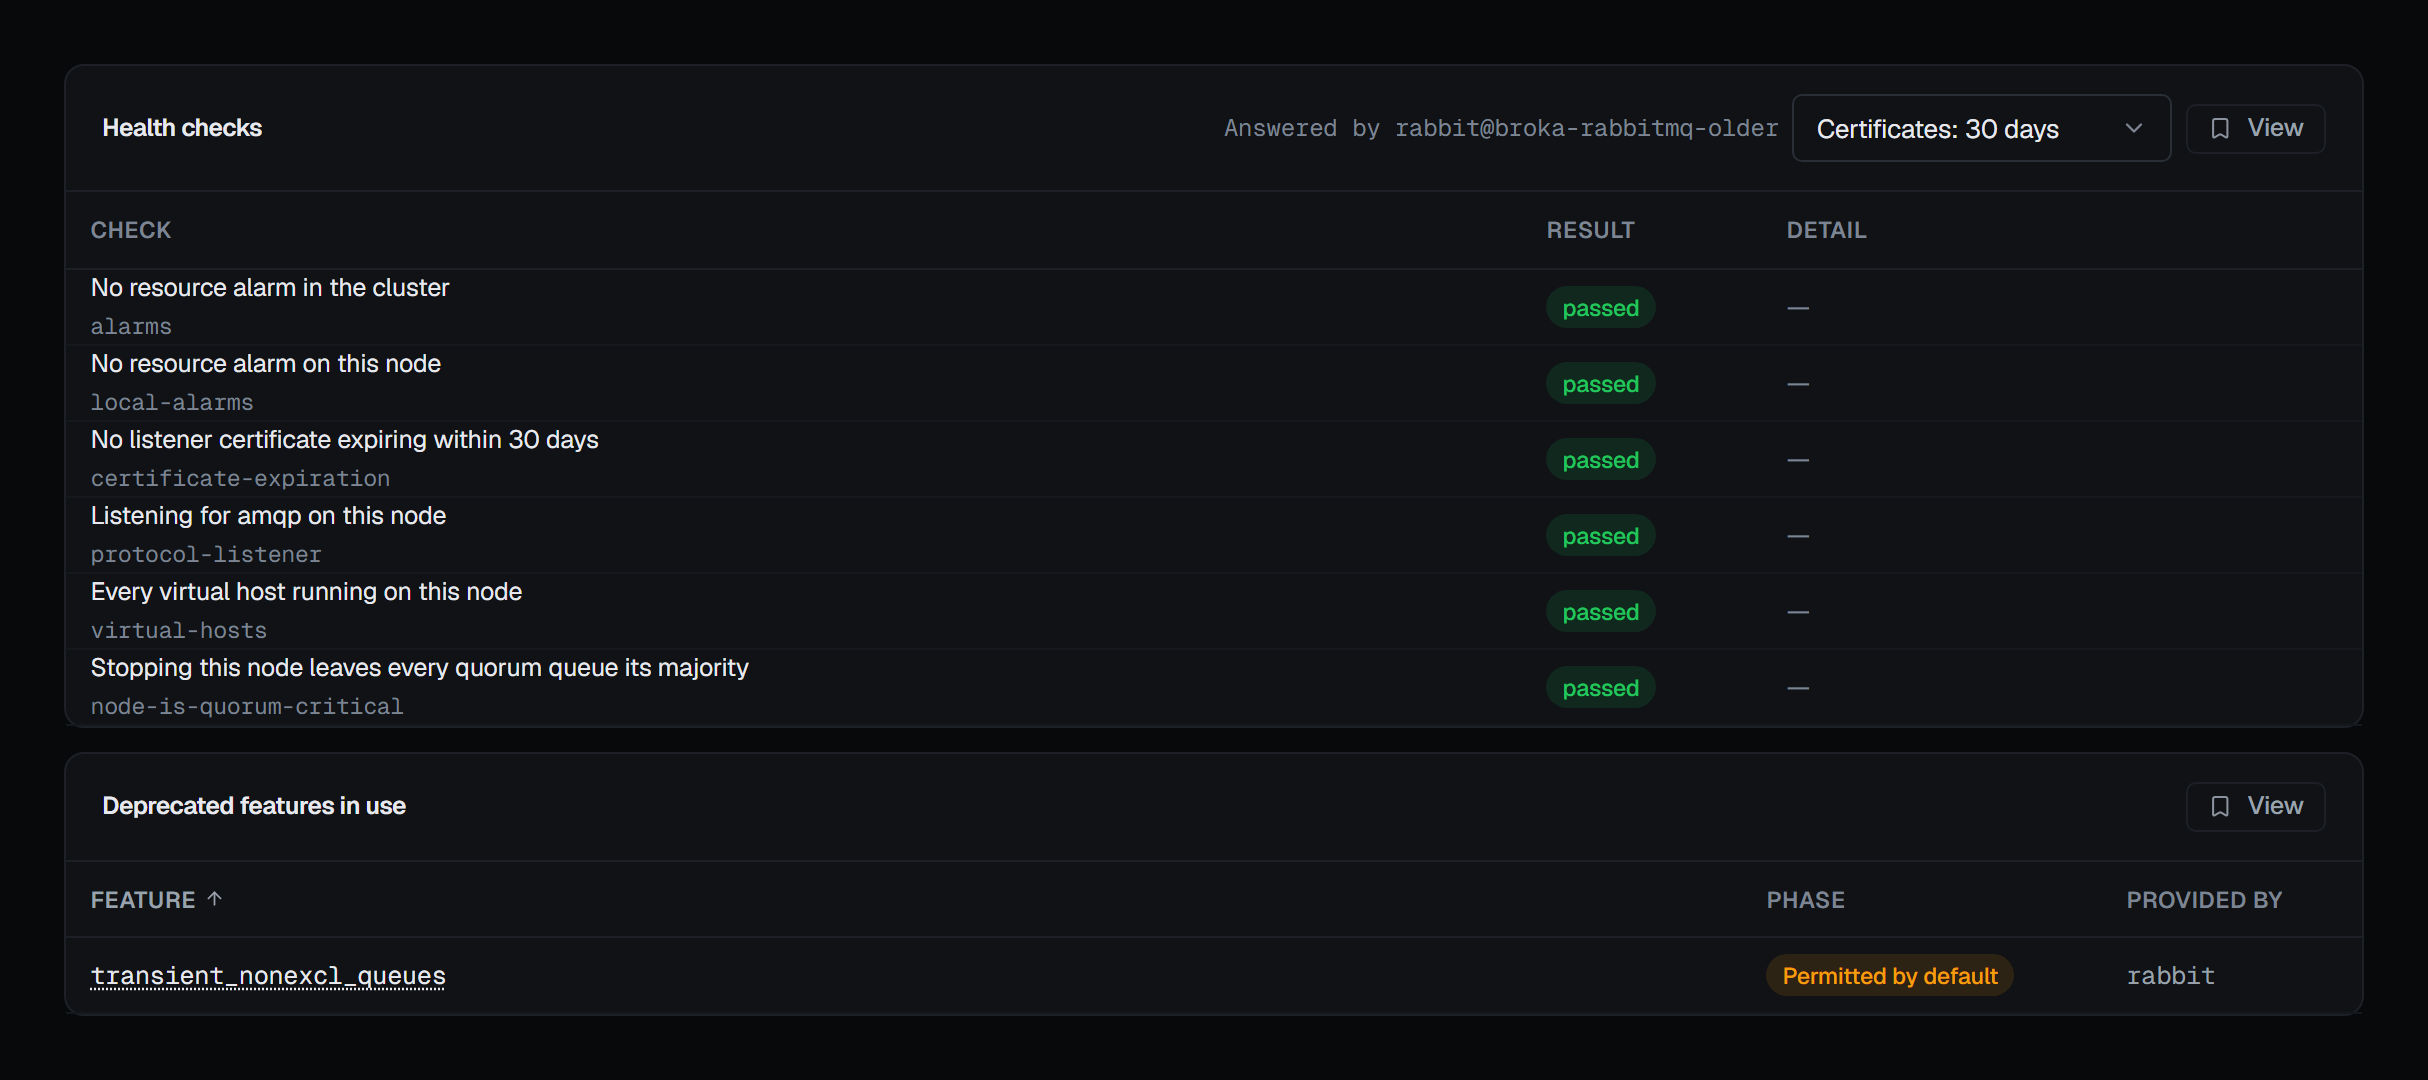
Below the nodes, the Health checks card runs the broker's own health checks and shows each verdict with the broker's reason:
- no resource alarm in the cluster, and none on this node;
- no listener certificate expiring within a window you choose — 7, 30 or 90 days, or a year;
- the node listening for AMQP;
- every virtual host running on the node;
- whether stopping this node would leave any quorum queue without its majority.
Each check reads passed, failed with what the broker found, or not available on a broker version that predates it — never a failure it did not report. The checks run on the node that serves the management API, and the card names it. The broker's port-listener check is left out on purpose: the port a connection reaches may be a load balancer's, not the node's. Certificate expiry and quorum criticality in particular are answers the rest of the management API does not give any other way.
Deprecated features in use
The last card lists the deprecated features the cluster is still using, each with its deprecation phase and what provides it — the list to clear before an upgrade that removes them. It is read-only: BROKA shows them and changes nothing. When nothing deprecated is in use, it says so.
What is listening, and what is installed
The listeners panel names each endpoint the broker is accepting on and whether it is TLS or plaintext — which is the fastest way to answer "is our AMQP port actually encrypted".
The plugin list is the union across nodes, and it is per-node underneath for a reason: a plugin enabled on some nodes and not others is a real and confusing cluster state, and a cluster-wide union alone would hide it.
When statistics are switched off
RabbitMQ can be run with its metrics collector disabled. In that state the broker does not report message rates, queue totals, node memory, resource alarms or the plugin list at all.
BROKA says so, in a banner, naming the setting to change — and it distinguishes the two cases everywhere it can: unknown, because statistics are off is not the same statement as none. A plugin list that is not being reported is not an empty plugin list.
Shovels, federation and streams do not depend on it. BROKA asks the broker which management plugins it serves — a list RabbitMQ reports whether or not statistics are collected — and offers each feature whose plugin is there. One whose management plugin is not enabled is shown as unavailable with the plugin it needs named; if even that list cannot be read, the feature is offered and RabbitMQ answers for itself.
A number BROKA did not receive is shown as —, with that as the reason, rather than as zero.
On a broker older than 4.0
BROKA is built against RabbitMQ 4.0 and verified on 4.3. On an older broker a banner names its version and says what differs — it accepts non-durable queues that 4.x refuses, runs Mnesia rather than Khepri so no queue can show a minority state, and may report no default queue type for a virtual host — so that behaviour is not read as a fault of the console. Everything else keeps working.