

Queue detail and message counters
Updated 29 September 2026 · applies to 1.0.0 · Commercial
Queue detail, opened from a row on the Queues screen, pauses, disables, purges or deletes one queue and shows its configuration and message counters. On an Apache Artemis (formerly ActiveMQ Artemis) queue it lands on Messages, because that is what someone opening a queue came for — that tab has its own page, Message operations. Beside it: Overview, the queue's full configuration; Scheduled and In flight, the two kinds of message a browse cannot show; Groups, the message groups pinned to a consumer; and Counters, the only trend in this console drawn from history the broker kept itself.
Pause and Disable are different, and never share a control
This is the distinction the screen is built around.
| What it does | What arrives while it is on | |
|---|---|---|
| Pause | Stops handing messages out | Keeps arriving and accumulating |
| Disable | Stops being a routing target | Nothing. Messages sent to the address reach the other queues bound there — or nowhere |
Putting them behind one switch would make the second look like the first, which is how a queue silently stops receiving. So they are two buttons, disabling asks for confirmation, and the confirmation says in as many words that this is not the same as pausing. Pause is not confirmed: Resume on the same button undoes it, and Enable undoes a disable the same way.
A disabled queue also carries a banner on the page for as long as it stays disabled. What it already holds stays either way.
Purge does not dead-letter
Purge discards every message in the queue immediately. They are not sent to the dead-letter address — they are gone. The confirmation names the dead-letter address the queue would otherwise use and says the messages will not reach it, and it counts what will be discarded.
Delete destroys the queue and everything in it, and disconnects its consumers: the broker refuses the delete otherwise, so the console does it rather than presenting a failure.
Purge and Delete ask for a reason. Every one of these is a write, recorded in the audit trail, and the buttons appear only for someone allowed to change this broker — in a read-only environment or on a read-only connection they are not there and the page says why.
Editing, and the messages the broker holds back
Edit, in the header, changes the queue's settings; the dialog, field by field, is on Editing a queue. The Scheduled, In flight and Groups tabs have a page of their own: Scheduled, in-flight and grouped messages.
Overview: how old the backlog is
The Overview opens with the queue's live counts — messages, consumers, delivering and scheduled — and the Oldest message: how long the message at the head of the queue, the next one it will deliver, has waited, by the broker's own clock. A count says how much is waiting; this says how long, and it is usually the first figure to move when a consumer falls behind. It reads a dash when nothing is waiting, or when the message at the head carries no timestamp, and hovering the dash says which. The same age is available as an alert metric, so a rule can fire on how long messages wait rather than on how many there are — see Alerts.
Overview: four cards, four questions
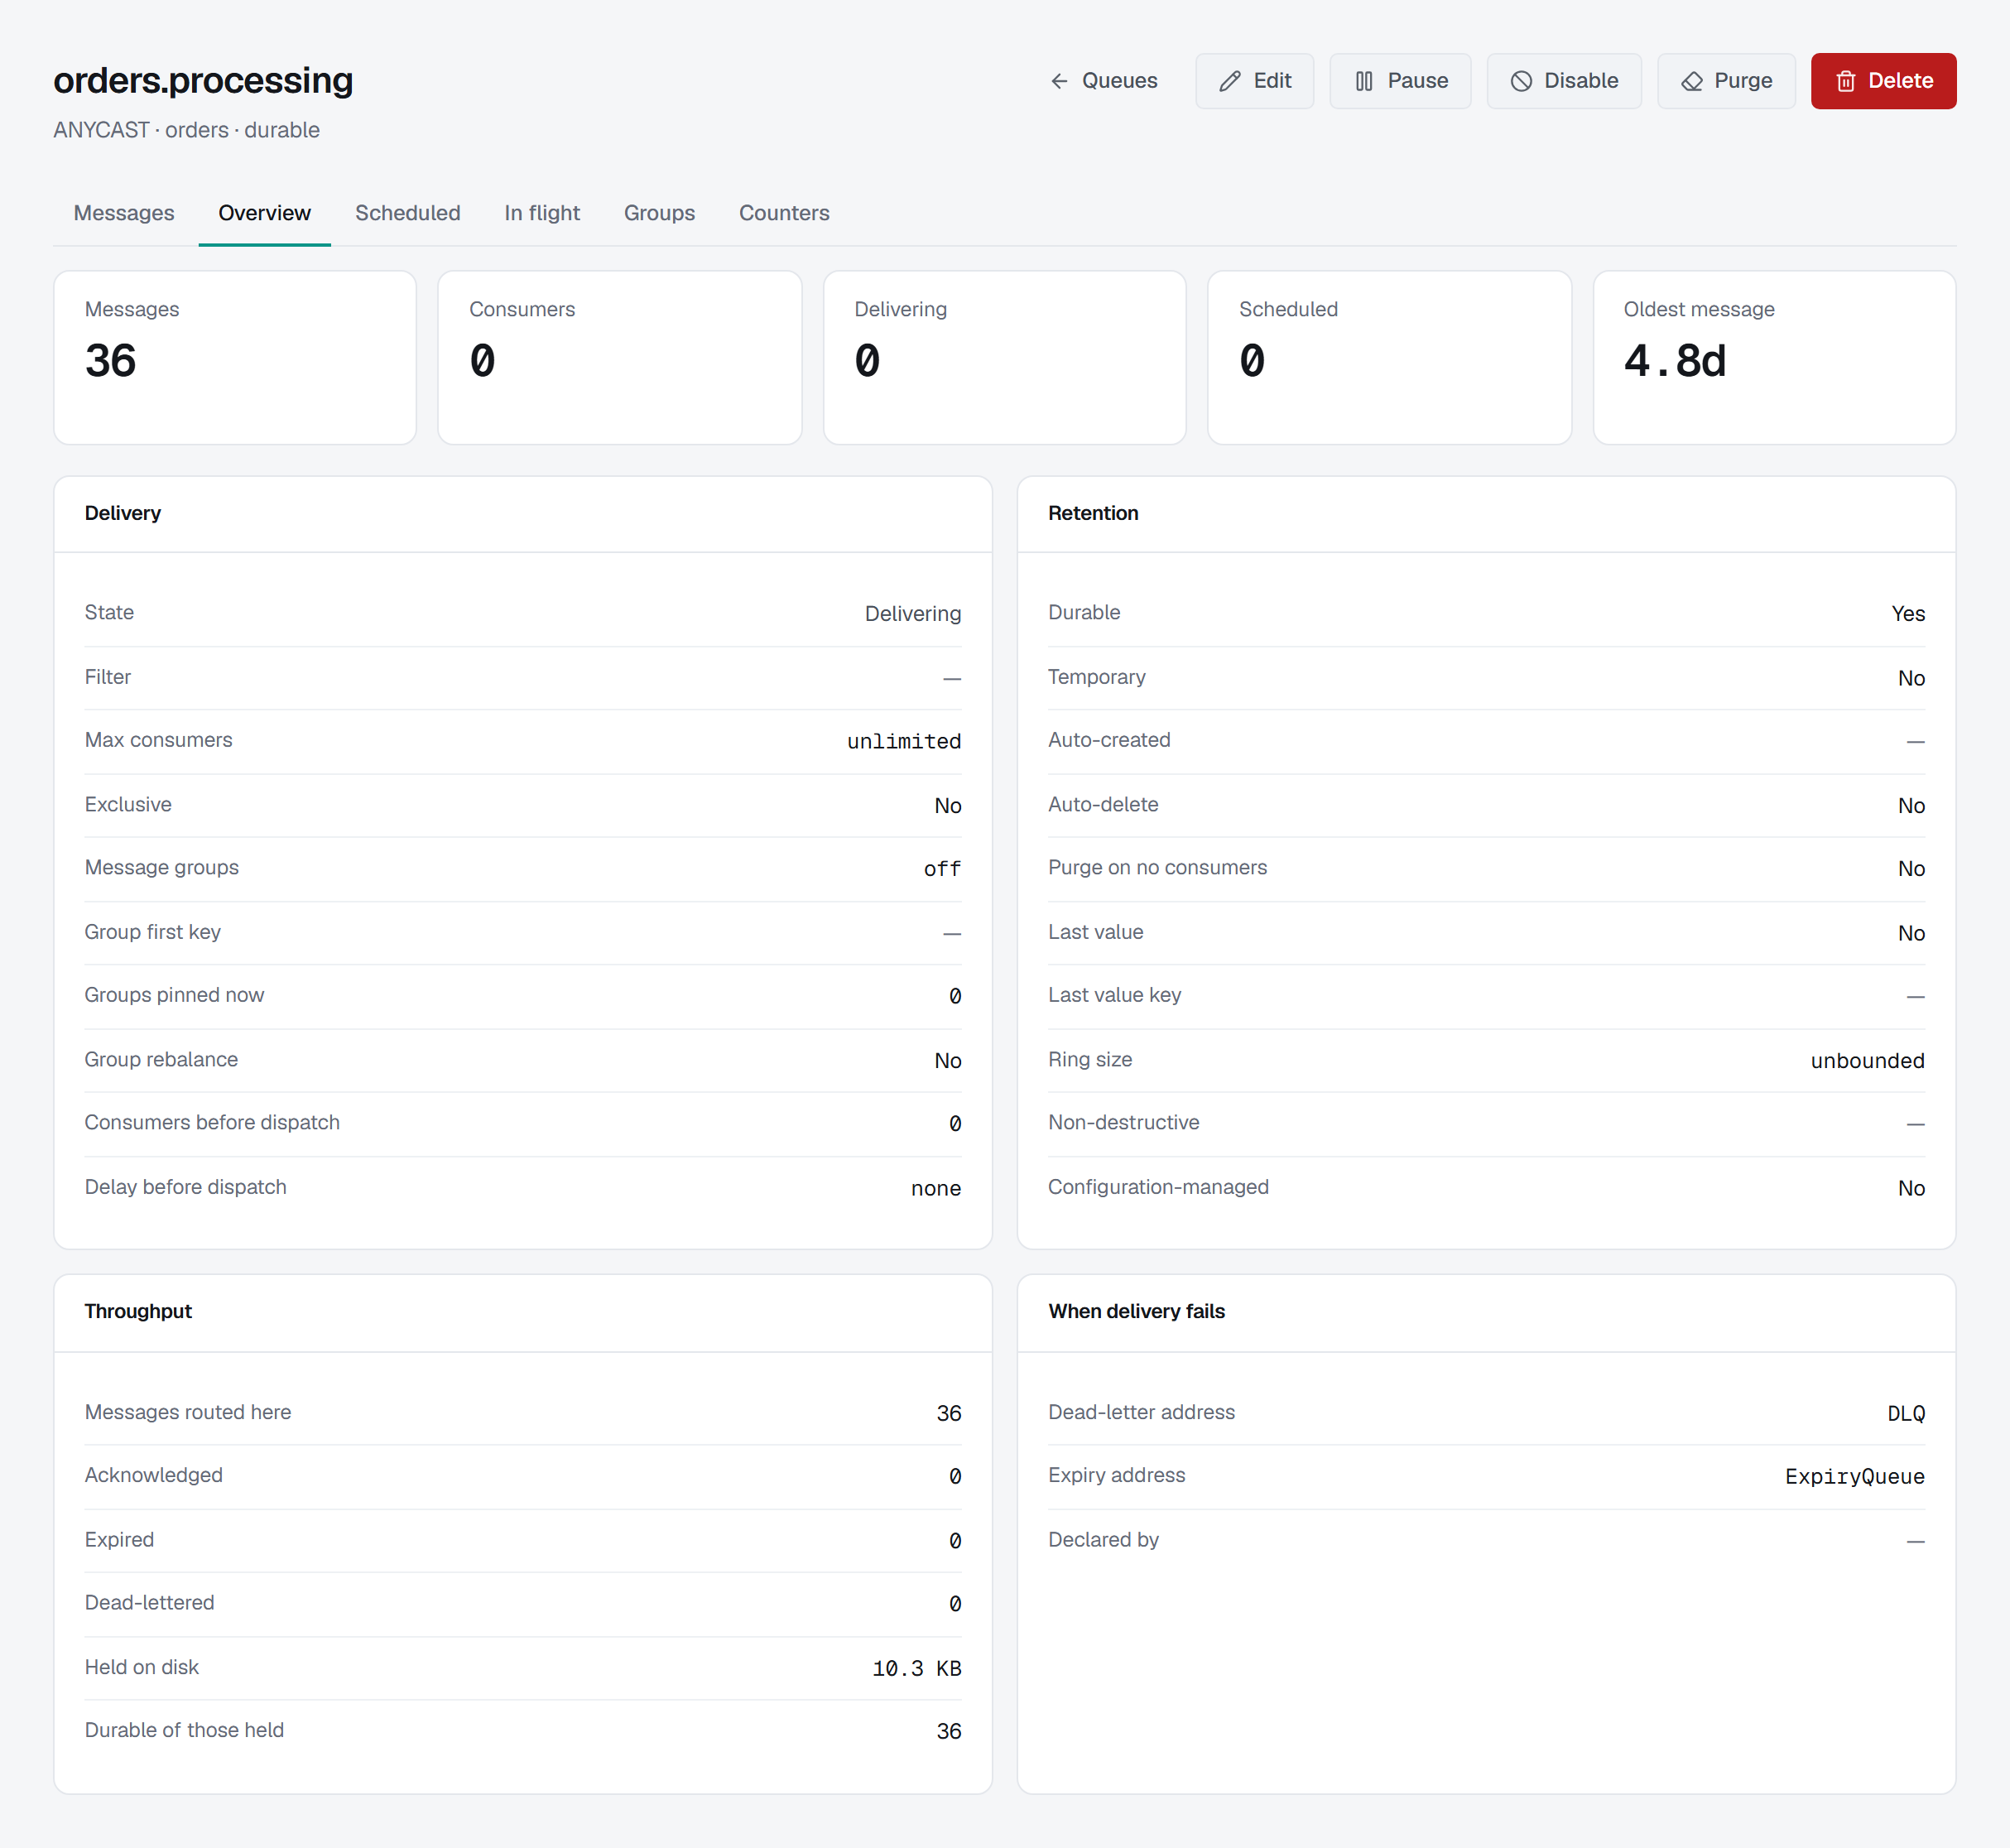
Delivery — is it delivering, and on what terms. Its state (delivering, paused or disabled), the filter it applies (or a dash meaning it takes everything routed to it), its consumer limit, whether it is exclusive, message-group buckets and key, how many groups are pinned now and whether they rebalance when a consumer attaches, and the consumer count and delay it waits for before dispatching at all.
Retention — what survives. Durable or lost on restart, temporary, auto-created by a client or by an operator, auto-delete, purge-on-no-consumers, last-value key, ring size, whether it is non-destructive — that is, whether consumers read without removing — and whether it is configuration-managed, so that a configuration reload puts it back as the file says.
Throughput — messages routed here, acknowledged, expired, dead-lettered, the bytes held on disk, and how many of what it holds are durable.
When delivery fails — the dead-letter address, the expiry address, and who declared the queue.
Values that are only meaningful as words are shown as words: -1 max consumers reads unlimited,
-1 ring size reads unbounded, -1 group buckets reads off, and a negative dispatch delay reads
none. Anything the broker did not report is a dash.
Counters: a chart of what the broker recorded, not of what the page watched
Artemis samples every queue on its own period and keeps a day-by-day record of what arrived. Of the platforms in this console it is the only one that does this, which is why this is the only trend BROKA draws — a line built from a buffer the console filled while somebody happened to have a tab open would be a chart of how long the tab was left open.
The chart shows messages added per hour across the broker's whole retained history. Above it, when counters are on: total added, added in the last sample, depth at the last sample, and the change in depth.
Underneath, what the broker says about its own sampling: whether counters are on and on what period (on, every 10 seconds), when it last sampled, when a message was last added and last acknowledged, and how many days of history it retains. So "the last sample" is a length of time rather than an unknown.
Two of those figures are easy to misread, and the tab says so where they are:
- Added is cumulative since the counter started, not since the broker did — it goes back to zero when somebody resets the counters.
- Depth at last sample is what the queue held when the broker last looked, which is not the live depth on the Overview tab.
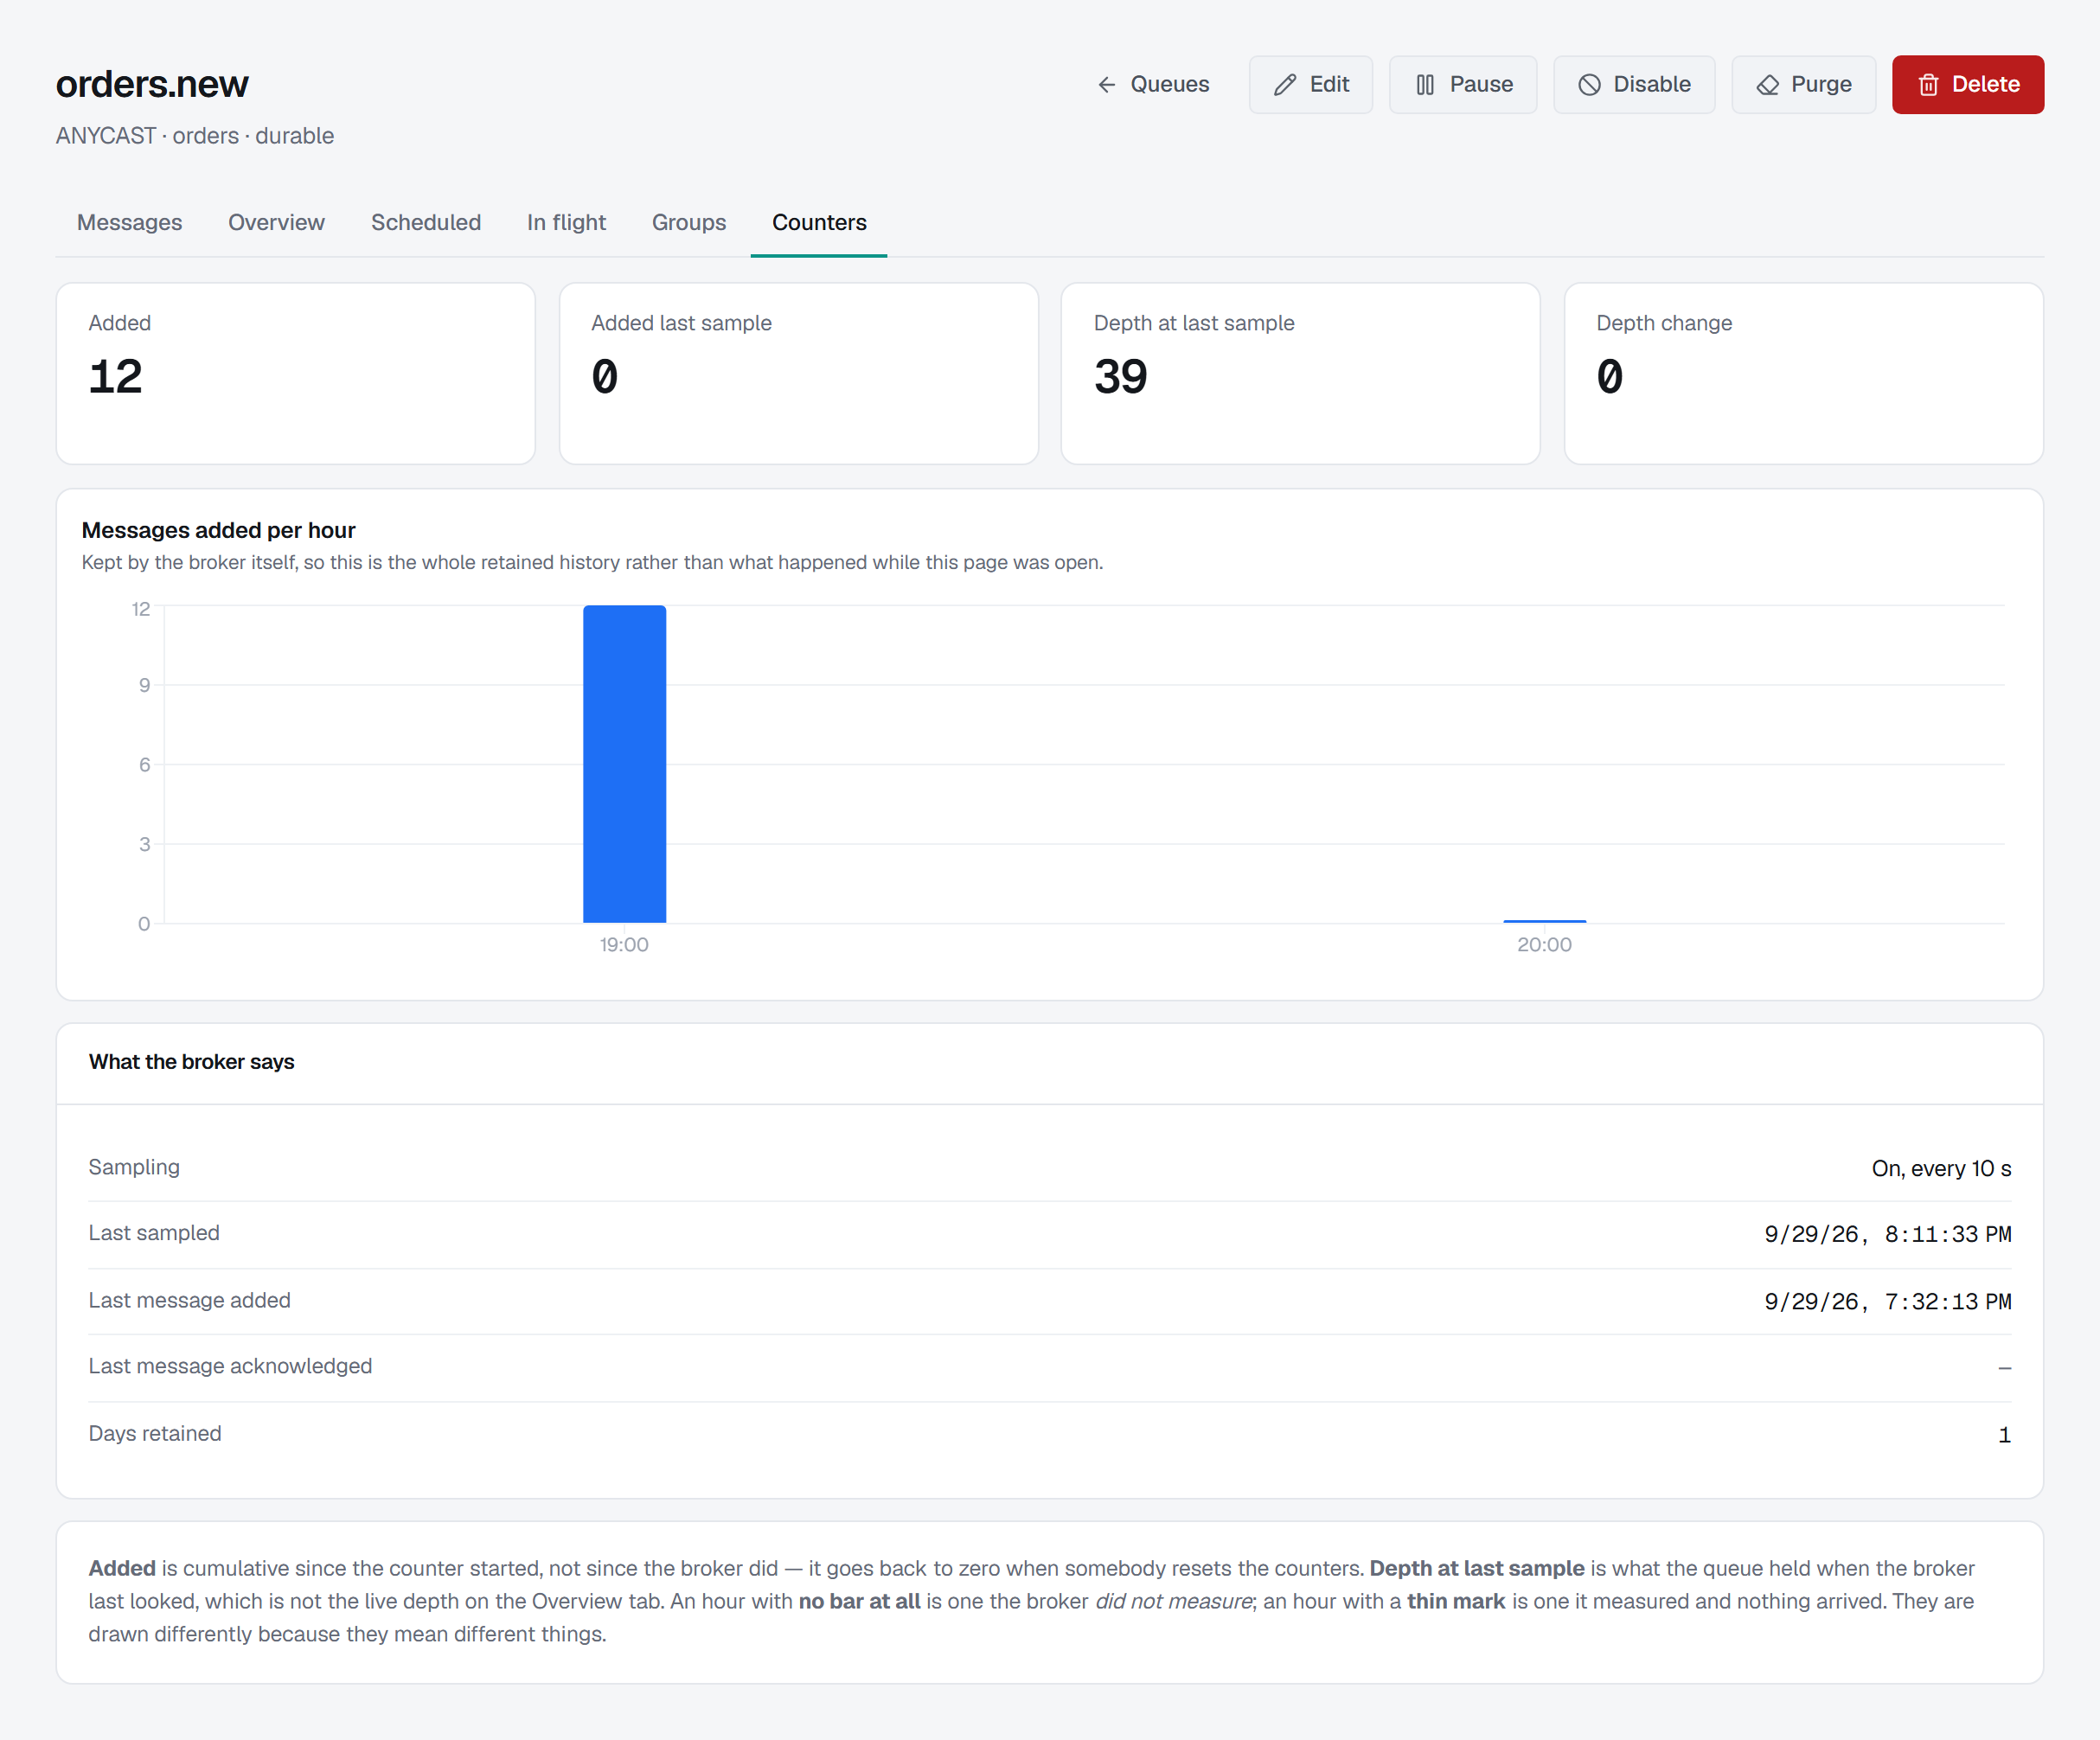
An unmeasured hour and a measured zero are drawn differently. Artemis writes -1 for an hour it
has no figure for — every hour before sampling began, and every hour that has not happened yet — and
0 for a measured hour in which nothing arrived. An unmeasured hour draws nothing. A measured zero
draws a two-pixel mark: enough to see that it was measured, too little to read as a quantity.
Unmeasured hours at each end of the history are trimmed, so a broker whose counters were switched on this morning does not draw one hour of data in the last fraction of a ten-day axis. Nothing measured is ever dropped, including a measured zero.
When counters are switched off, nothing is drawn
With sampling disabled the broker still answers — reporting 0 added and 0 deep for a queue holding sixty messages. Those zeros are indistinguishable from real ones.
So the tab does not read them and guess. It asks the broker whether counters are enabled, and if they are not it hides the figures entirely and says so, with a link to switch them on under Broker ▸ Maintenance. Sampling starts from that moment; it does not fill in the time they were off. Any history retained from when they were last on is still charted, and labelled as exactly that.