

Brokers
Updated 6 October 2026 · applies to 1.0.1 · Community and Commercial
Brokers, under Kafka in the sidebar, lists every broker of a cluster with its load, its disks and its effective configuration. It answers the questions you ask about a Kafka cluster when something feels wrong: is the load even, is one broker holding far more than its share, is every broker actually configured the way you think it is.
The list
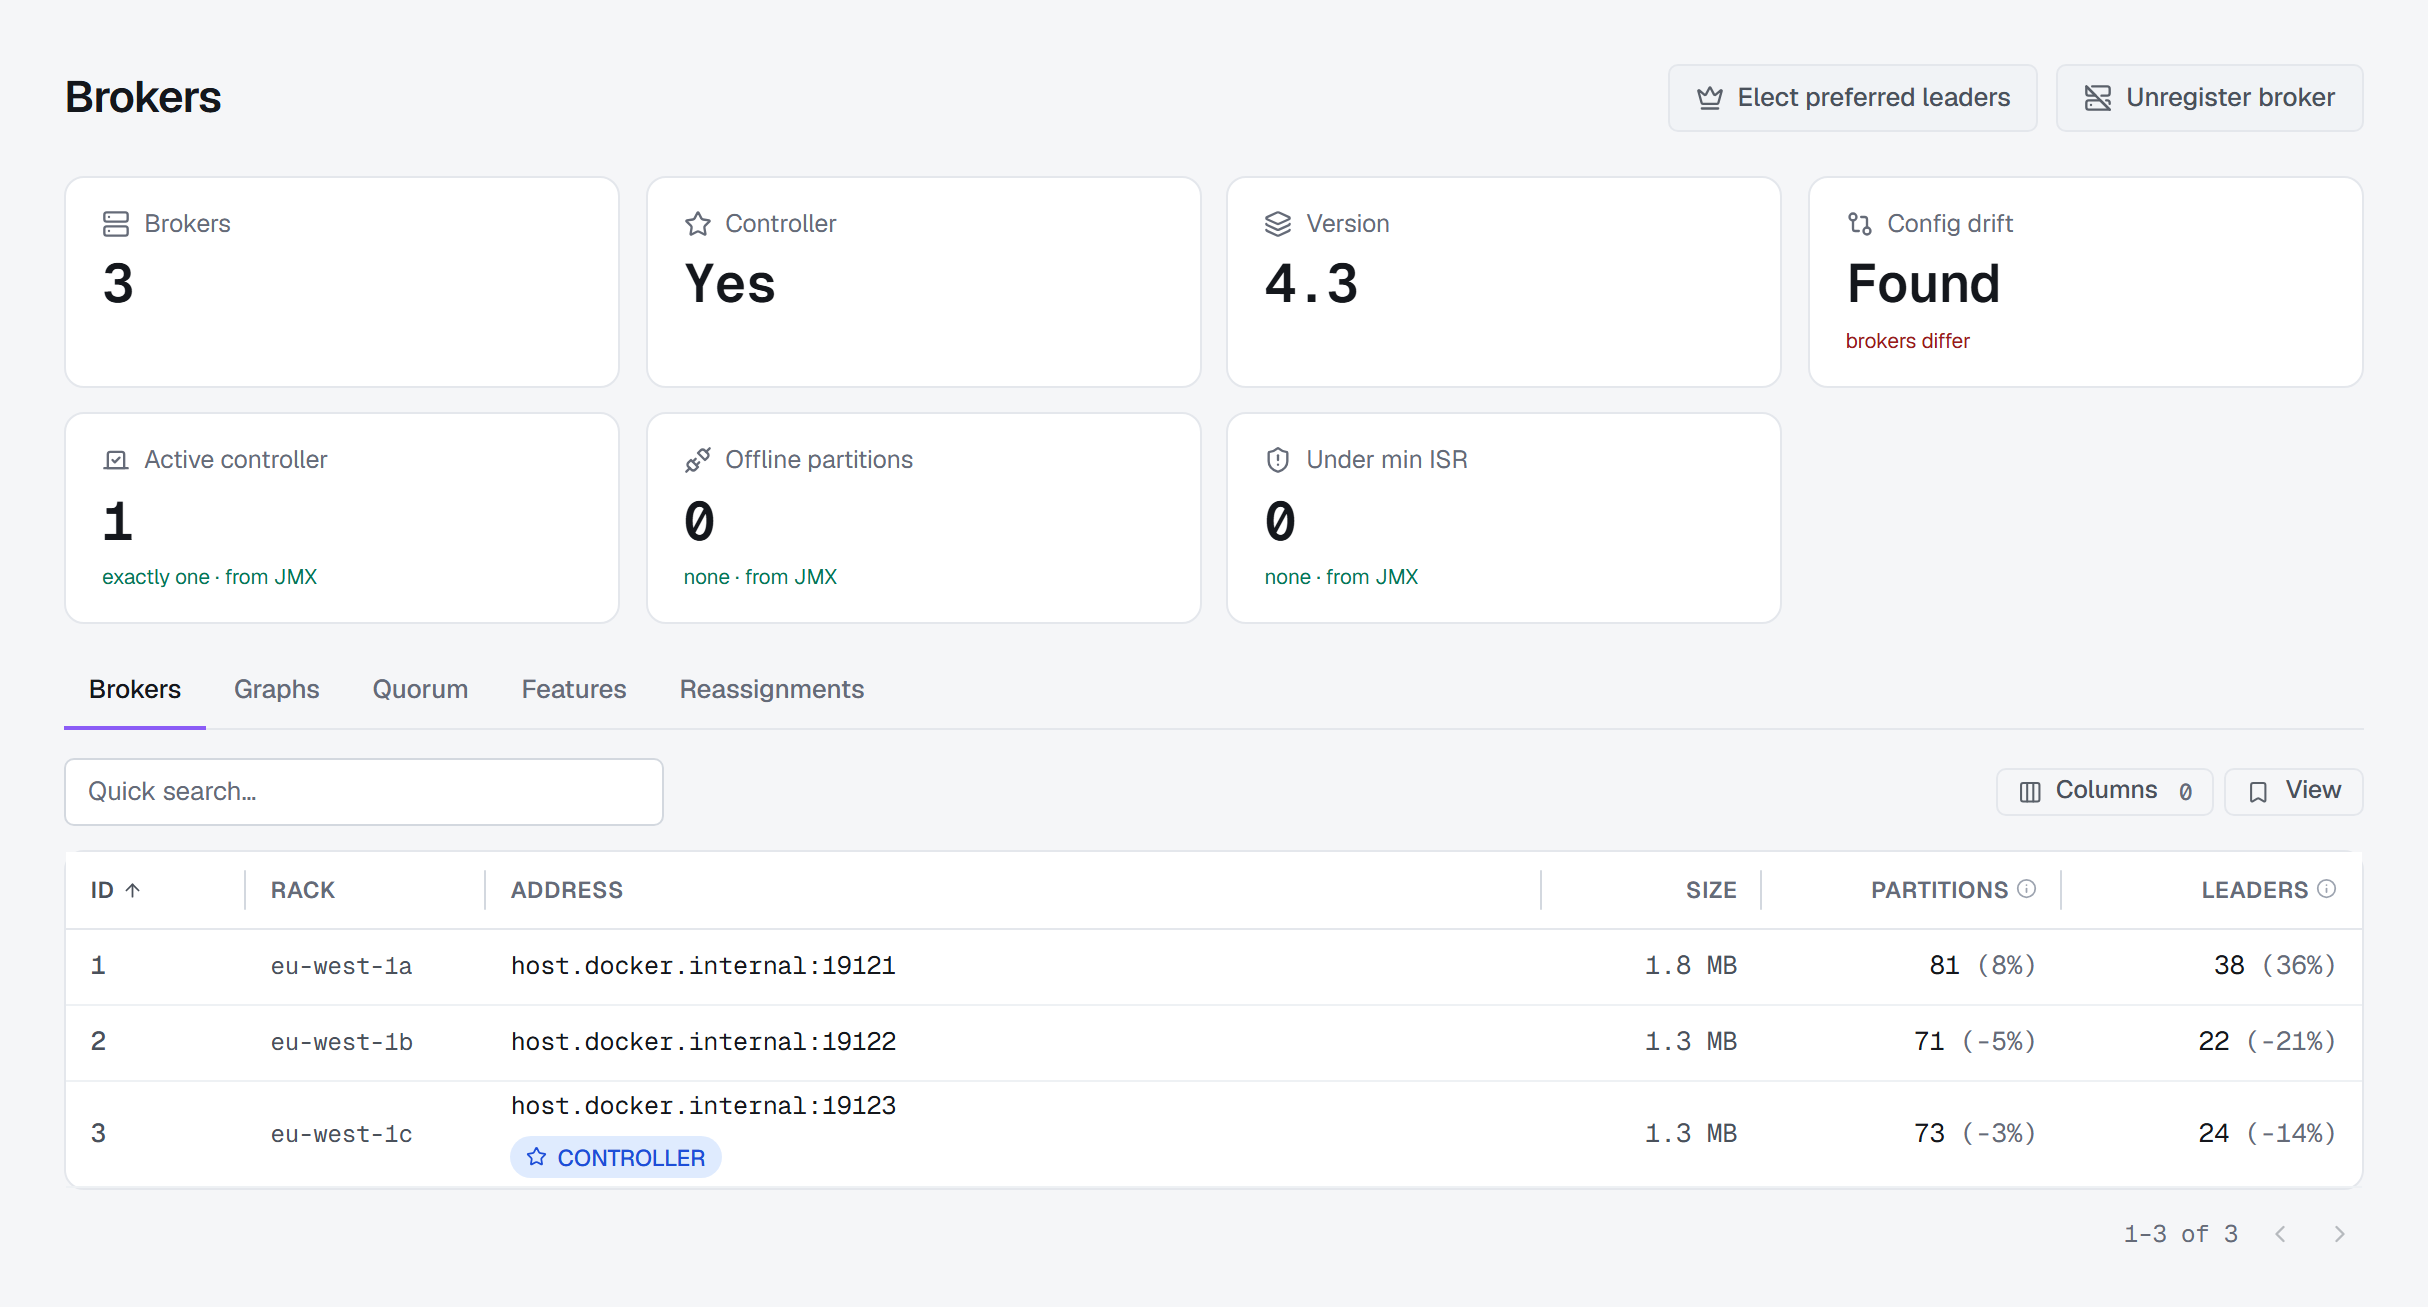
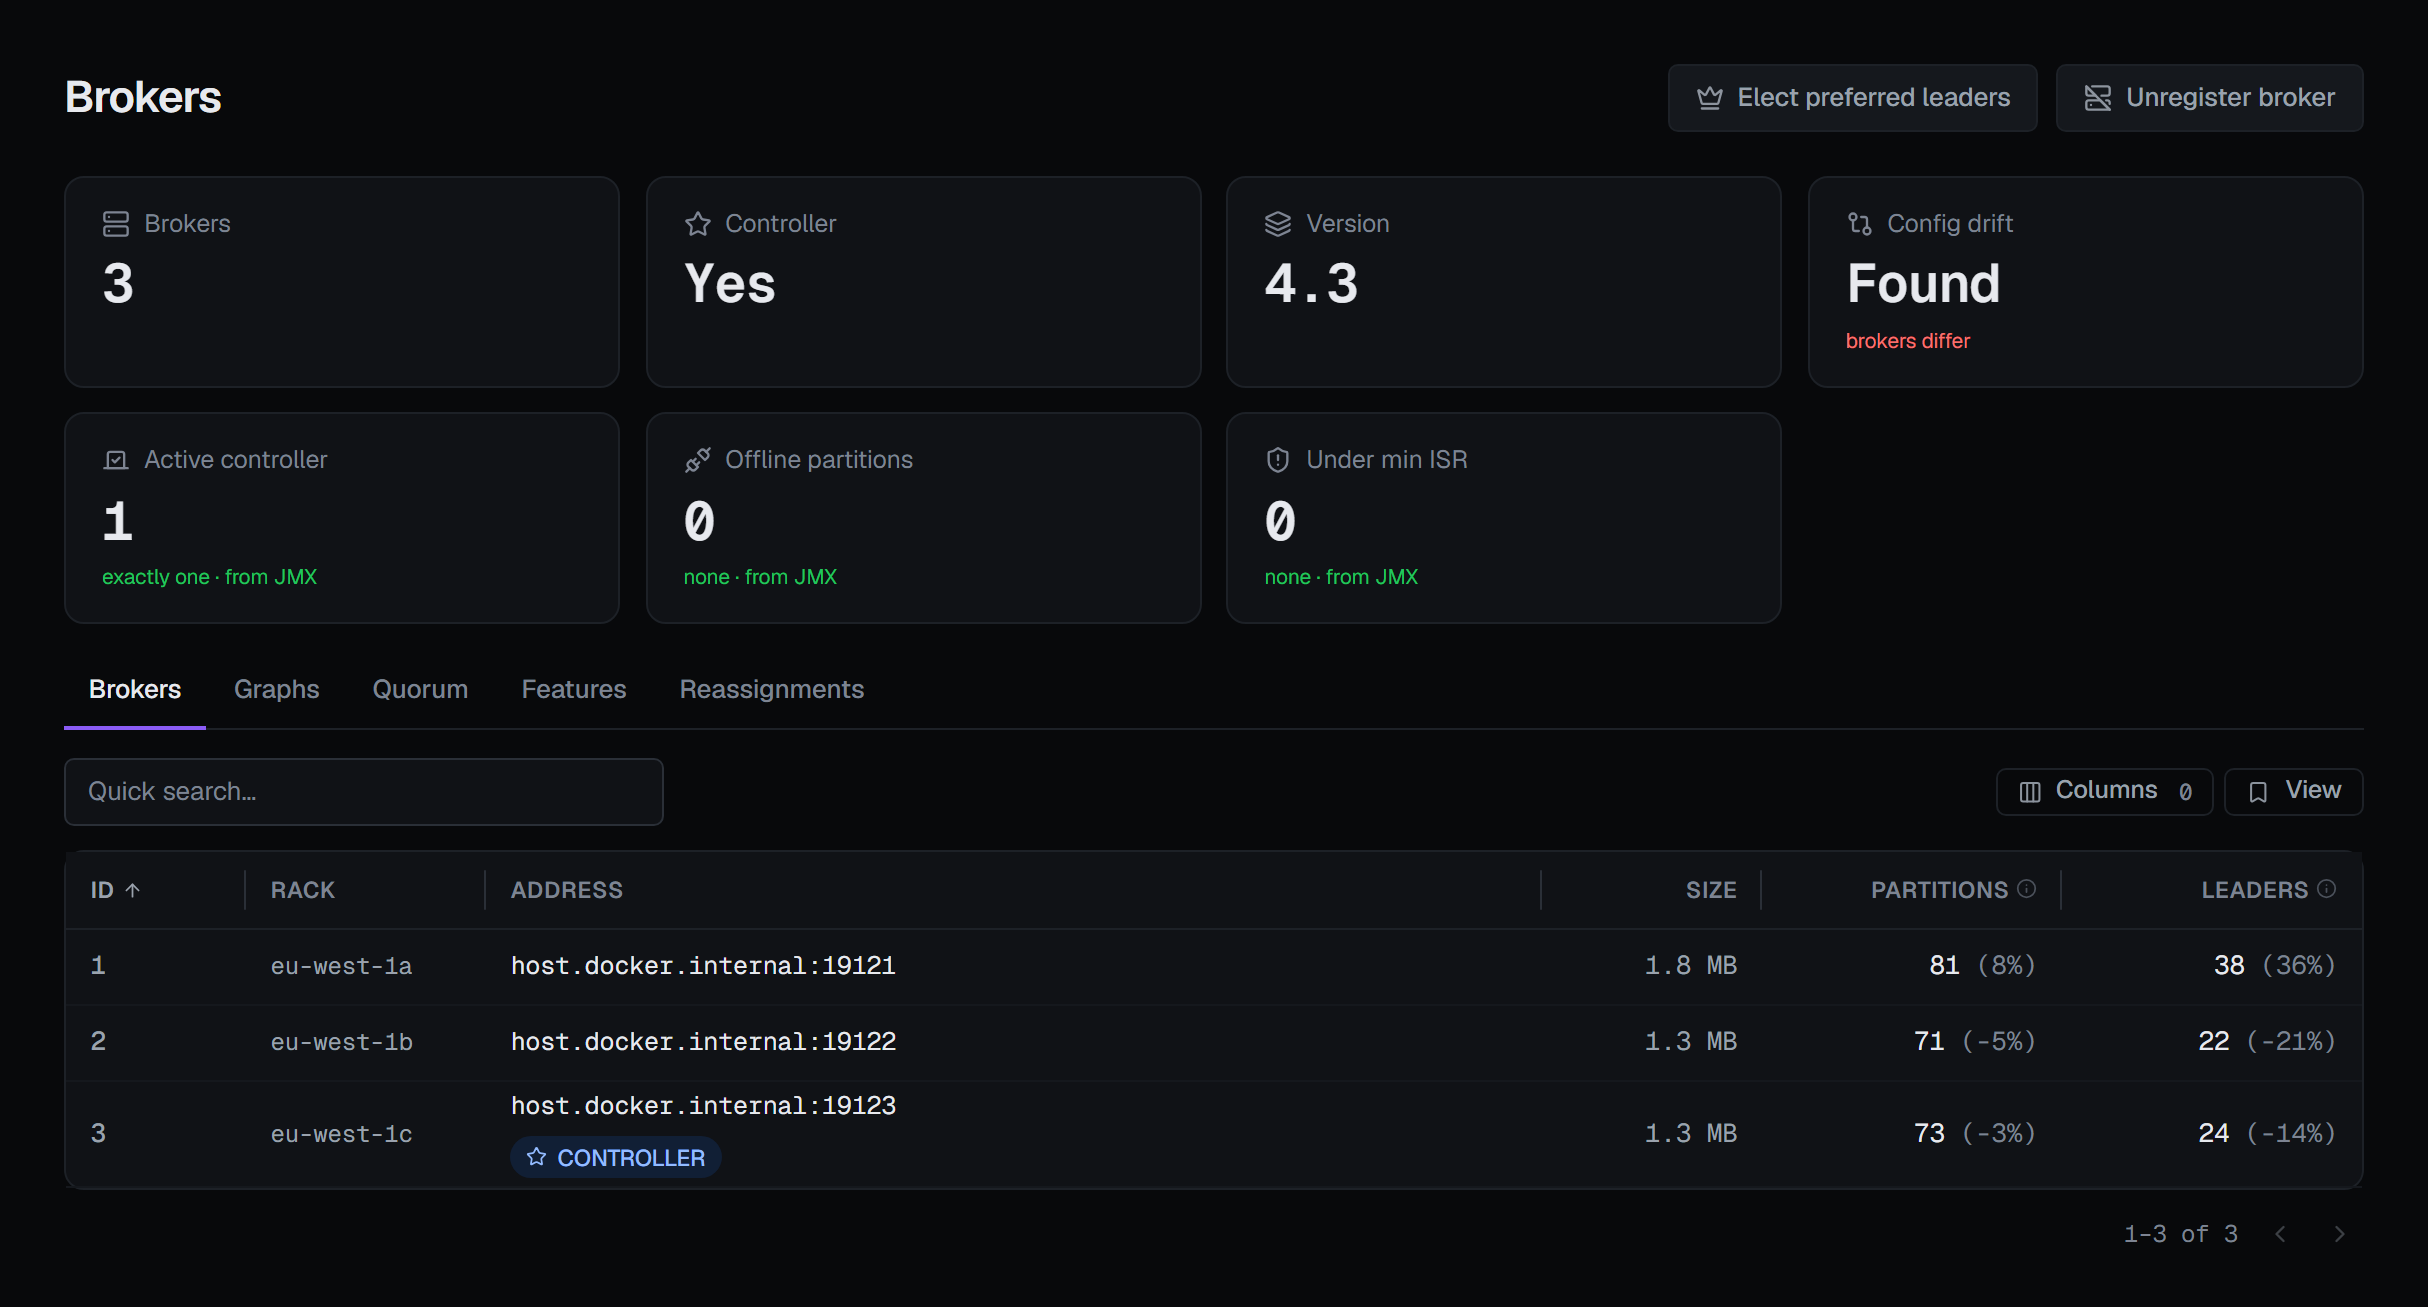
Each broker shows its id, rack, address, on-disk size, and the number of partitions it holds and partitions it leads. Beside those last two is a signed skew percentage against the cluster average — the number that turns "broker 3 has 412 partitions" into "broker 3 is carrying 38% more than its share". Zero means balanced; the header explains the formula it used. With only one broker whose count is known there is nothing to compare against, and the percentage is left off. The remedies for a skew — moving partitions and electing preferred leaders — are on Reassignments and leader election.
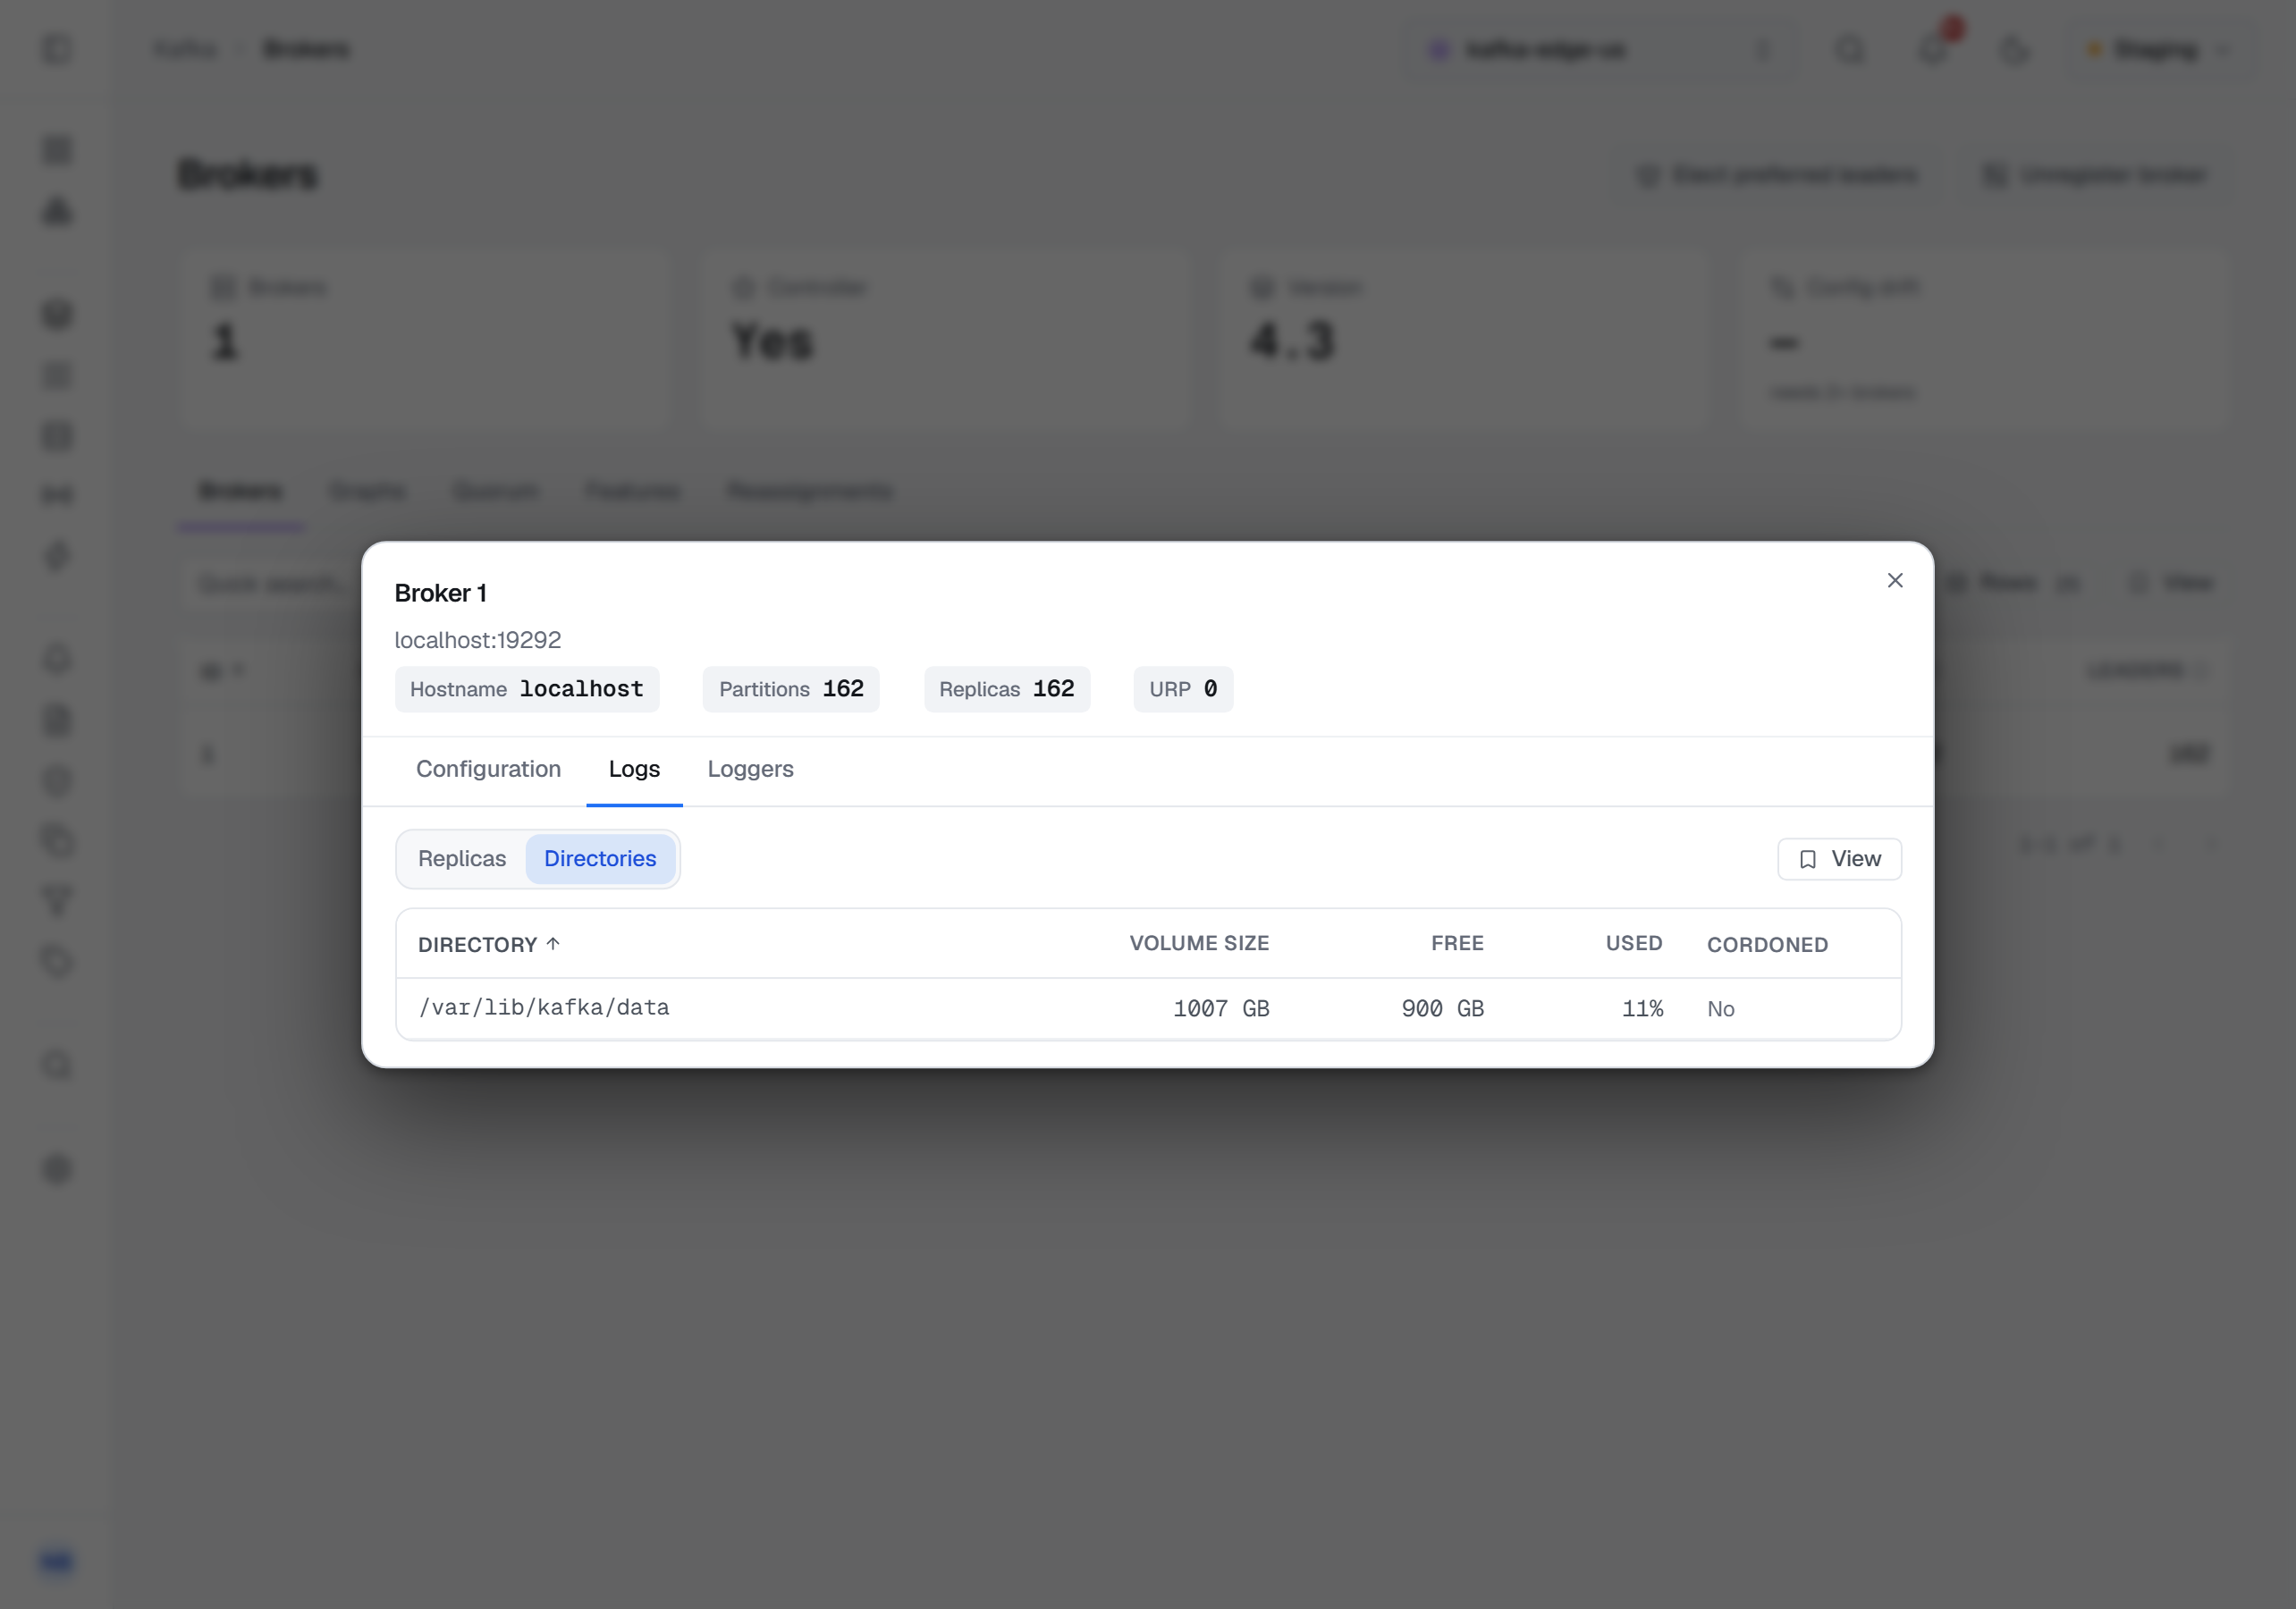
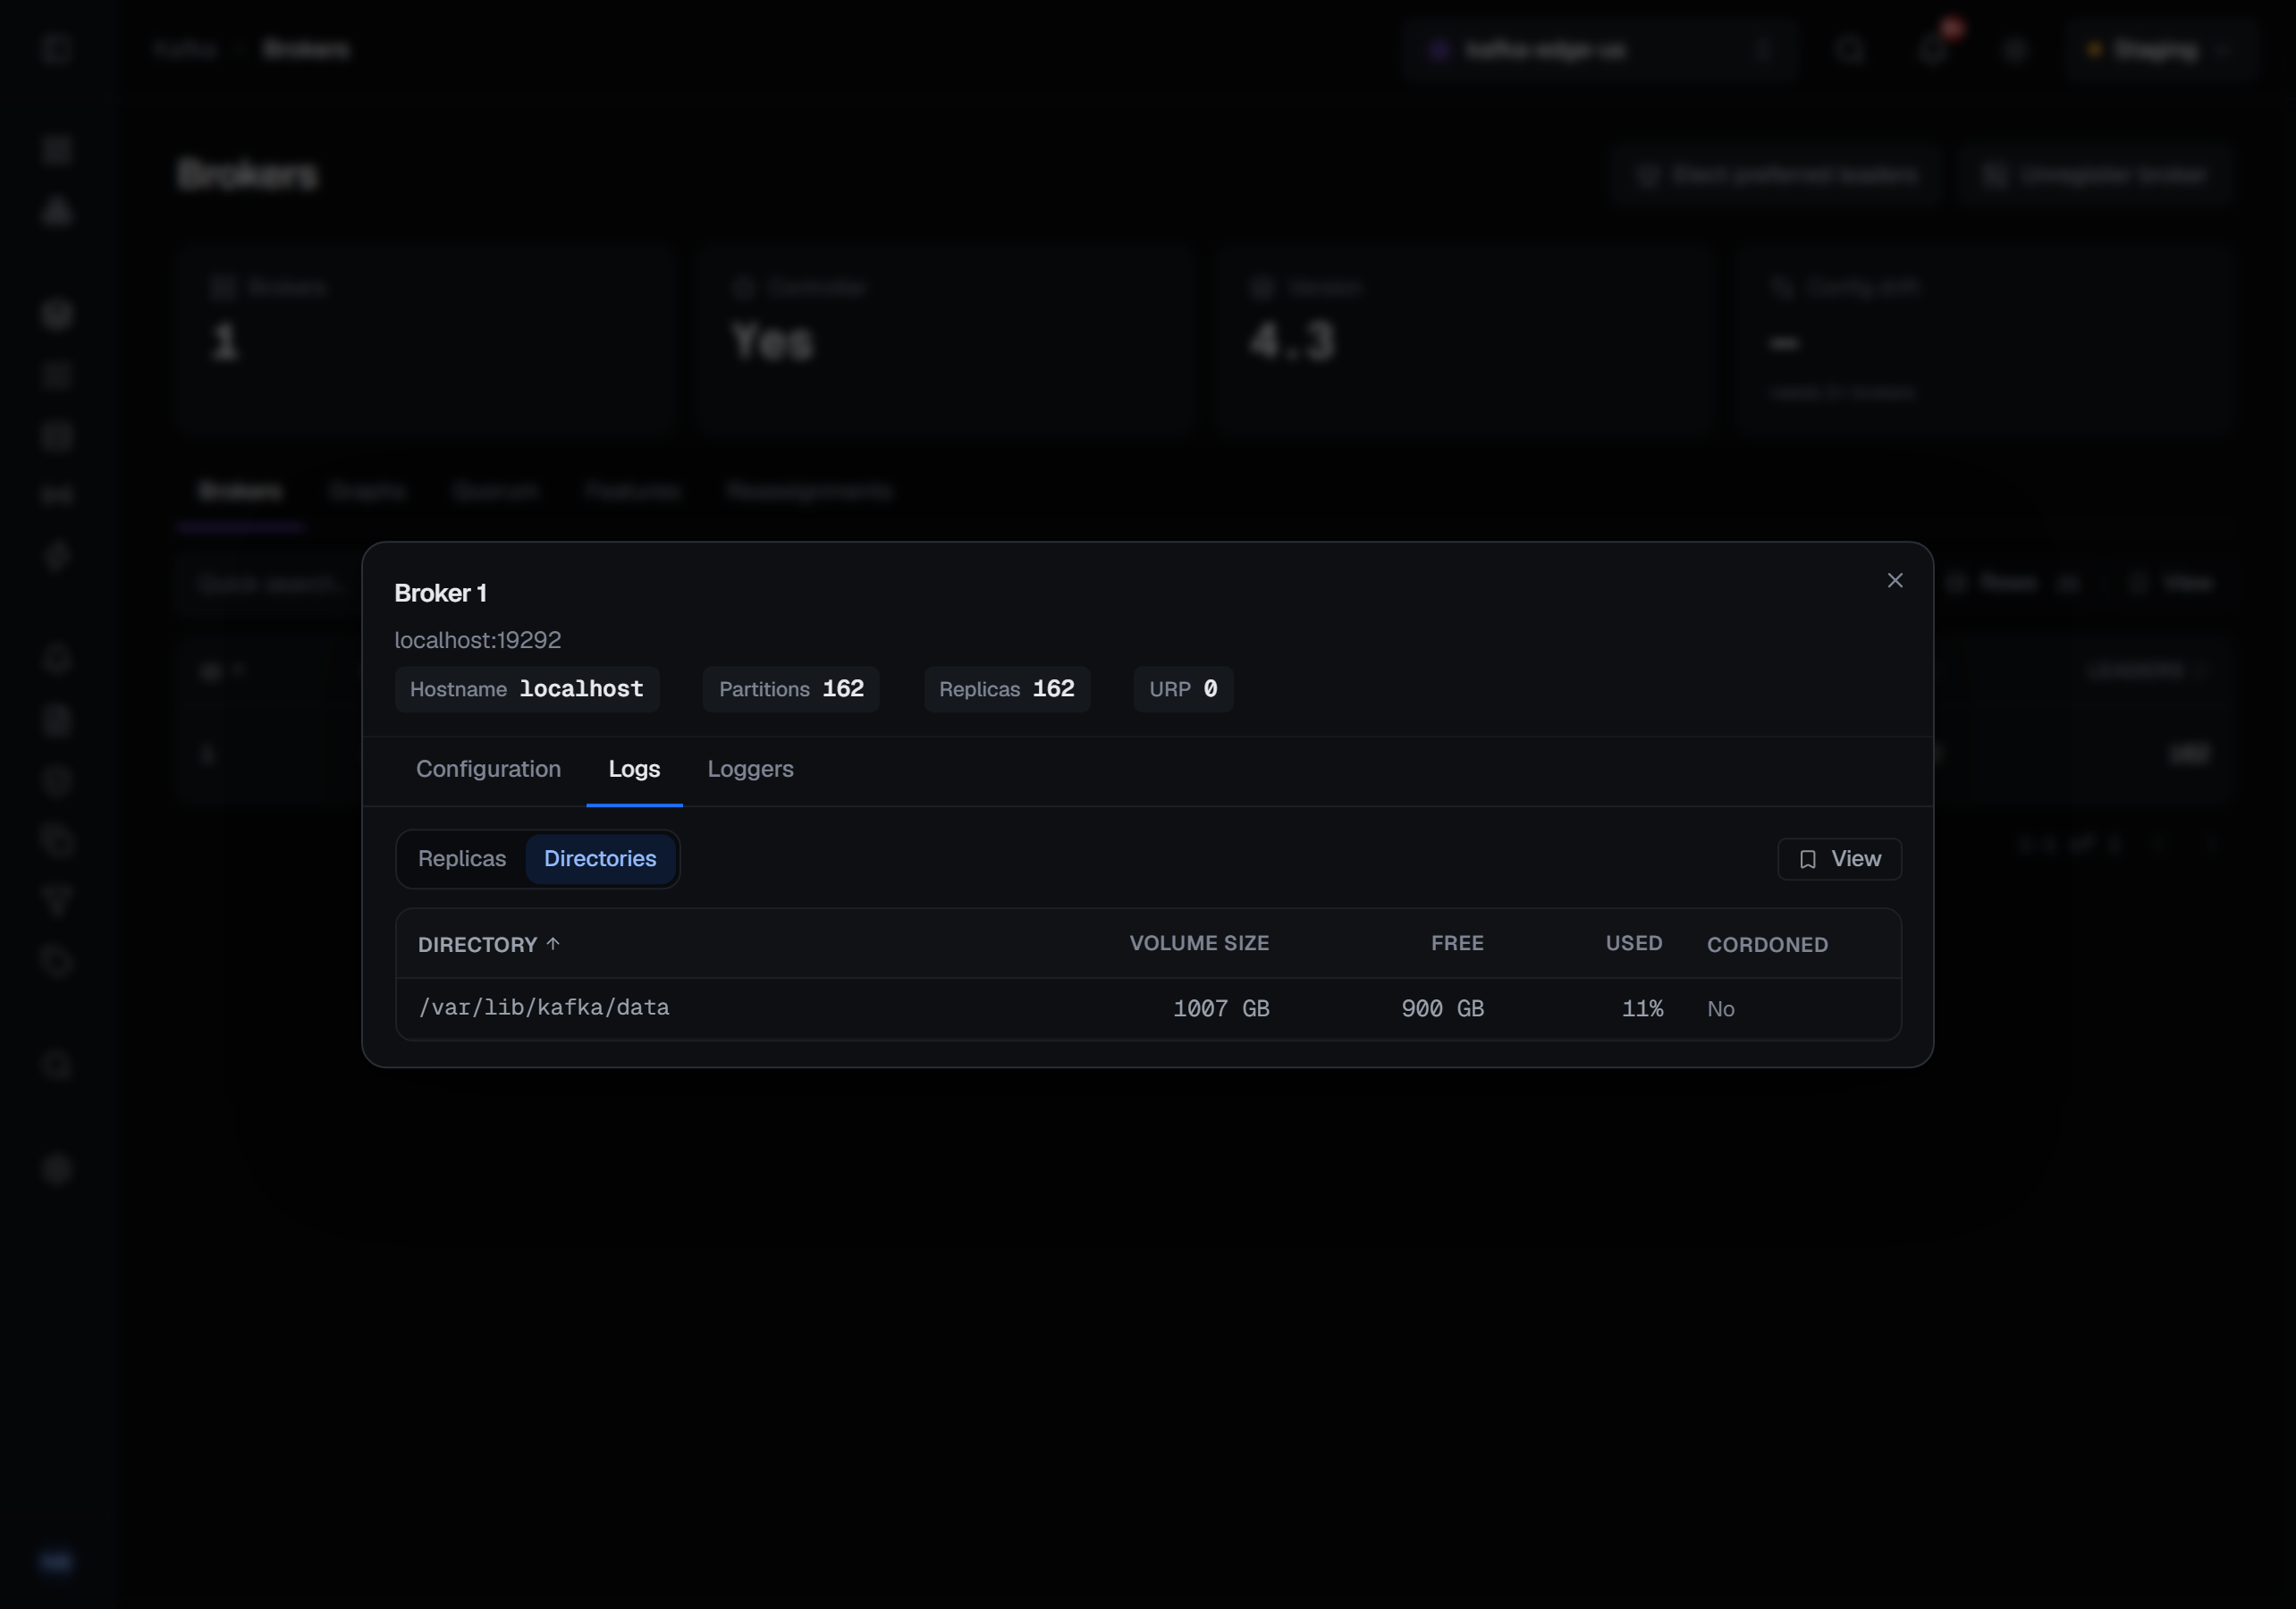
Size is what a broker has written, not how full its disk is. The list's Size column is the on-disk size Kafka reports per broker. How much room is left is on the broker's own detail, under Logs ▸ Directories: each log directory's volume size, free space and share used, whether it is cordoned, and whether it is offline. A broker that does not report its volume says not reported rather than showing zero.
The active controller carries a badge, so the node that matters during a rebalance is identifiable at a glance rather than by cross-checking ids. On a KRaft cluster that is the leader of the metadata quorum. When the leader is a controller-only node — one that is not a broker and so has no row — no row carries the badge and the Controller tile names the node instead, saying it is not one of the listed brokers.
The Config drift tile compares every property's value across the serving brokers and reads None or Found. It leaves out the settings that are each broker's own and are meant to differ: its id and rack, the addresses it listens on and advertises, its log directories and its keystore. It needs two brokers to compare, so on a single broker it shows a dash with needs 2+ brokers; when a broker did not return its configuration it shows a dash counting those brokers, rather than comparing what it could not read.
The Version tile, the FENCED badge on a broker the controller has fenced, and unregistering a broker that is gone are described on Metadata quorum and features, with the cluster's metadata quorum and feature levels.
Two more columns are offered in the list's column chooser and are off until you turn them on: State — Running, Starting, Recovering, Pending controlled shutdown or Shutting down, as the broker reports it — and Offline log dirs. Both come from JMX; without it they read a dash.
Health
Three tiles beside those answer what the Admin API cannot: Active controller — exactly one is healthy, none or
more than one is not — Offline partitions, partitions with no leader, and Under min ISR, partitions with
fewer in-sync replicas than they require, which refuse acks=all writes. Each says it comes from JMX.
A tile shows a figure only when every node it depends on answered: the active-controller count needs every controller, the under-min-ISR total every broker. When one did not, the tile reads a dash and says so rather than adding up part of the cluster — the brokers that did answer still show their own figures in the columns and on the Graphs tab. Without JMX each tile reads Needs JMX; clicking it opens the JMX settings described below.
Configuration, and where each value came from
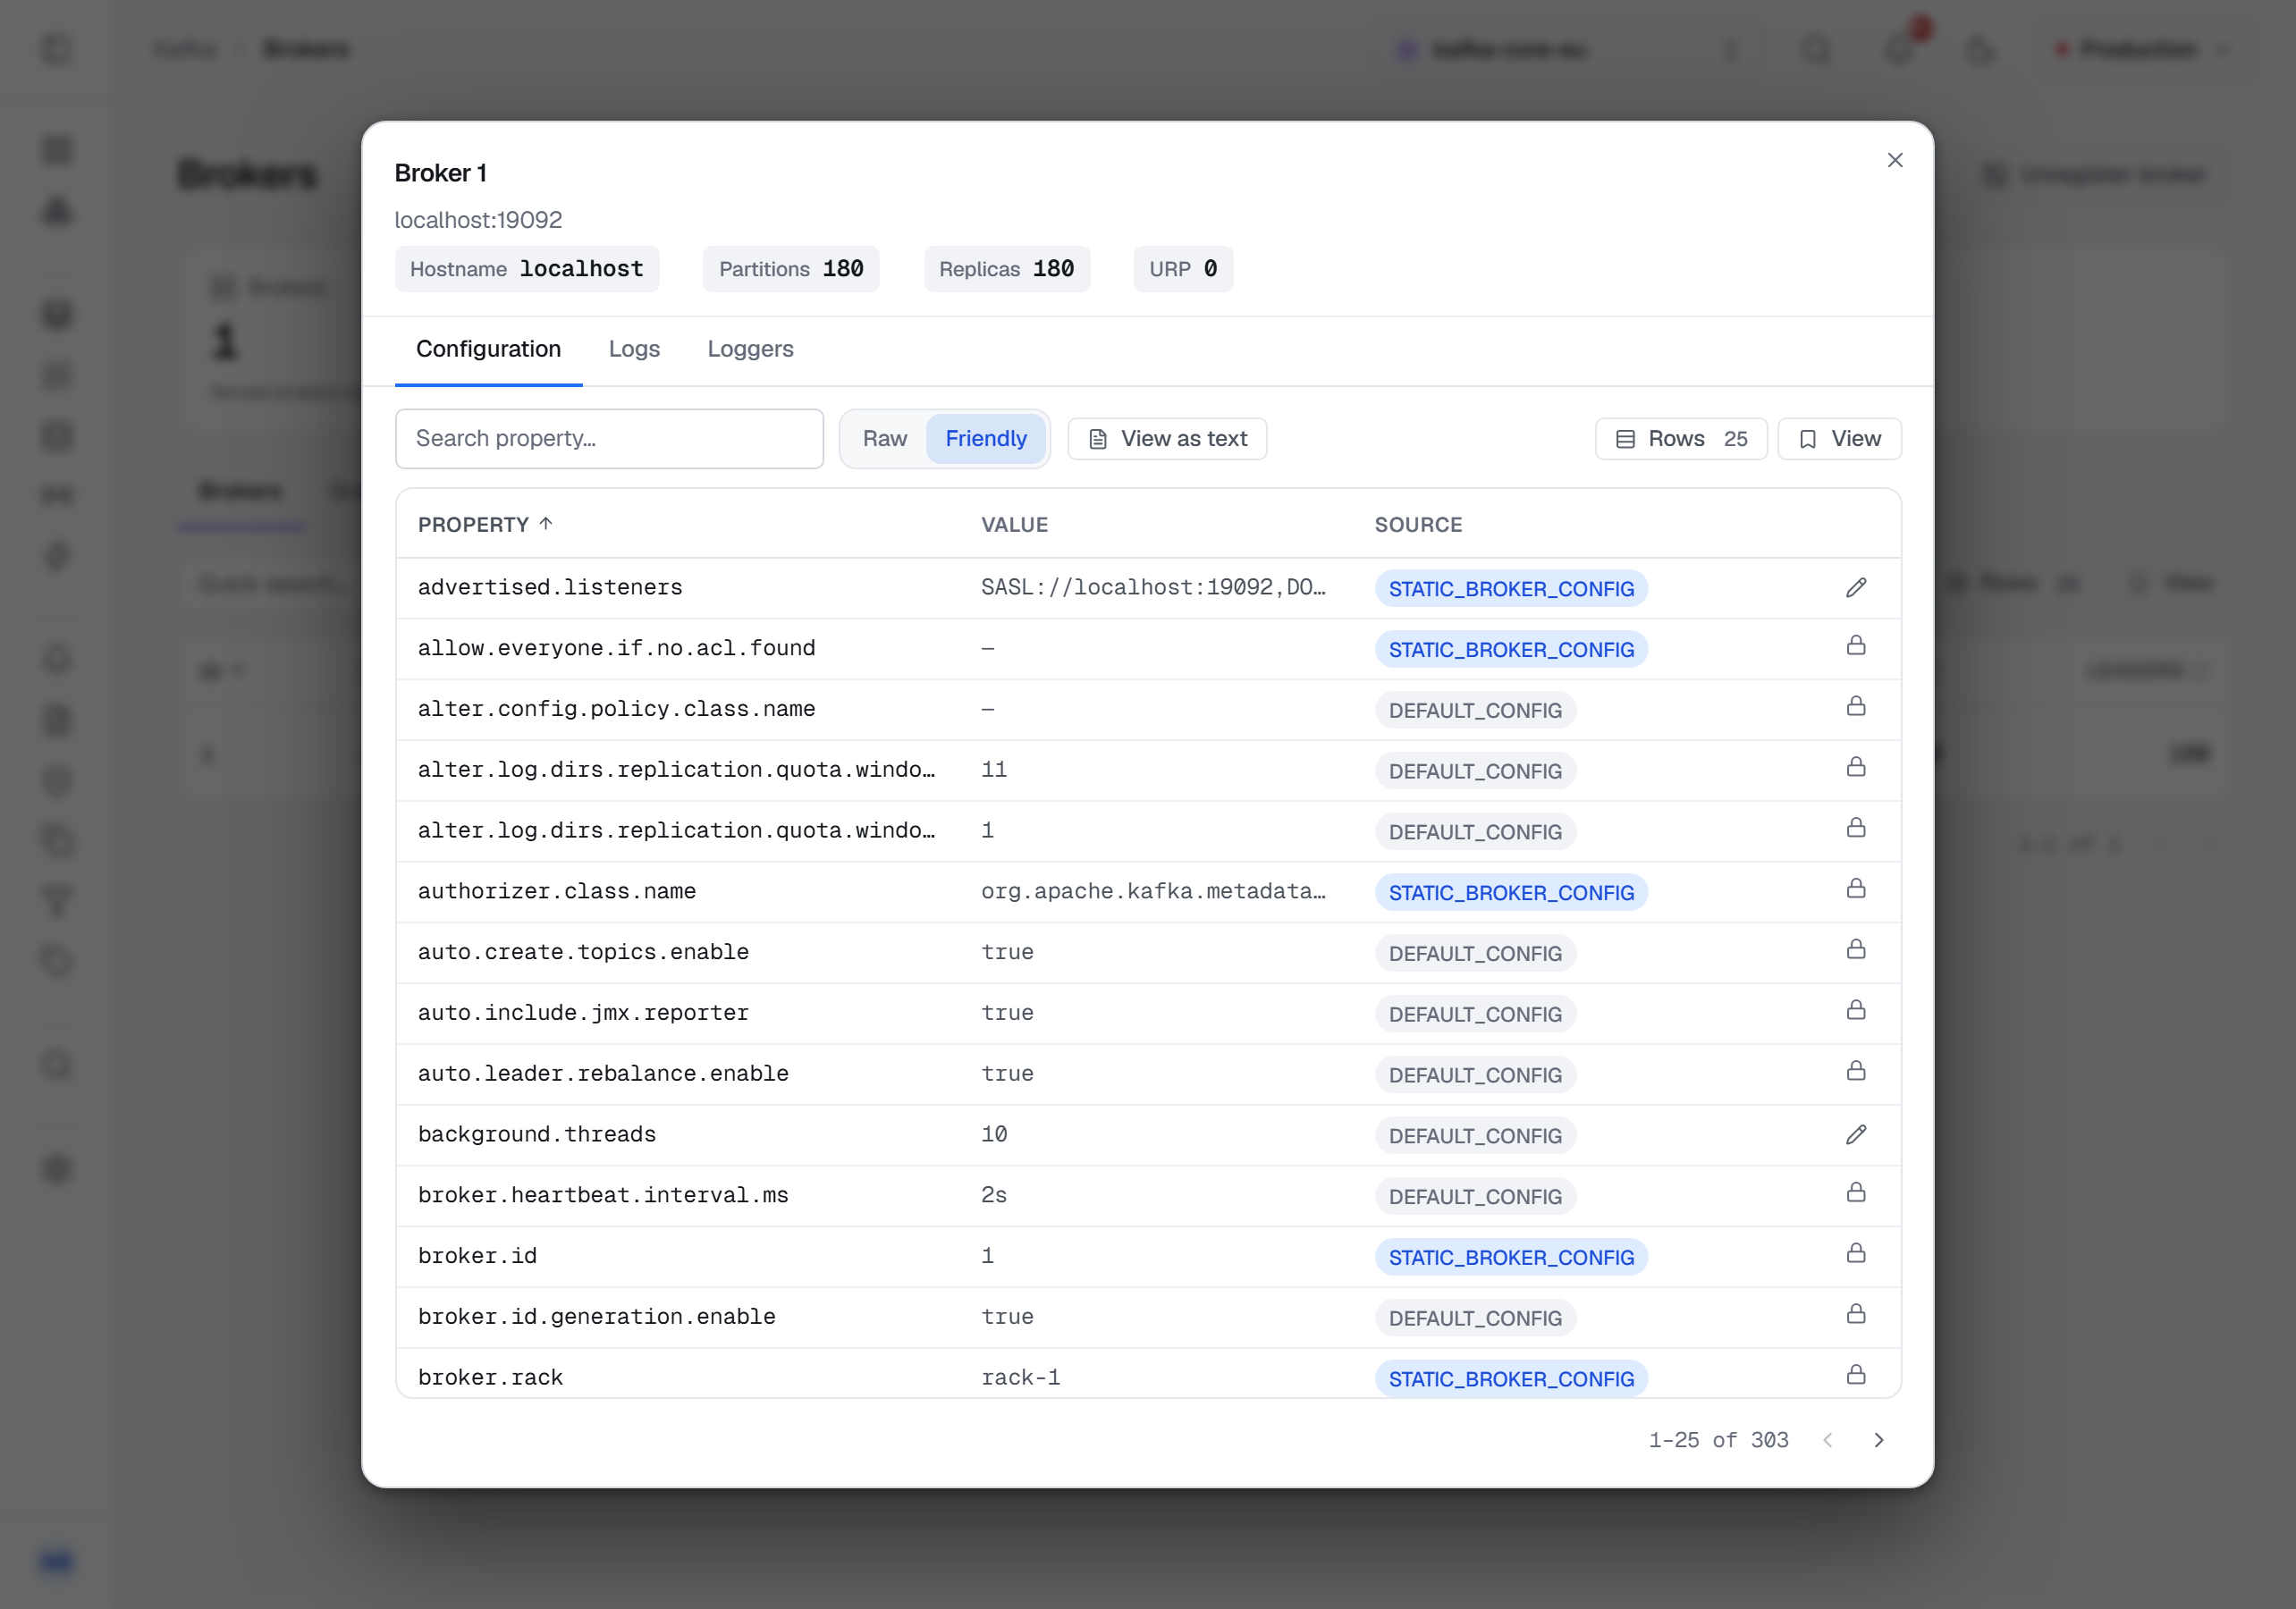
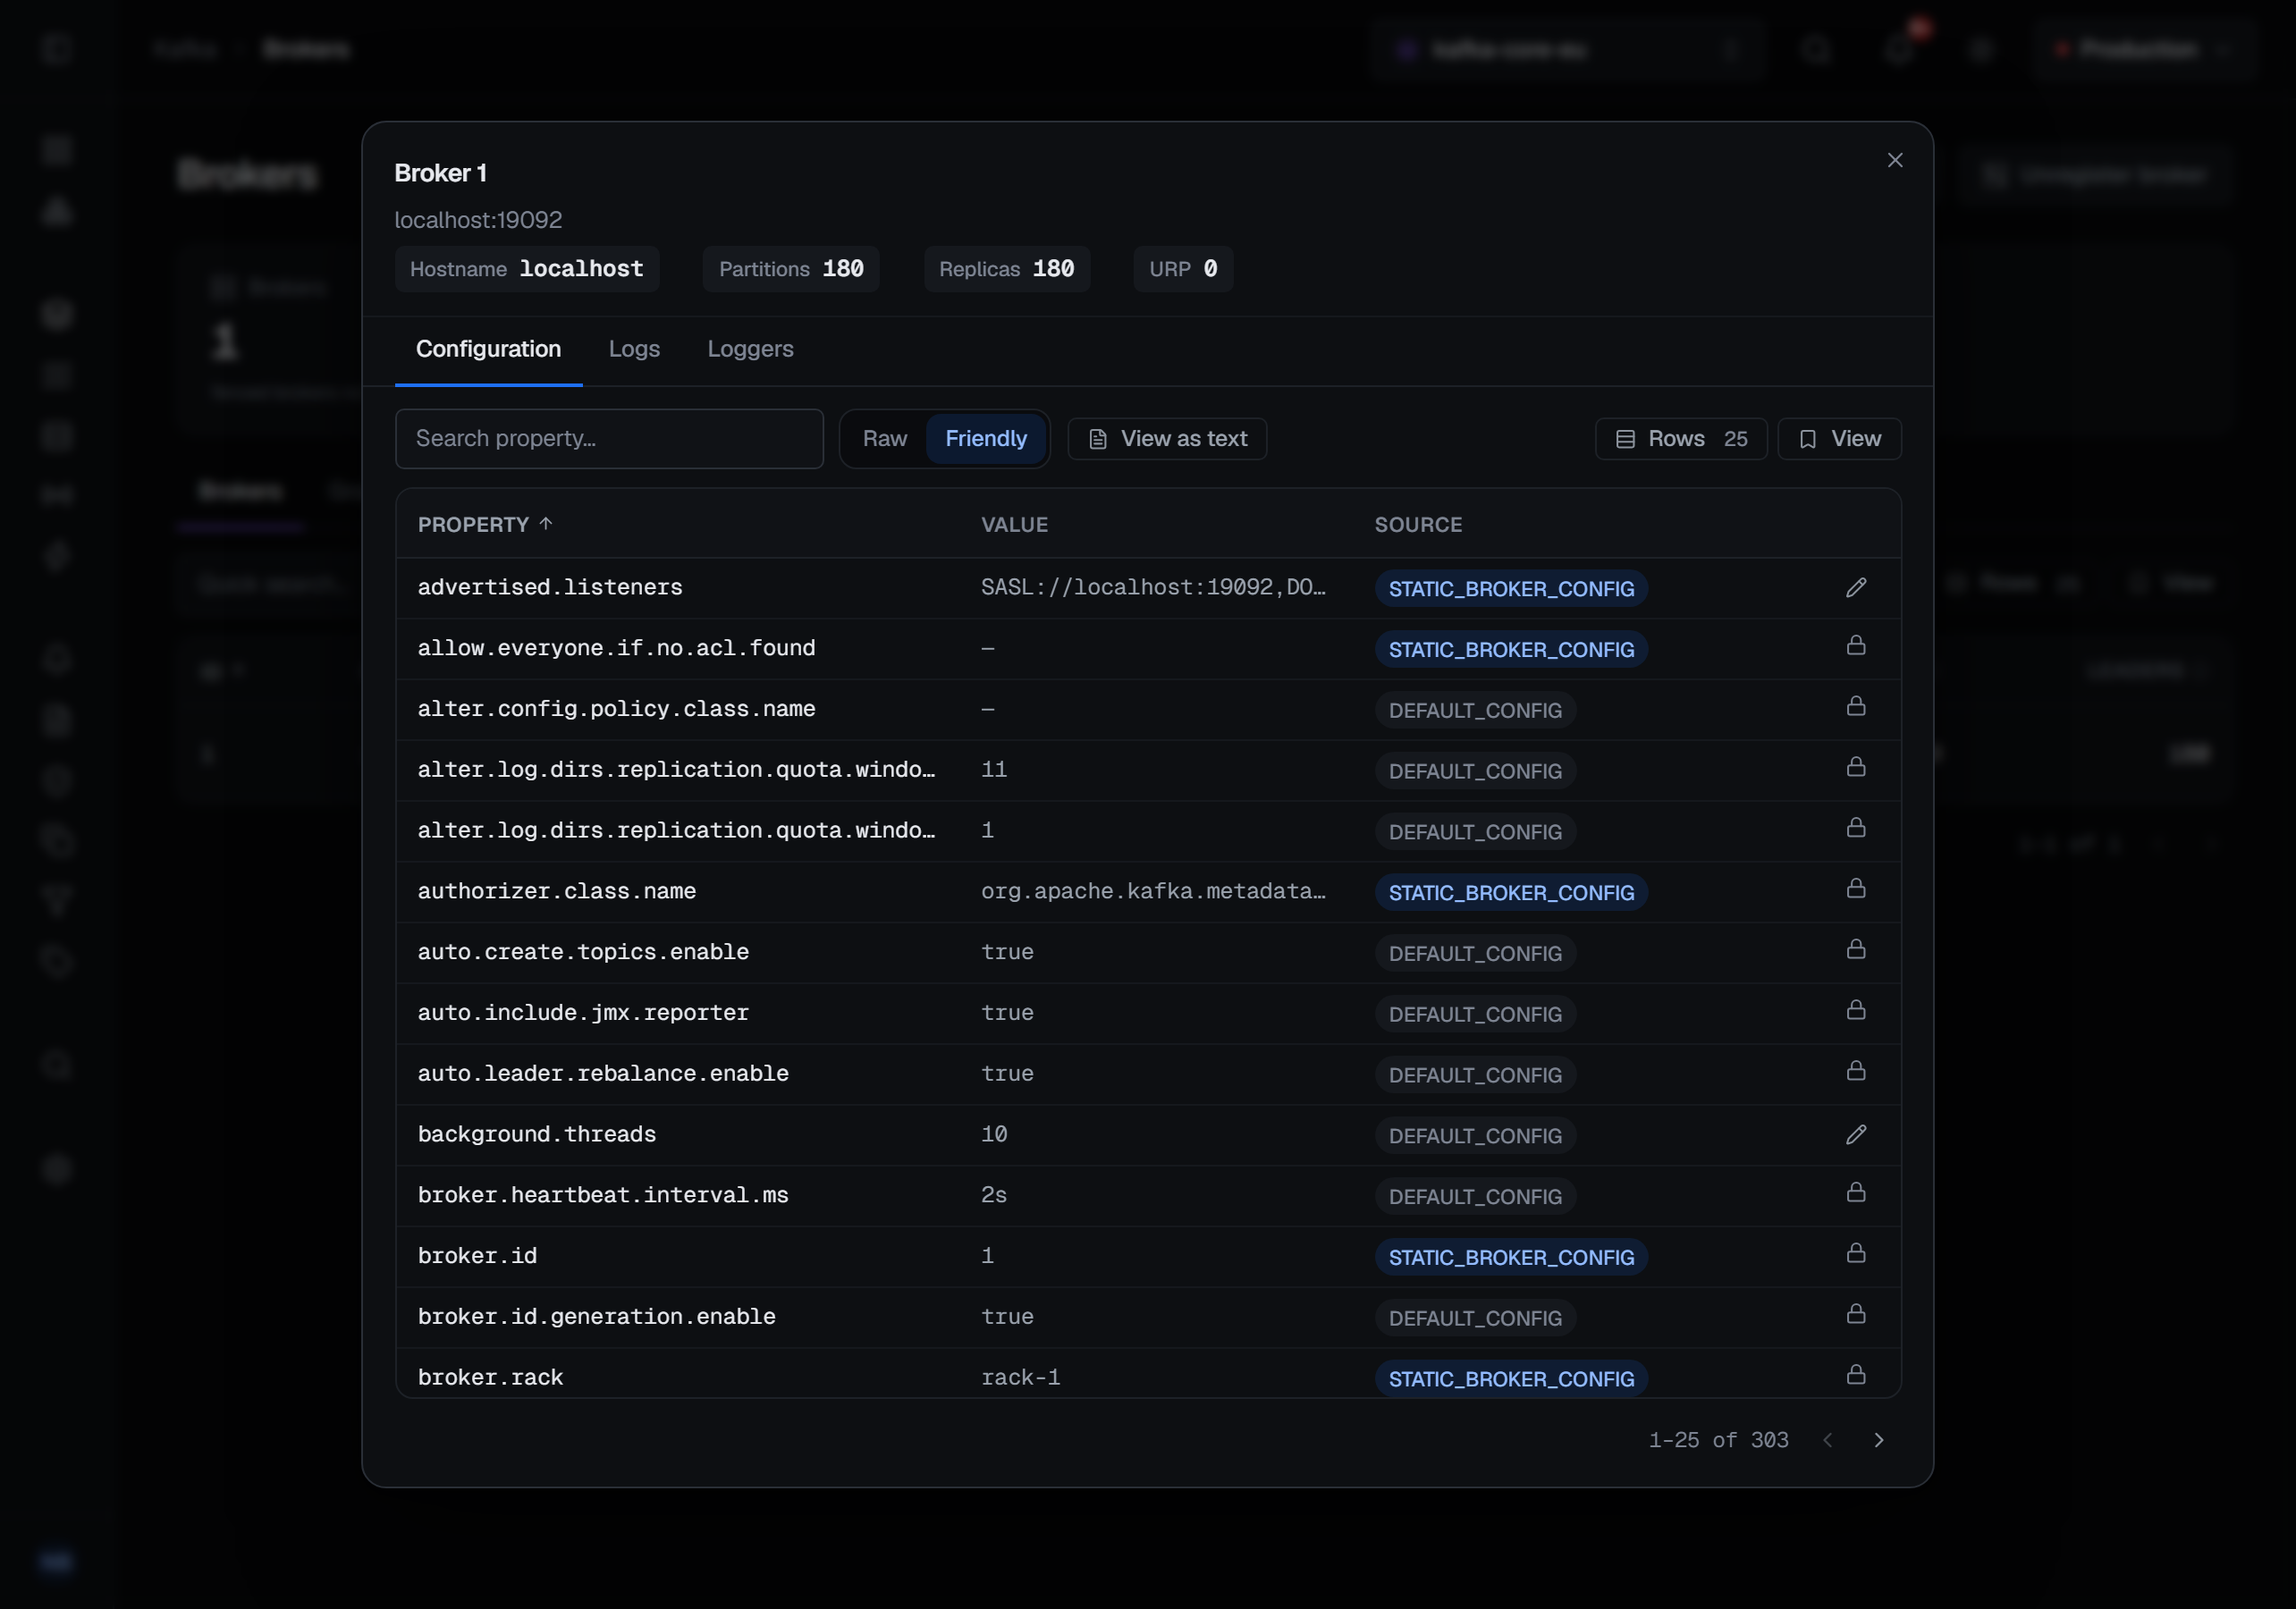
Clicking a broker opens its detail, and the Configuration tab is the part worth knowing about: the broker's effective configuration, every property, each one labelled with Kafka's own source for it — a static value from the properties file, a dynamic one set at runtime, or the built-in default.
That last column is what makes the tab useful. "The retention is 7 days" and "the retention is 7 days because nobody ever set it" are different facts, and only one of them survives a broker restart with a new config file.
Values can be read raw or humanised — byte counts as sizes, millisecond values as durations, and
Kafka's several ways of spelling "no limit" all shown as Infinity. There is also a plain-text view
that dumps the whole effective configuration as name=value lines, which is the form you want when
you are comparing two brokers by eye or pasting into a ticket.
A property the broker lets change while it runs has a pencil on its row. One it does not is locked, and the lock says why: Kafka does not let that property change while the broker runs.
Changing a broker's configuration
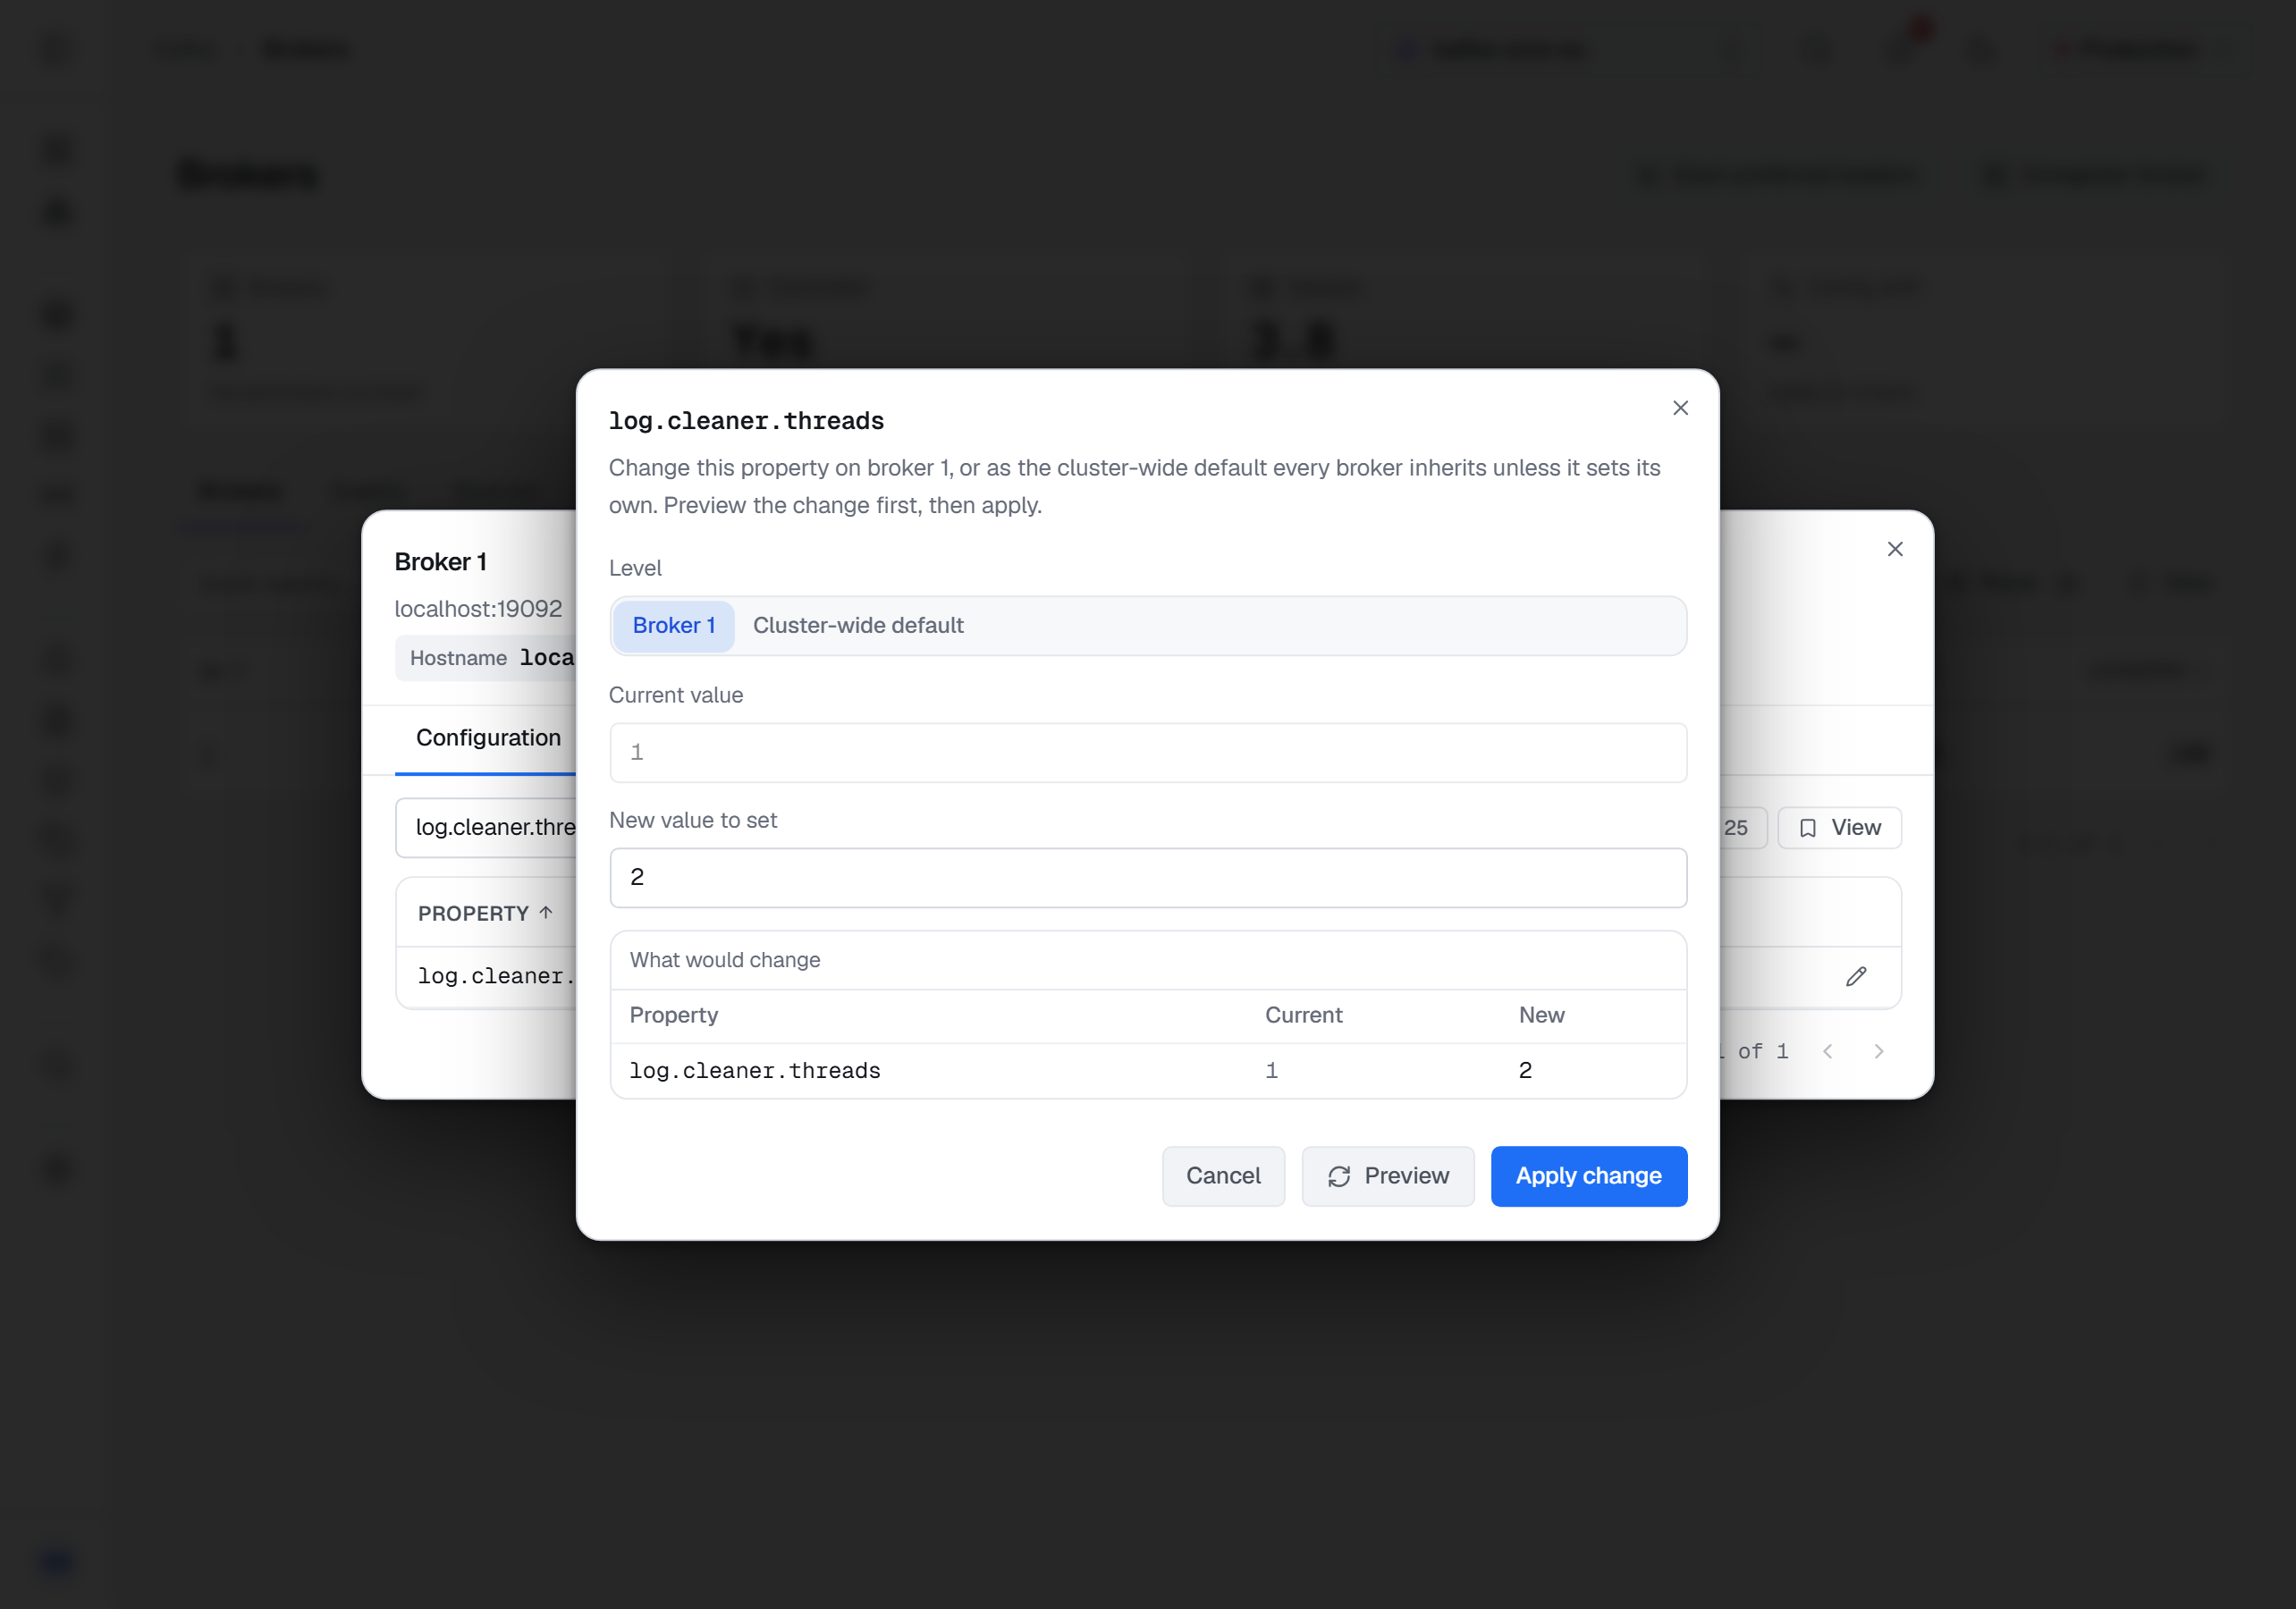
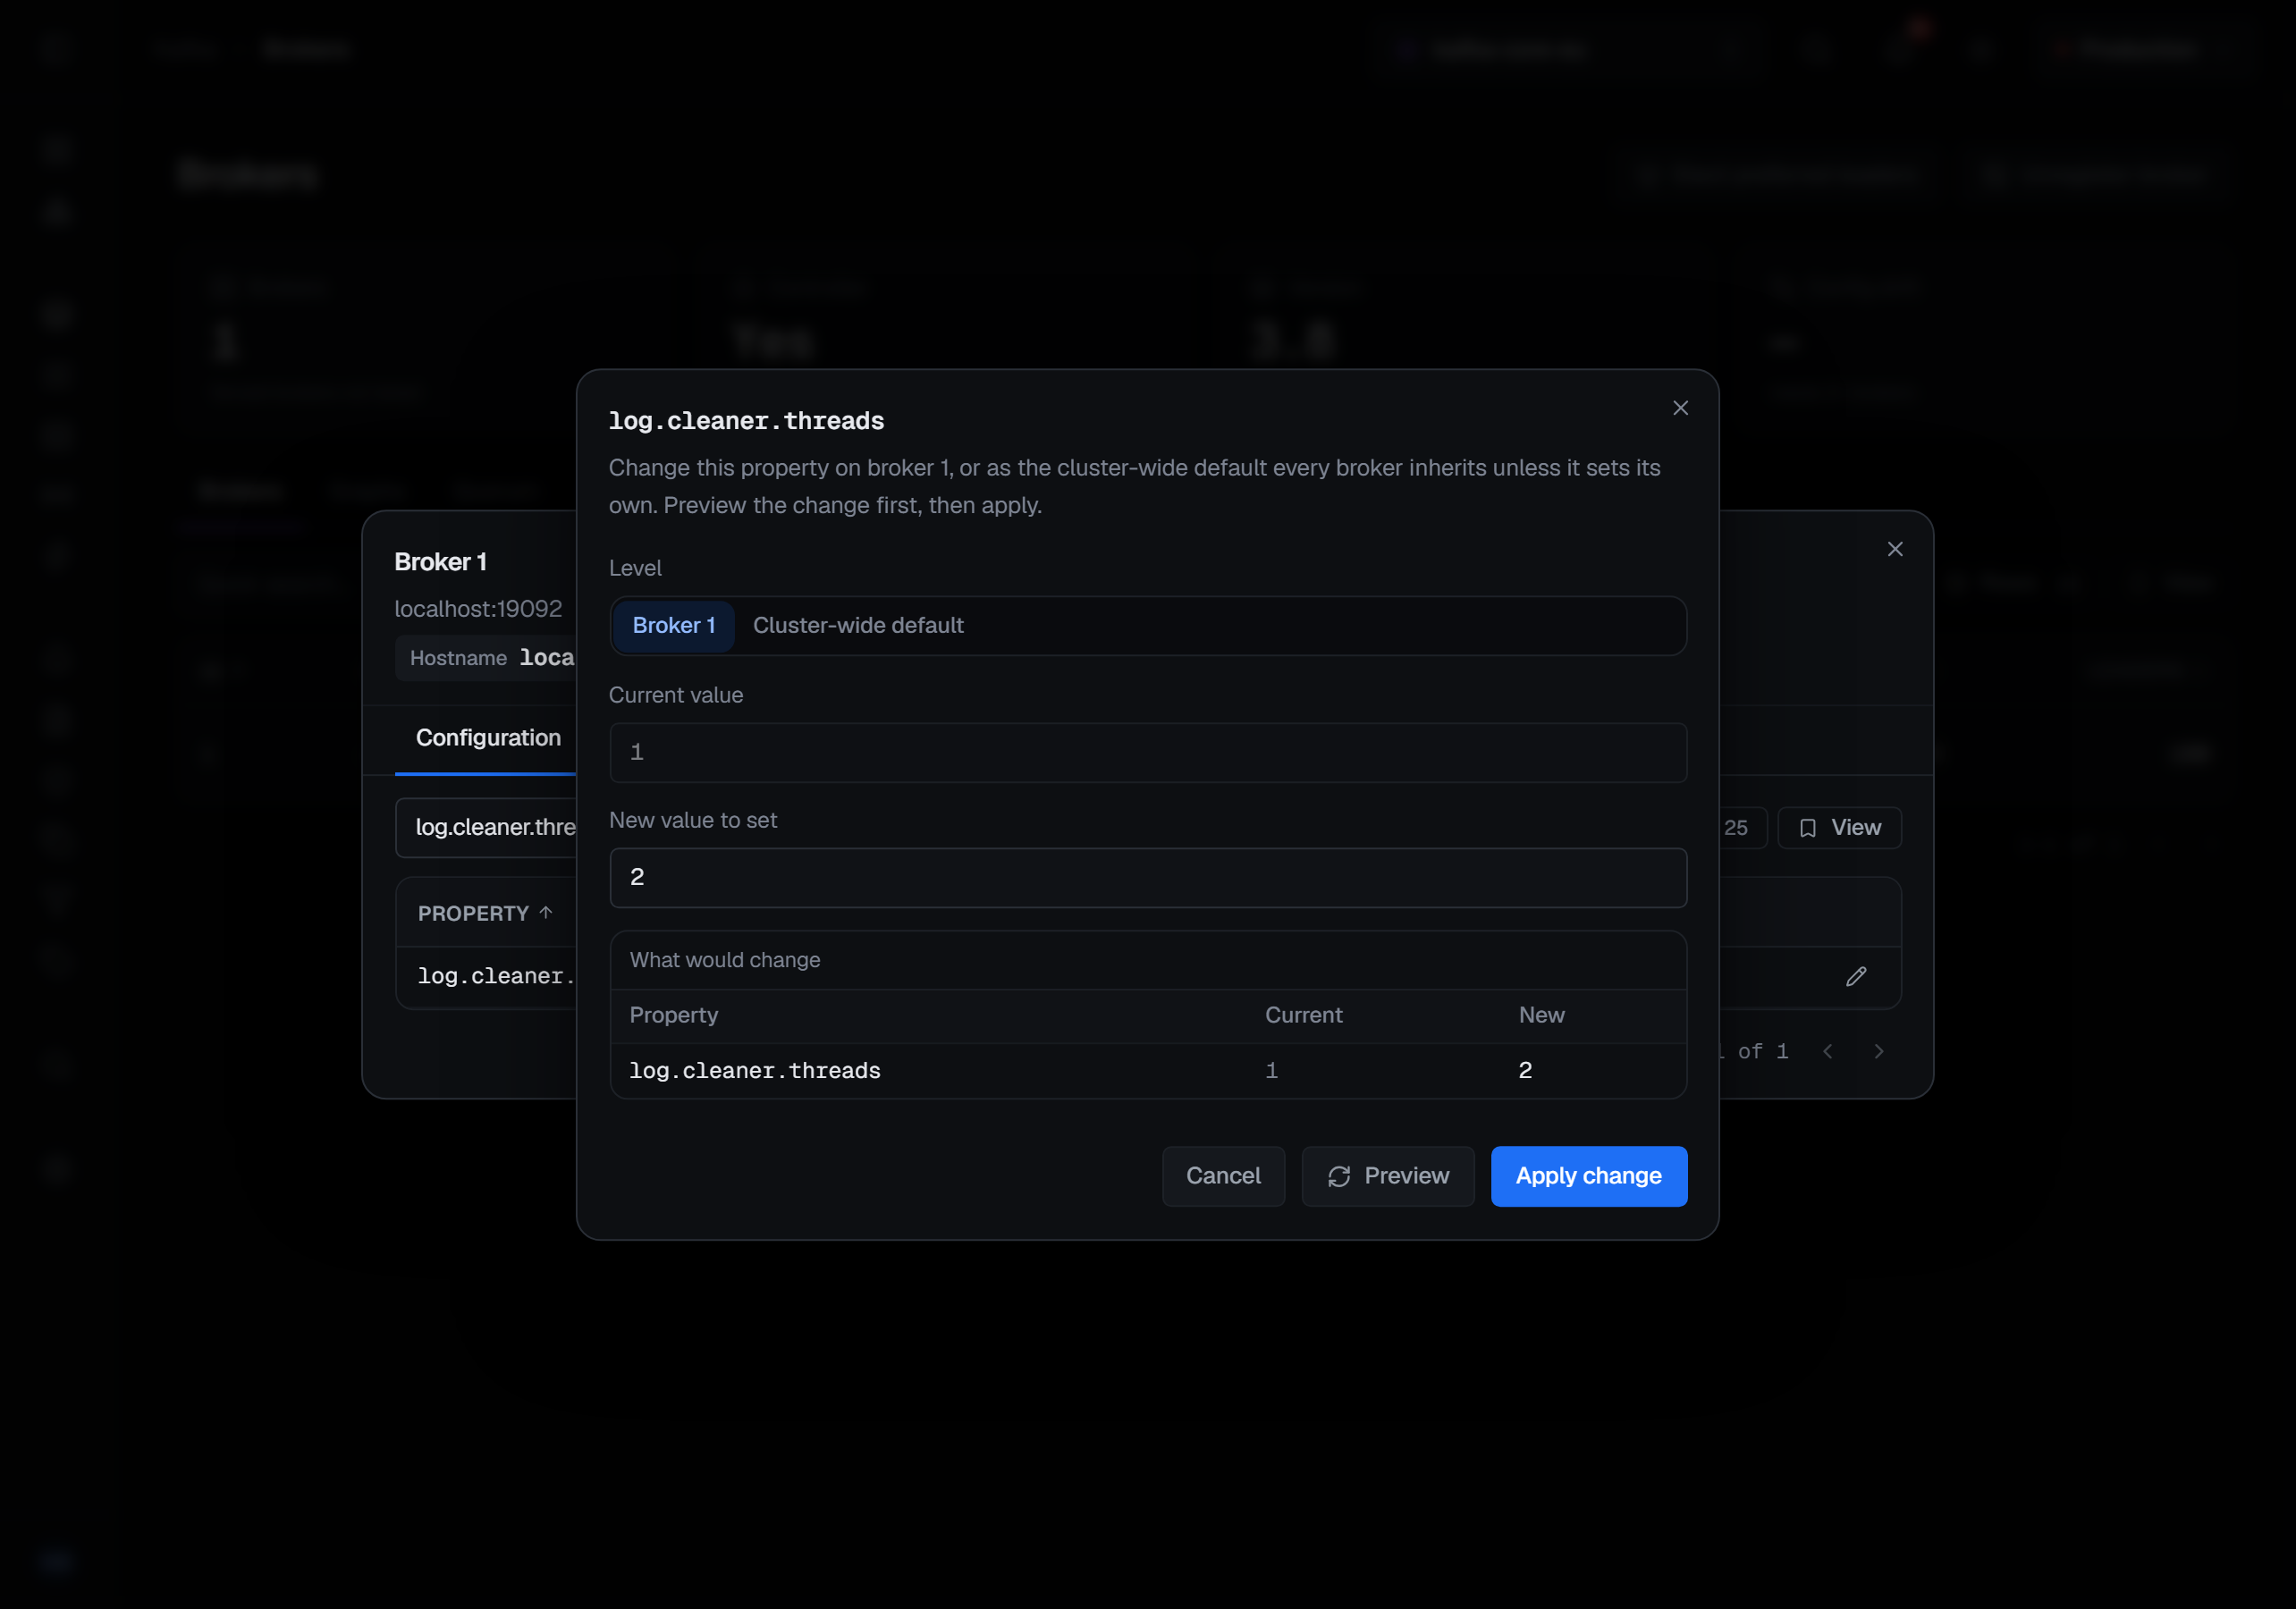
The pencil opens the property's dialog. Level chooses where the change is made: on this broker alone, or as the Cluster-wide default that every broker inherits unless it sets its own. Change chooses between Set a value and Remove the value; it appears only where a value is set at that level, because only a value set there can be removed from it. A broker whose own value is removed falls back to the next level down: the cluster-wide default if there is one, then its properties file, then Kafka's default.
These changes are dynamic. The broker applies them while it runs, with no restart. Kafka keeps them in the
cluster itself rather than in the broker's properties file, so they survive a restart, and a dynamic value
takes precedence over what server.properties says. After a change the property's source says so: the value
now comes from the broker's or the cluster's dynamic configuration, not from the file.
Preview comes first. The brokers check the change without writing it, and the dialog shows What would change — each property's current value beside the new one. A value Kafka will not take is refused there in its own words, and so is a property that can only be set per broker when it is sent as the cluster-wide default. Apply change stays disabled until a preview has succeeded, and applies exactly the change previewed. A sensitive property is typed into a masked field and shows as withheld in the preview.
Changing broker configuration needs the permission to manage the cluster. The connection's own Kafka identity
must also hold ALTER_CONFIGS on the cluster; without it, the pencils are disabled with that reason. In a
read-only environment the dialog says so and Apply change stays disabled.
What is on this broker's disks
The detail's second tab, Logs, switches between two views.
Replicas lists the partition replicas this broker holds — the log directory, the topic, the partition, its offset lag and its size. The offset lag is how far this replica's log trails the partition's high watermark, so a replica that is keeping up reads 0. It is the answer to "why is this one broker so much bigger than the others", read one row at a time. It lists partition replicas, not log files: there is no server-log or GC-log browsing here.
Directories lists each log directory with its volume size, how much is free and the share used — the question the Size column cannot answer. A directory Kafka reports as failed carries an OFFLINE badge with the error it gave. Cordoned says whether the directory has been cordoned, so that no new partitions are placed on it; that is a Kafka 4.x capability, and on an older cluster the column shows a dash with the reason. A broker that does not report its volume — anything before Kafka 3.3 — shows not reported, never 0.
Log levels
A broker's detail also has a Loggers tab: every logger of the running broker with its level, which you can filter by name. Choosing another level from a logger's list — FATAL, ERROR, WARN, INFO, DEBUG or TRACE — sets it on that broker at once. That is how you get debug output from one broker without restarting it. A level set here is not kept across a restart of the broker.
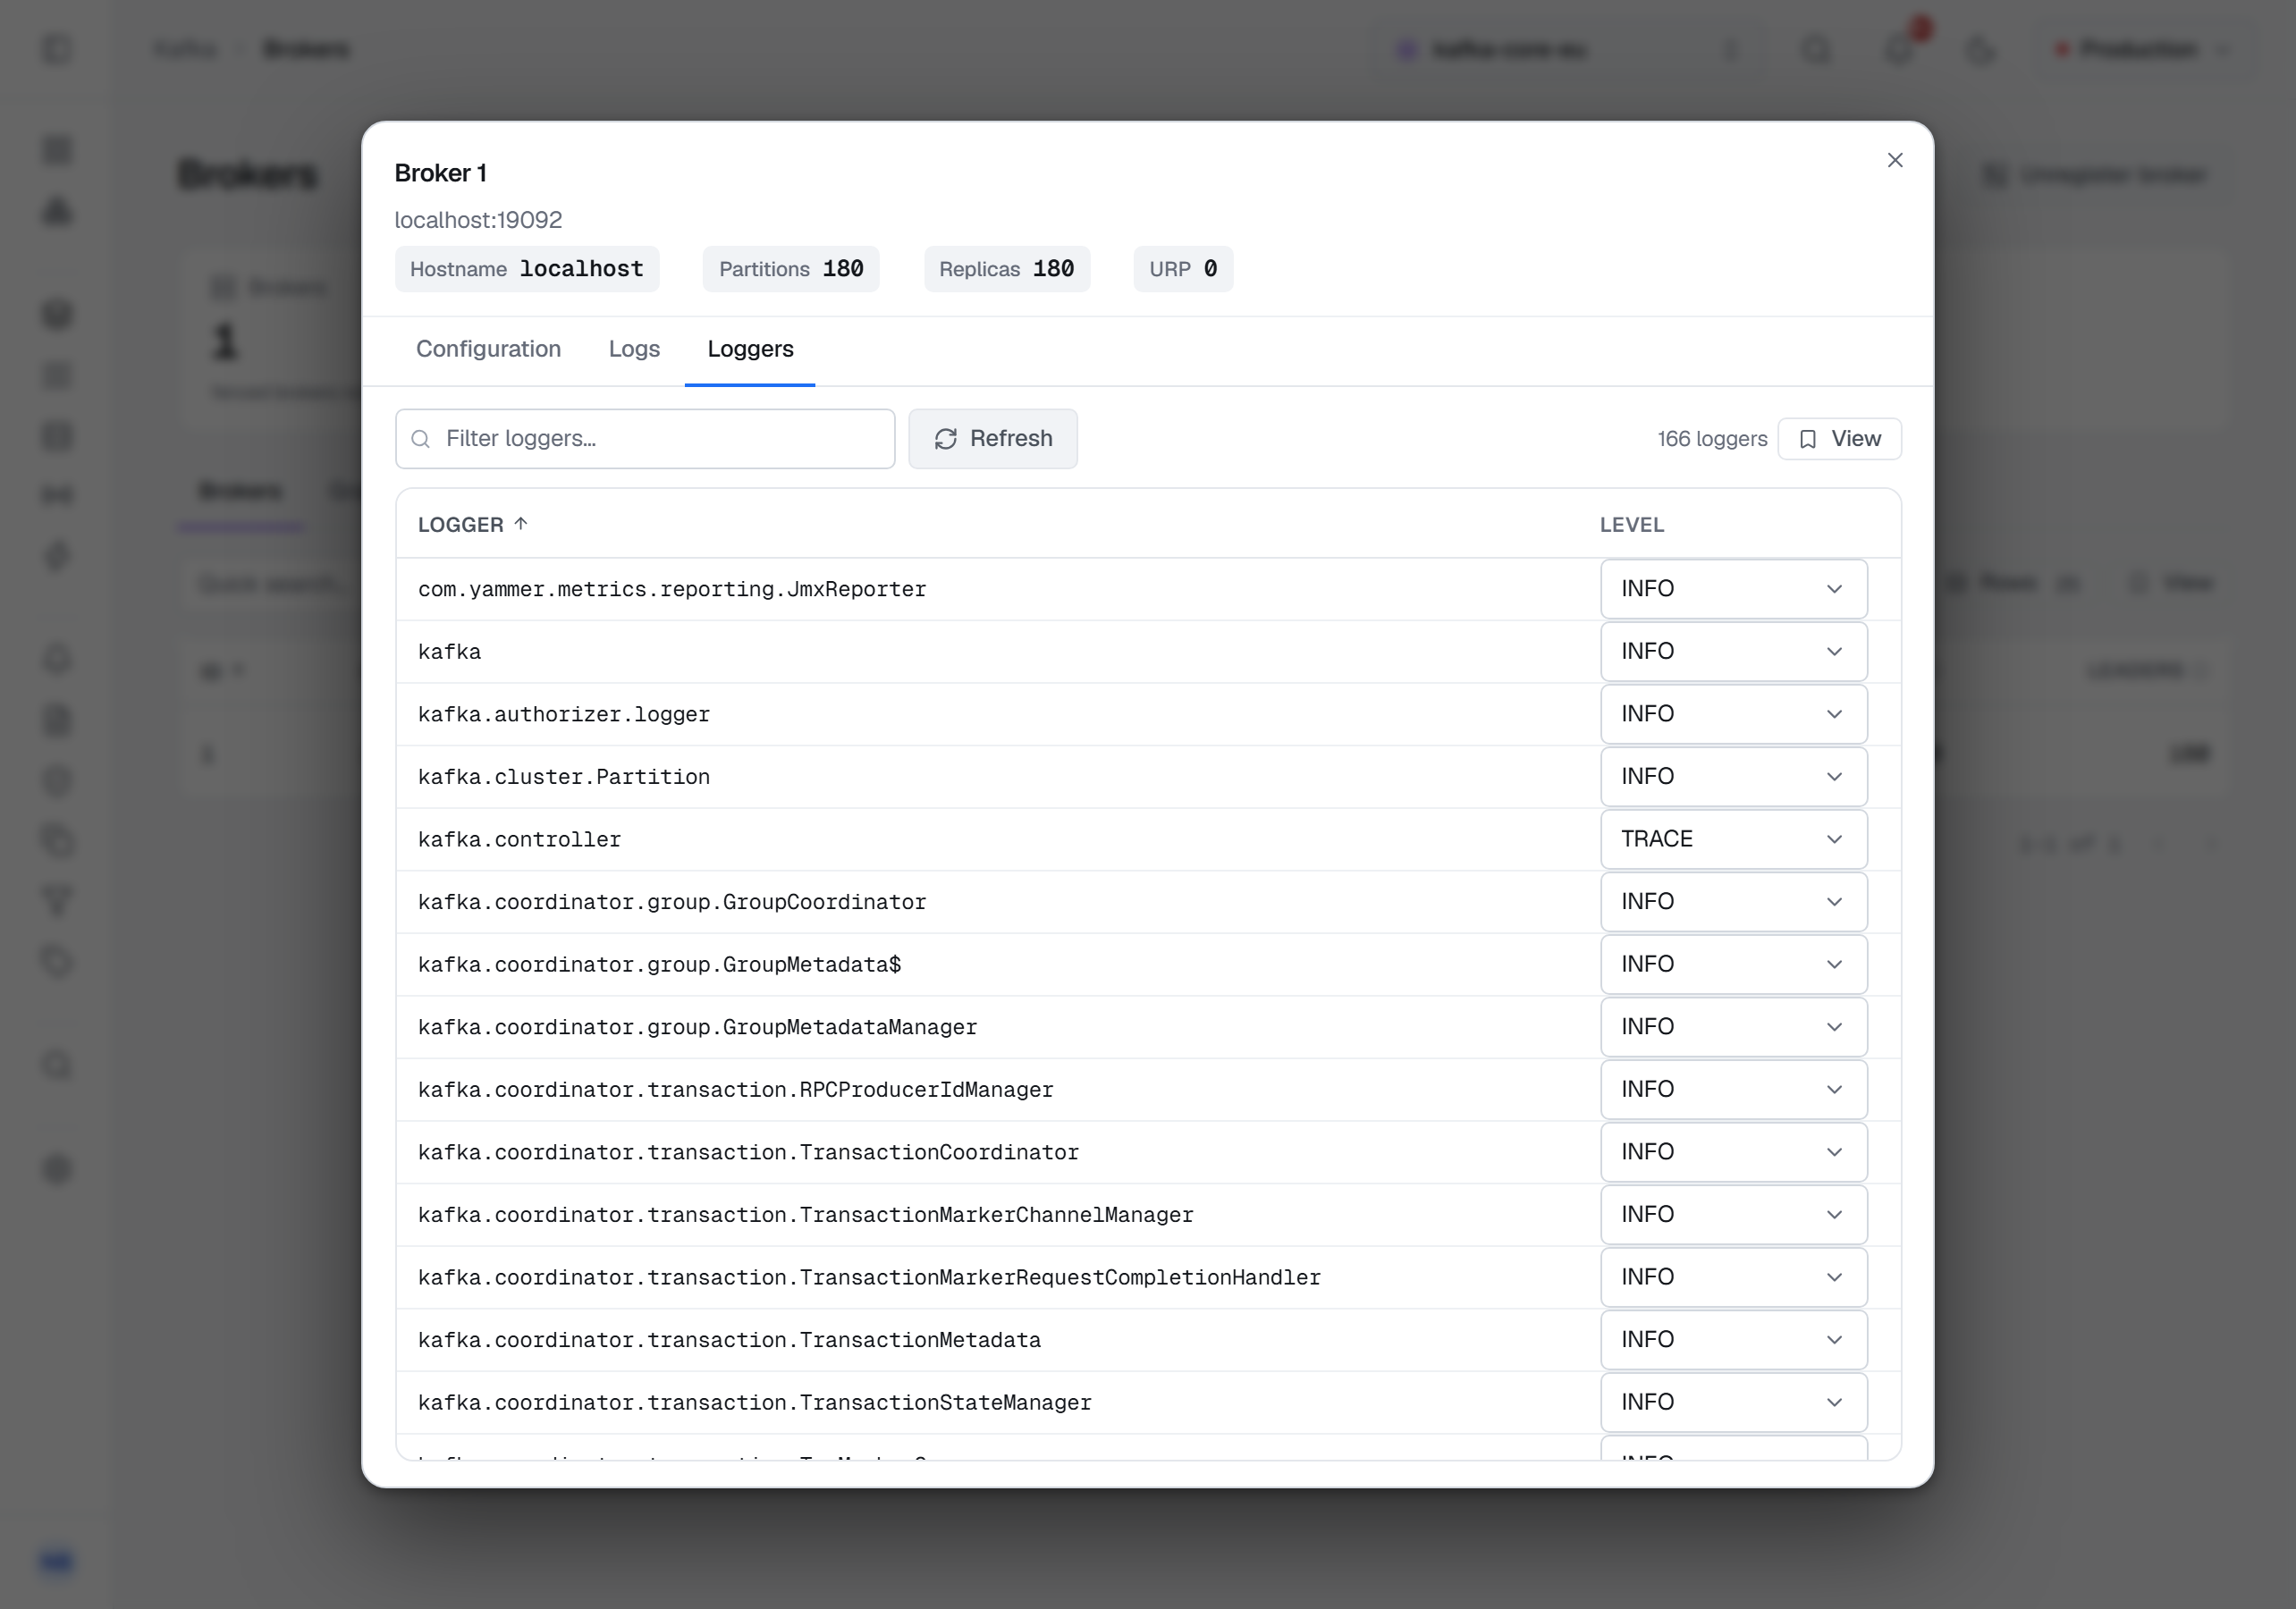
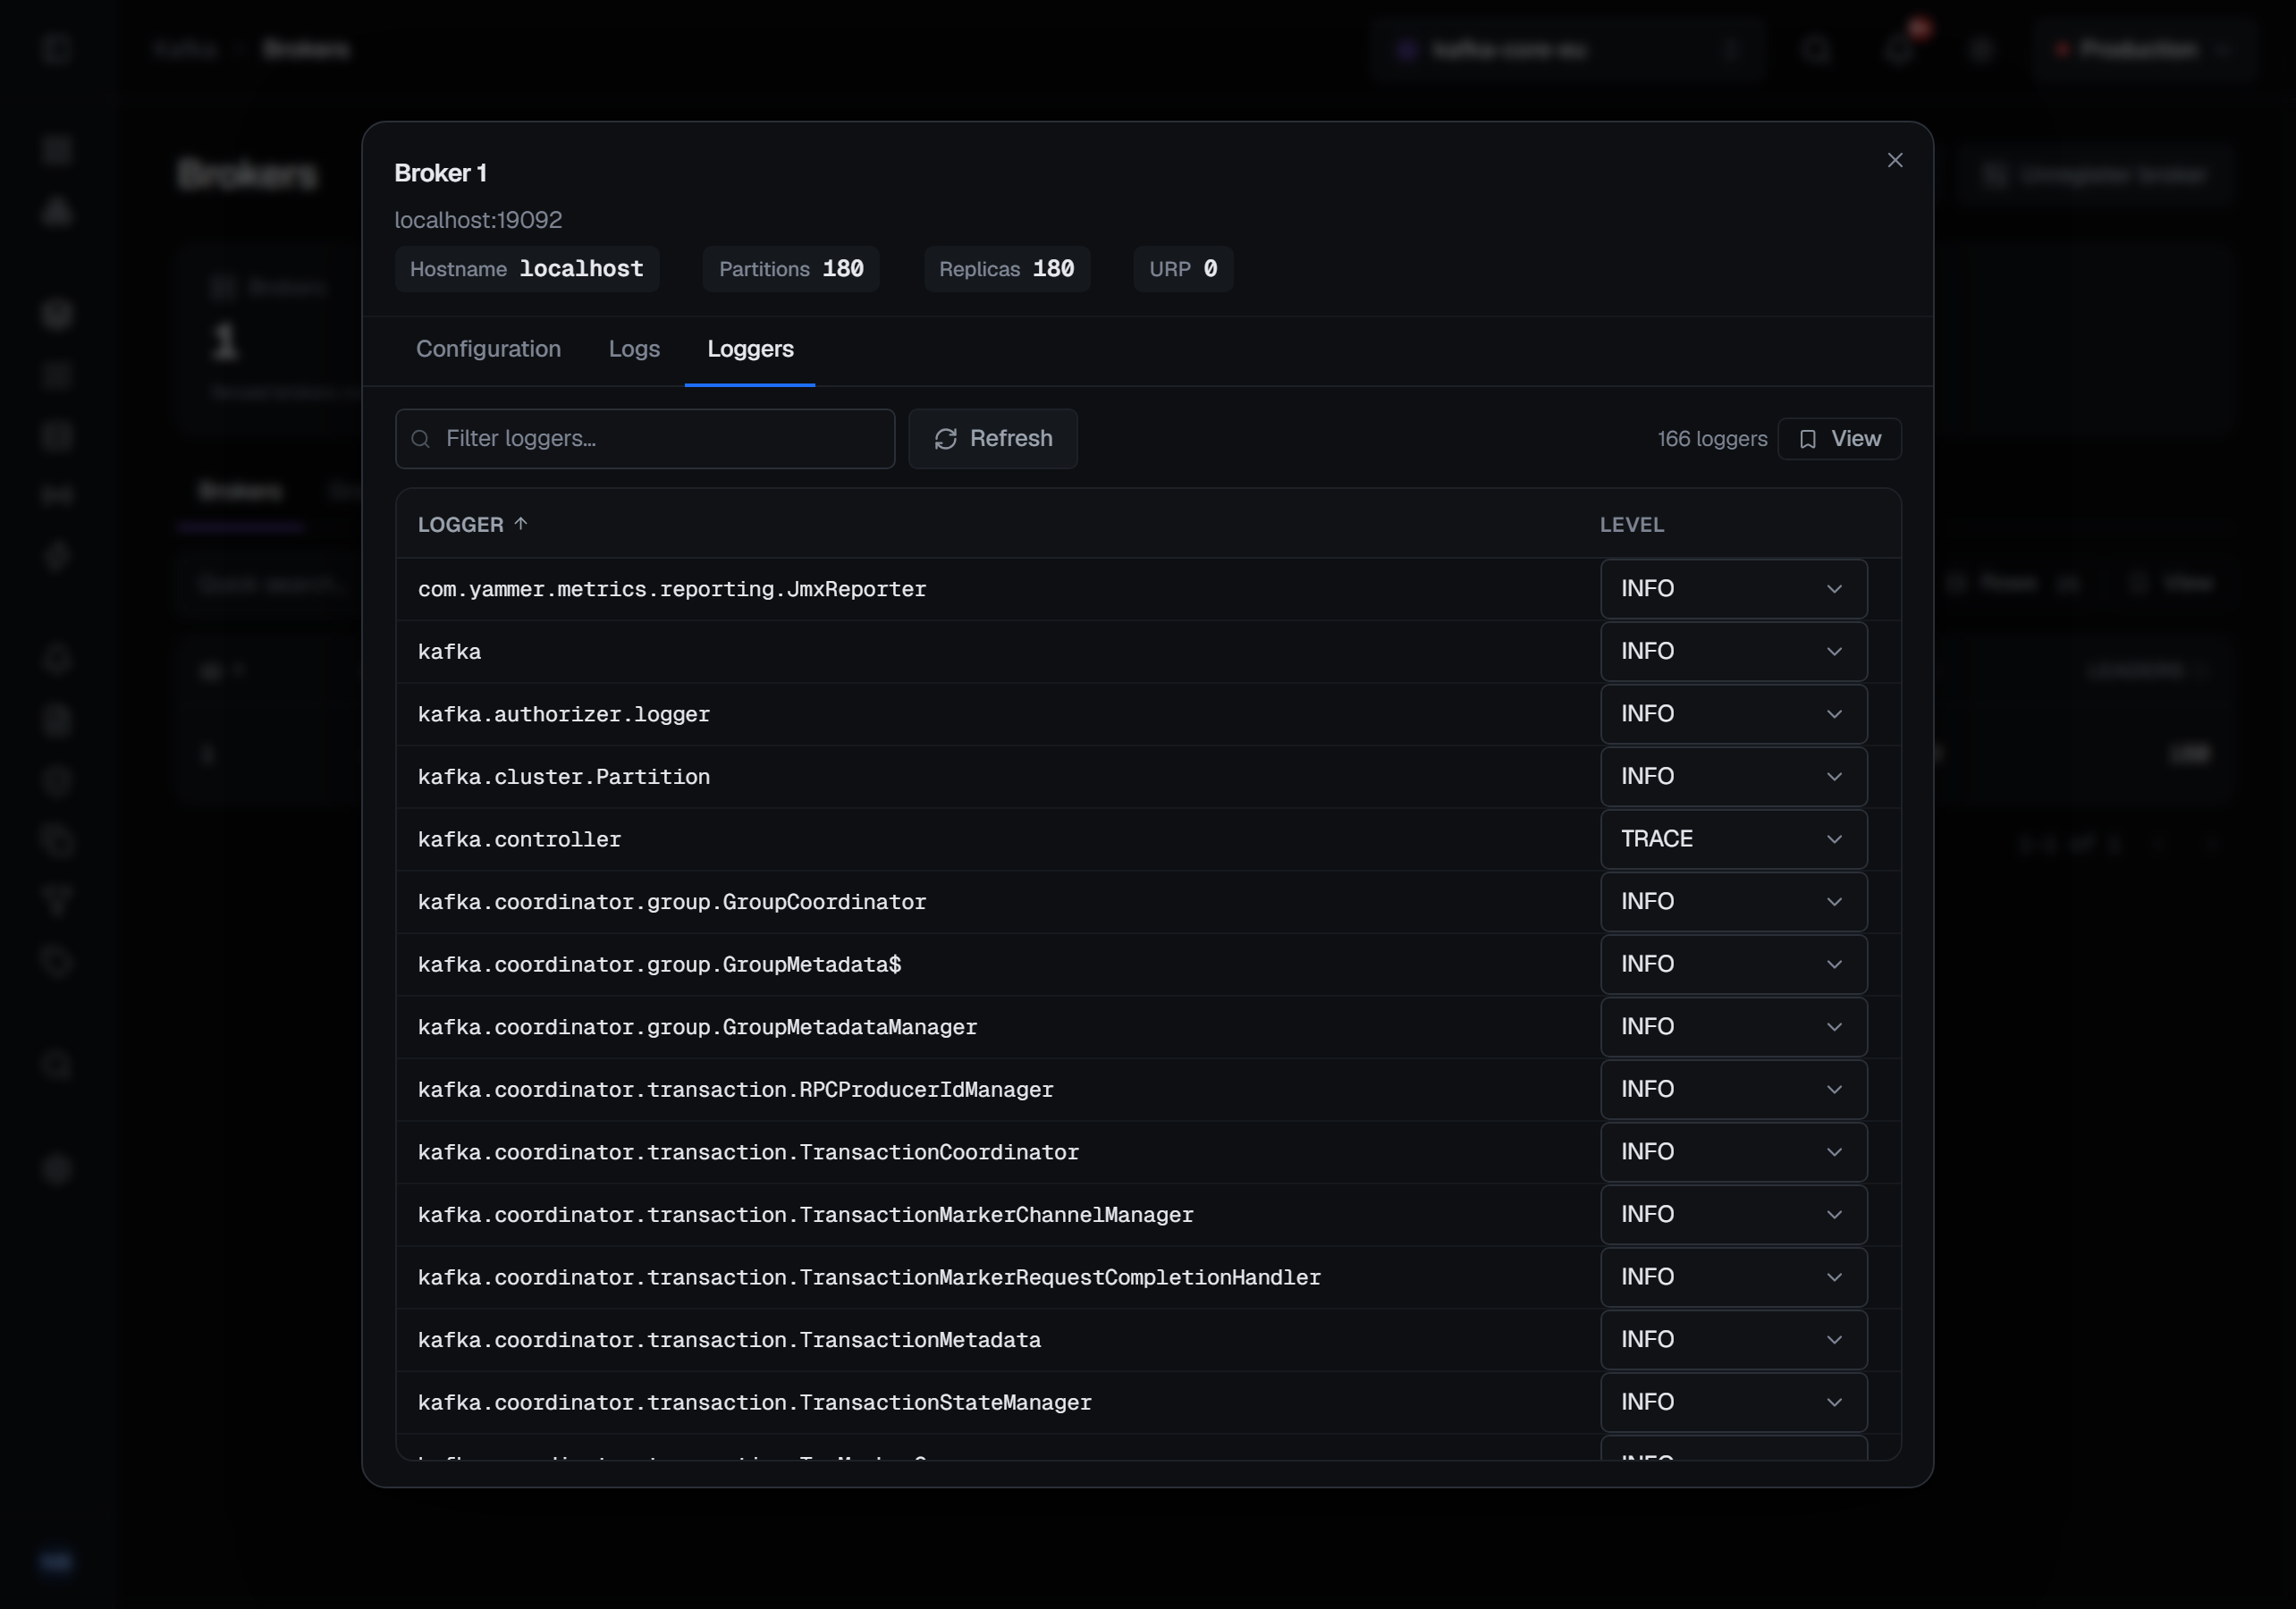
The tab needs the connection's Kafka identity to be allowed to read the broker's configuration; where it is not,
the tab is shown disabled with the reason. Changing a level needs the permission to manage the cluster, and
ALTER_CONFIGS on the cluster for the connection's identity; without it, the level lists are disabled with that
reason on hover.
The broker's own figures
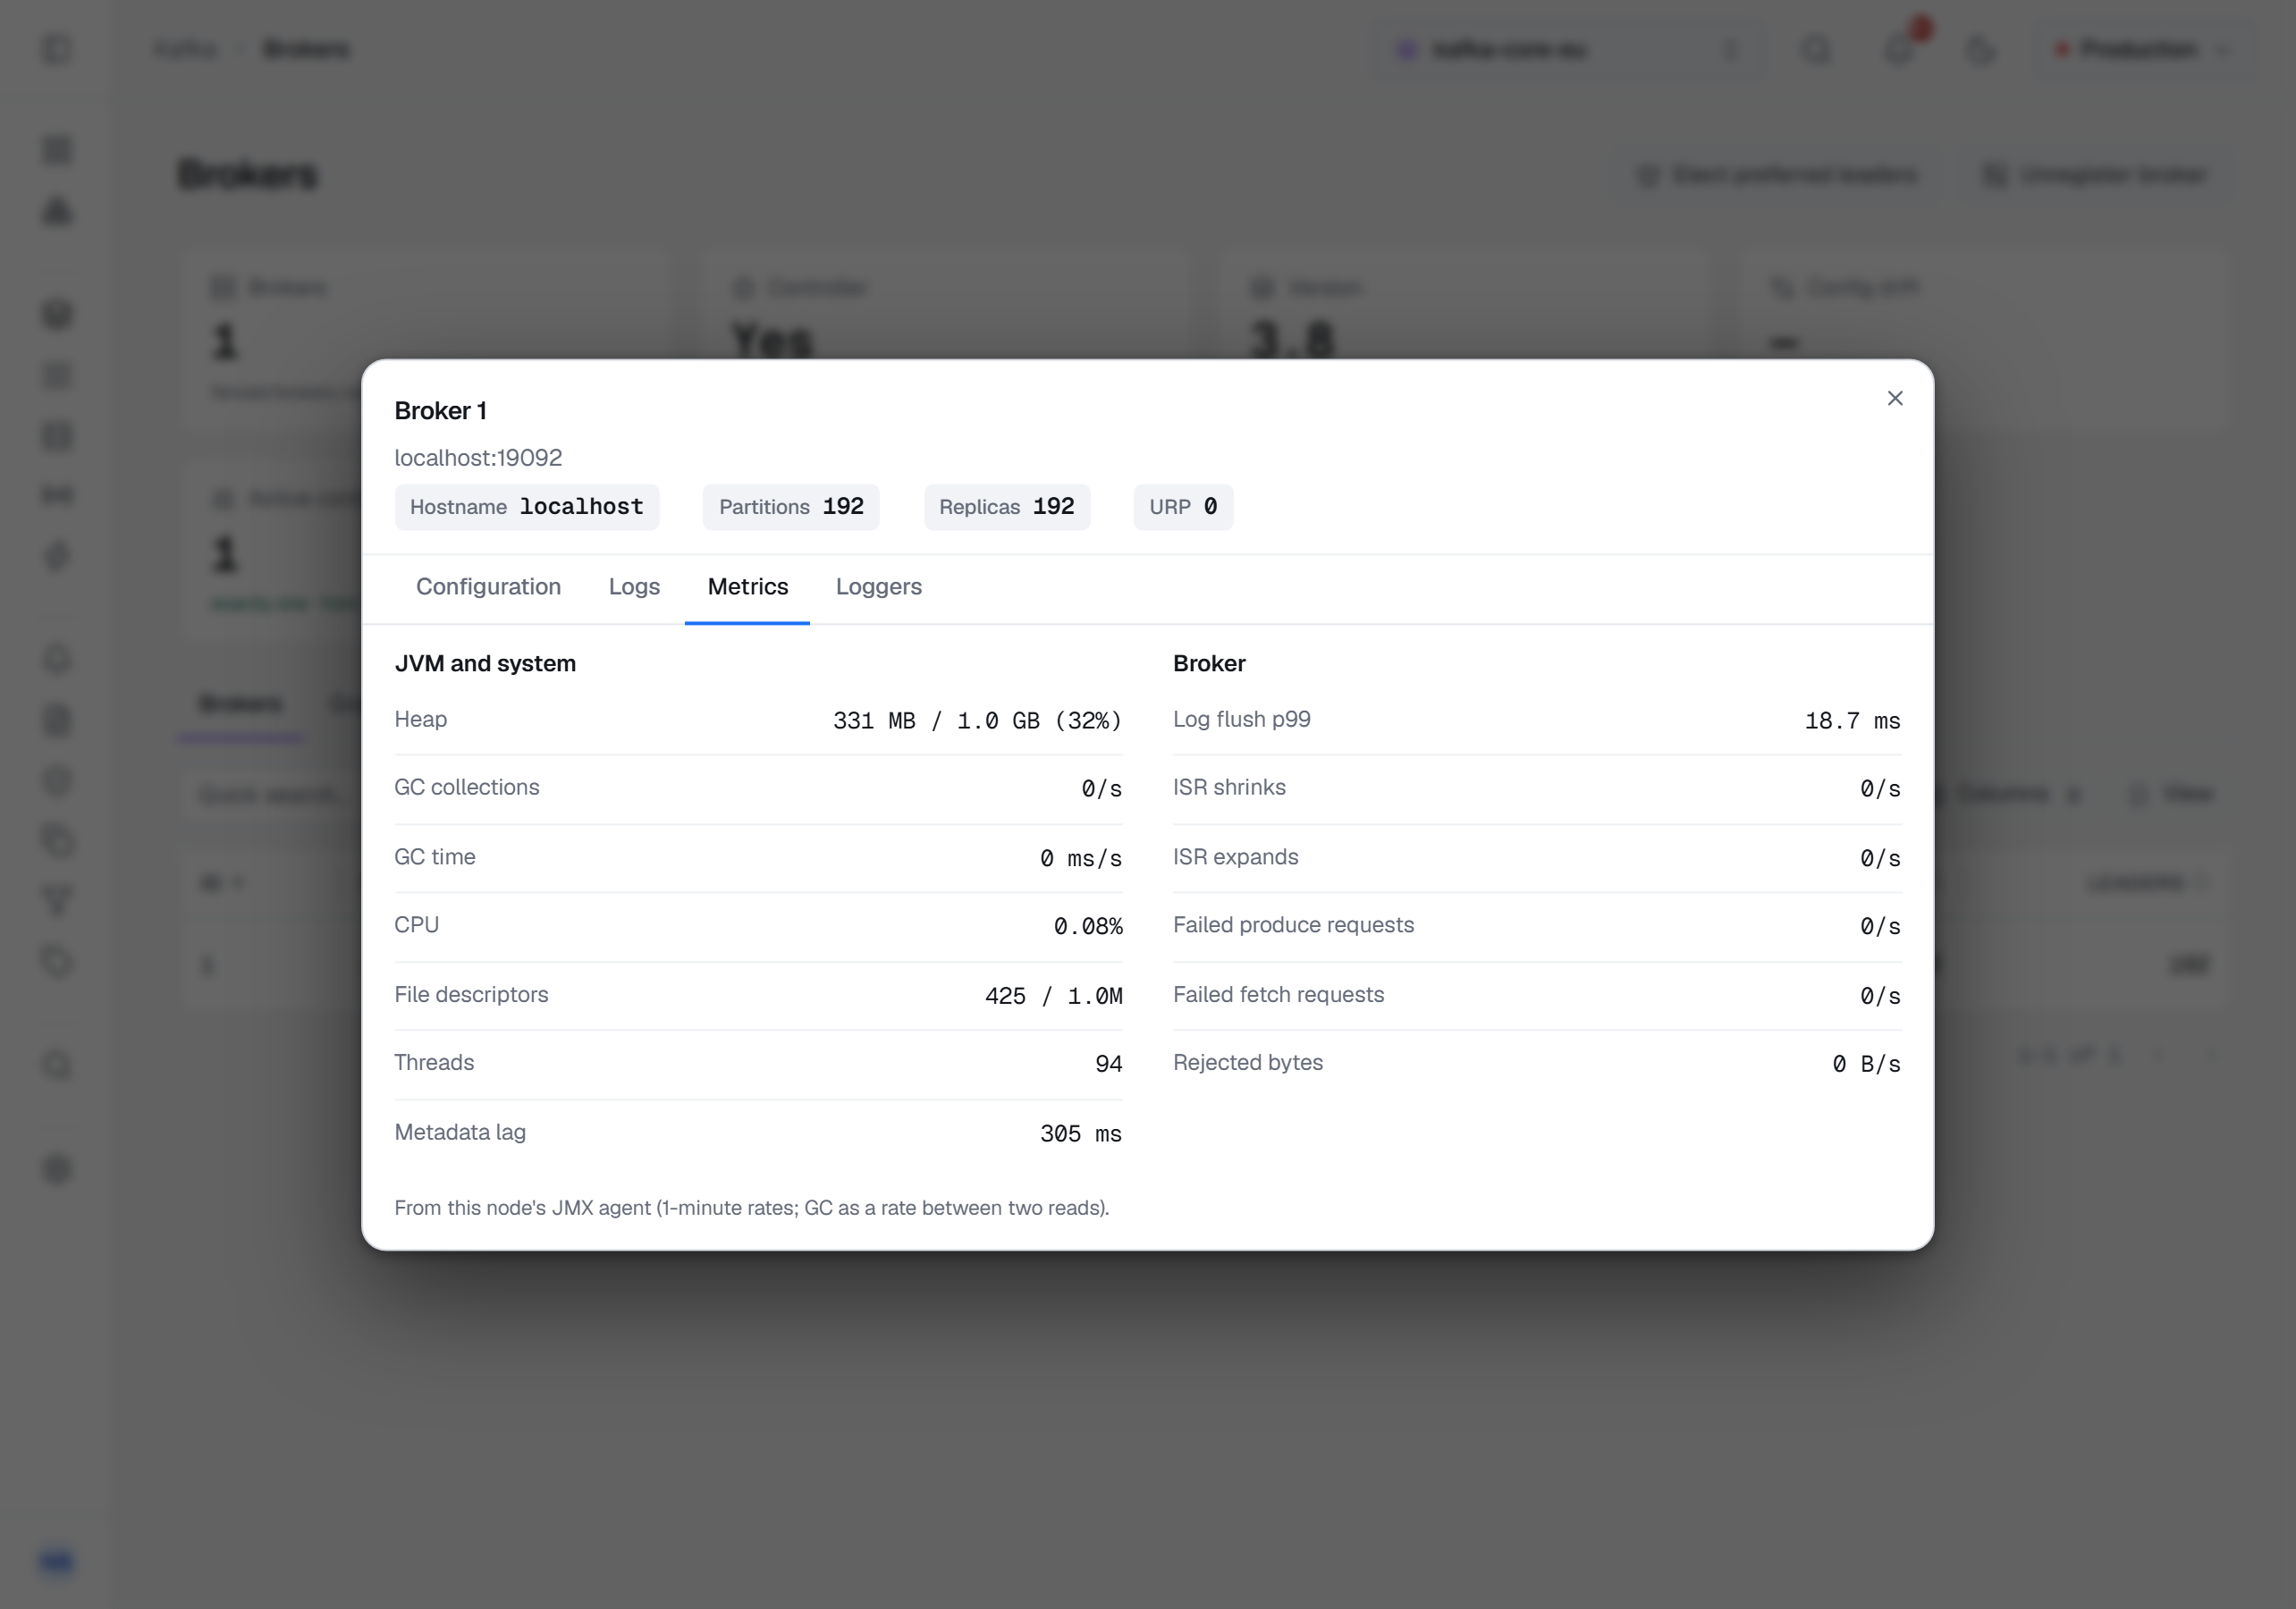
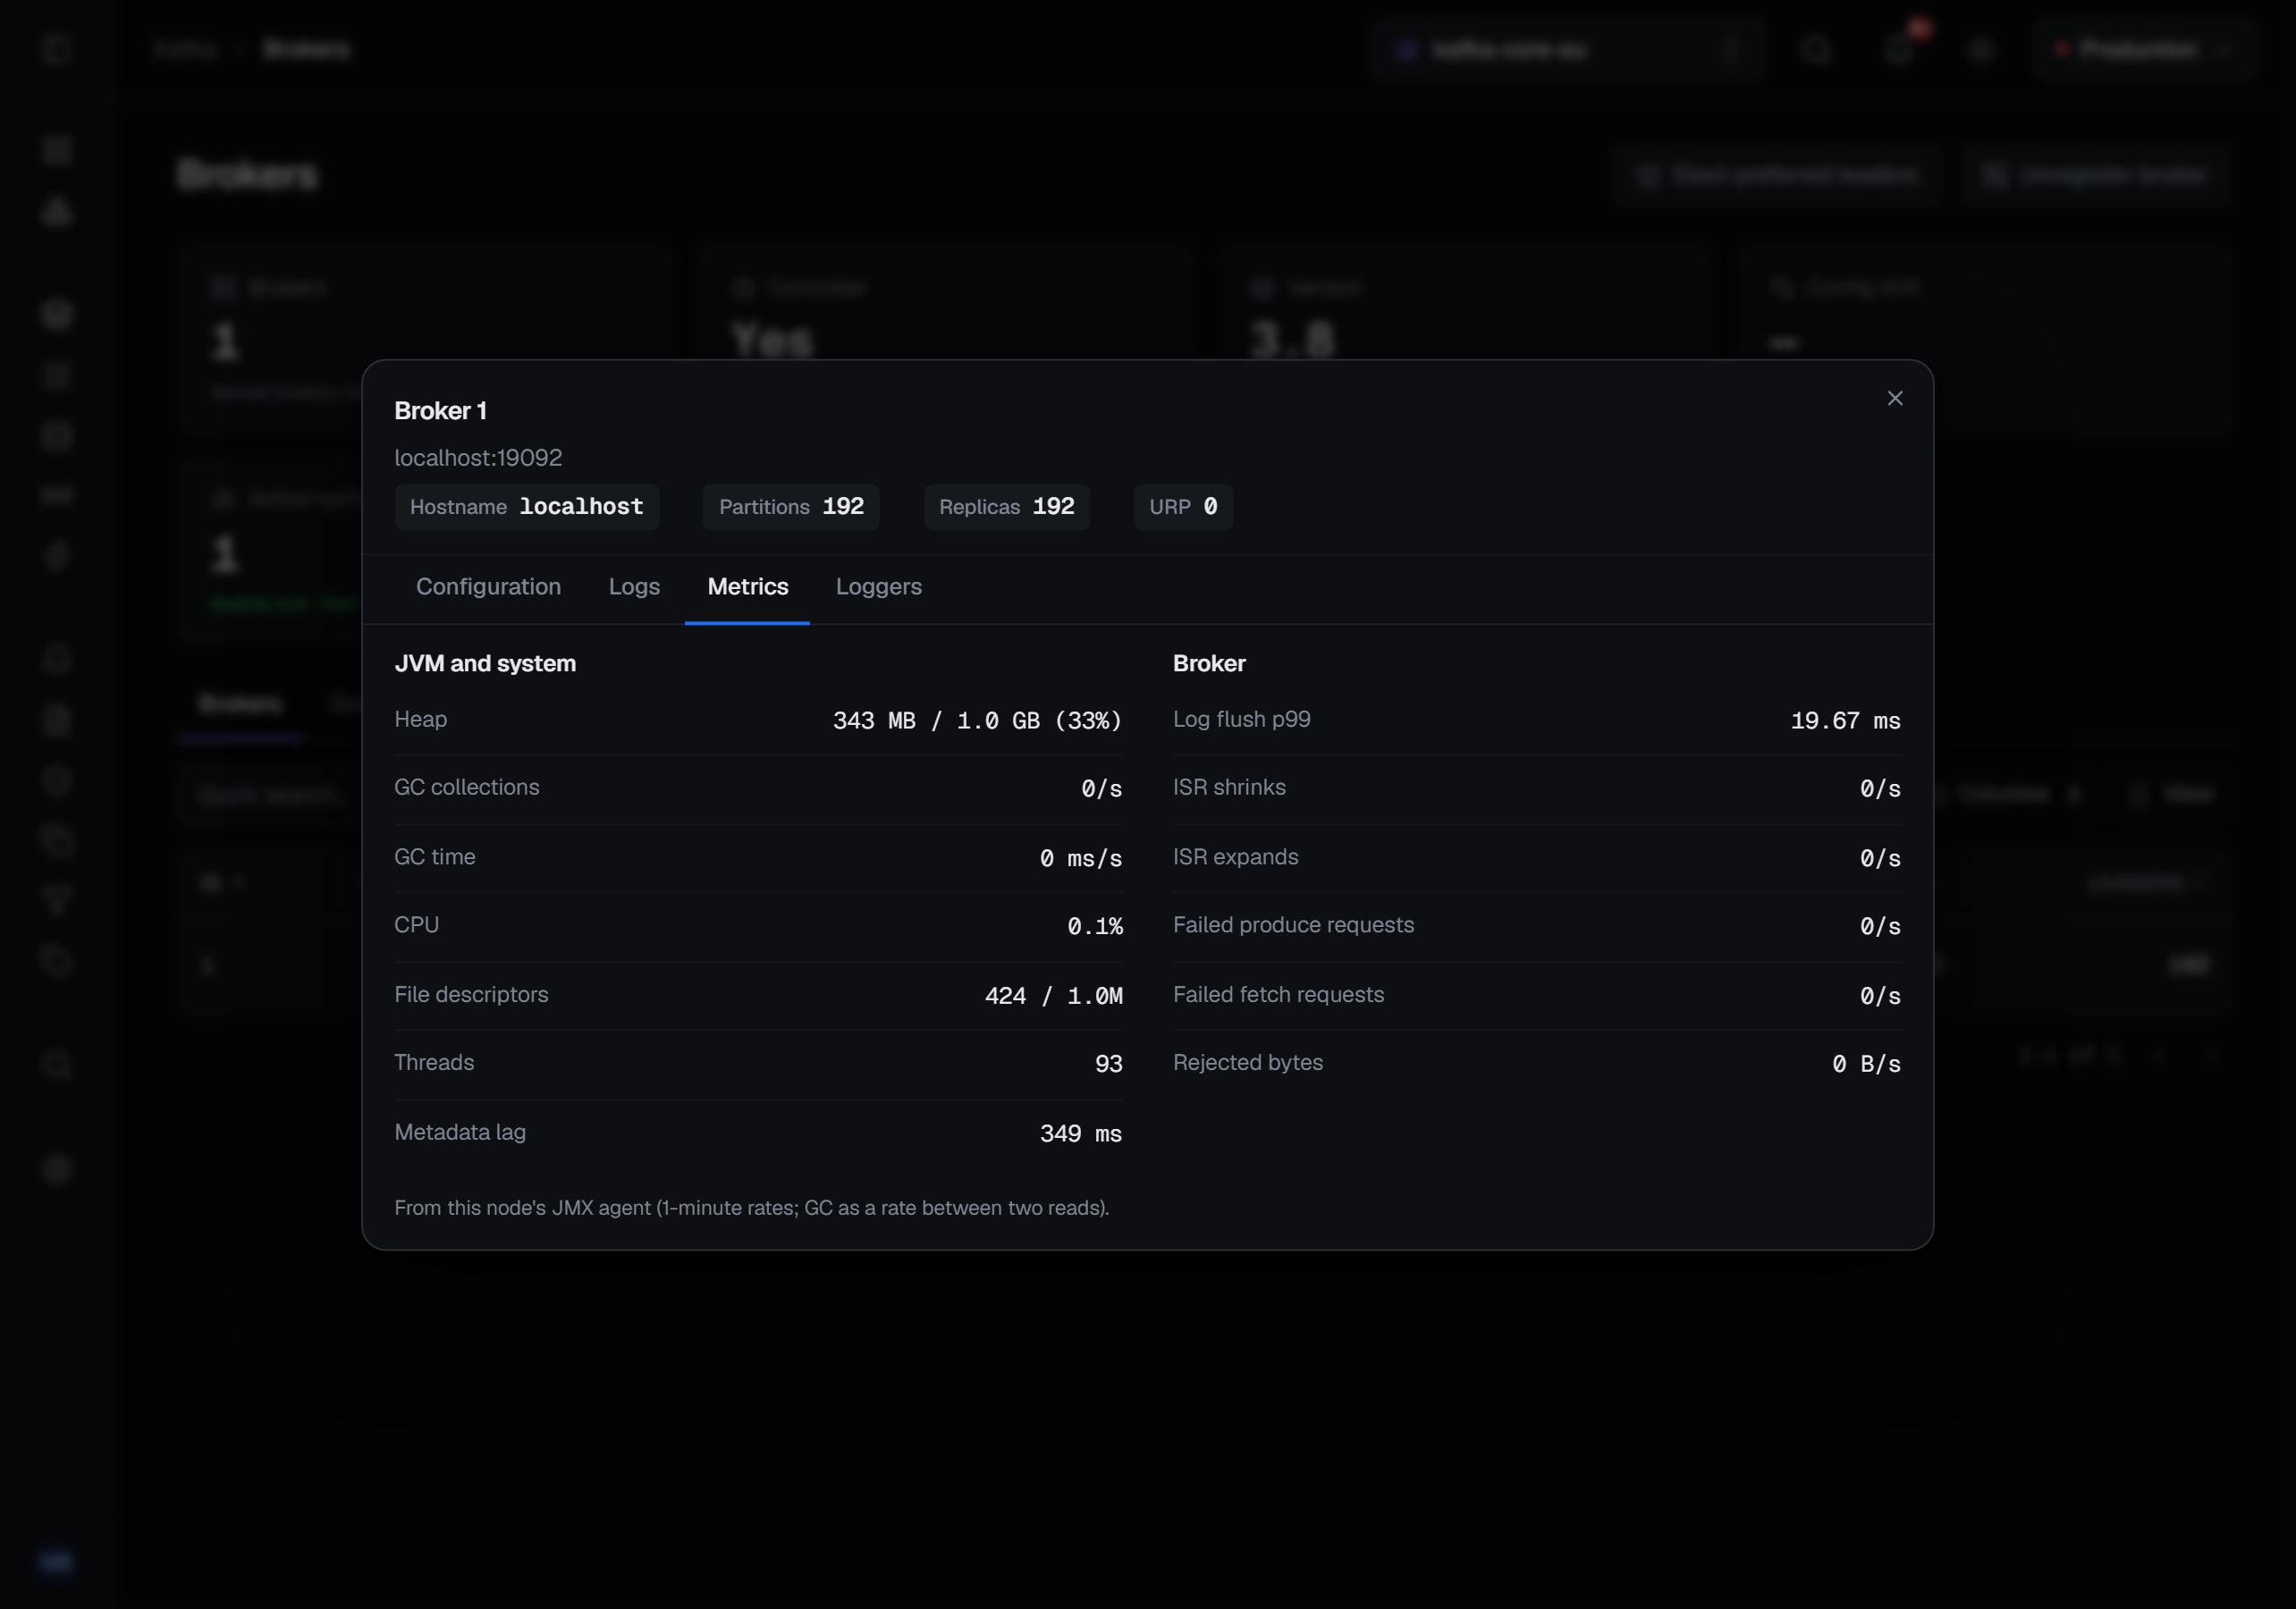
The detail's Metrics tab shows what the broker's JVM and the broker itself report over JMX: heap used of its maximum, how often the garbage collector runs and how much time it takes, CPU, open file descriptors against the limit — flagged once they reach 80% of it — threads and how far behind the cluster metadata it is; and, for a broker, the 99th-percentile time of a log flush, how often its in-sync replica sets shrink and expand, failed produce and fetch requests and bytes rejected. A controller that is not a broker has no row here; its figures open from its row on the Quorum tab. A figure the node does not publish reads a dash, never 0; a node whose agent did not answer says so.
Graphs
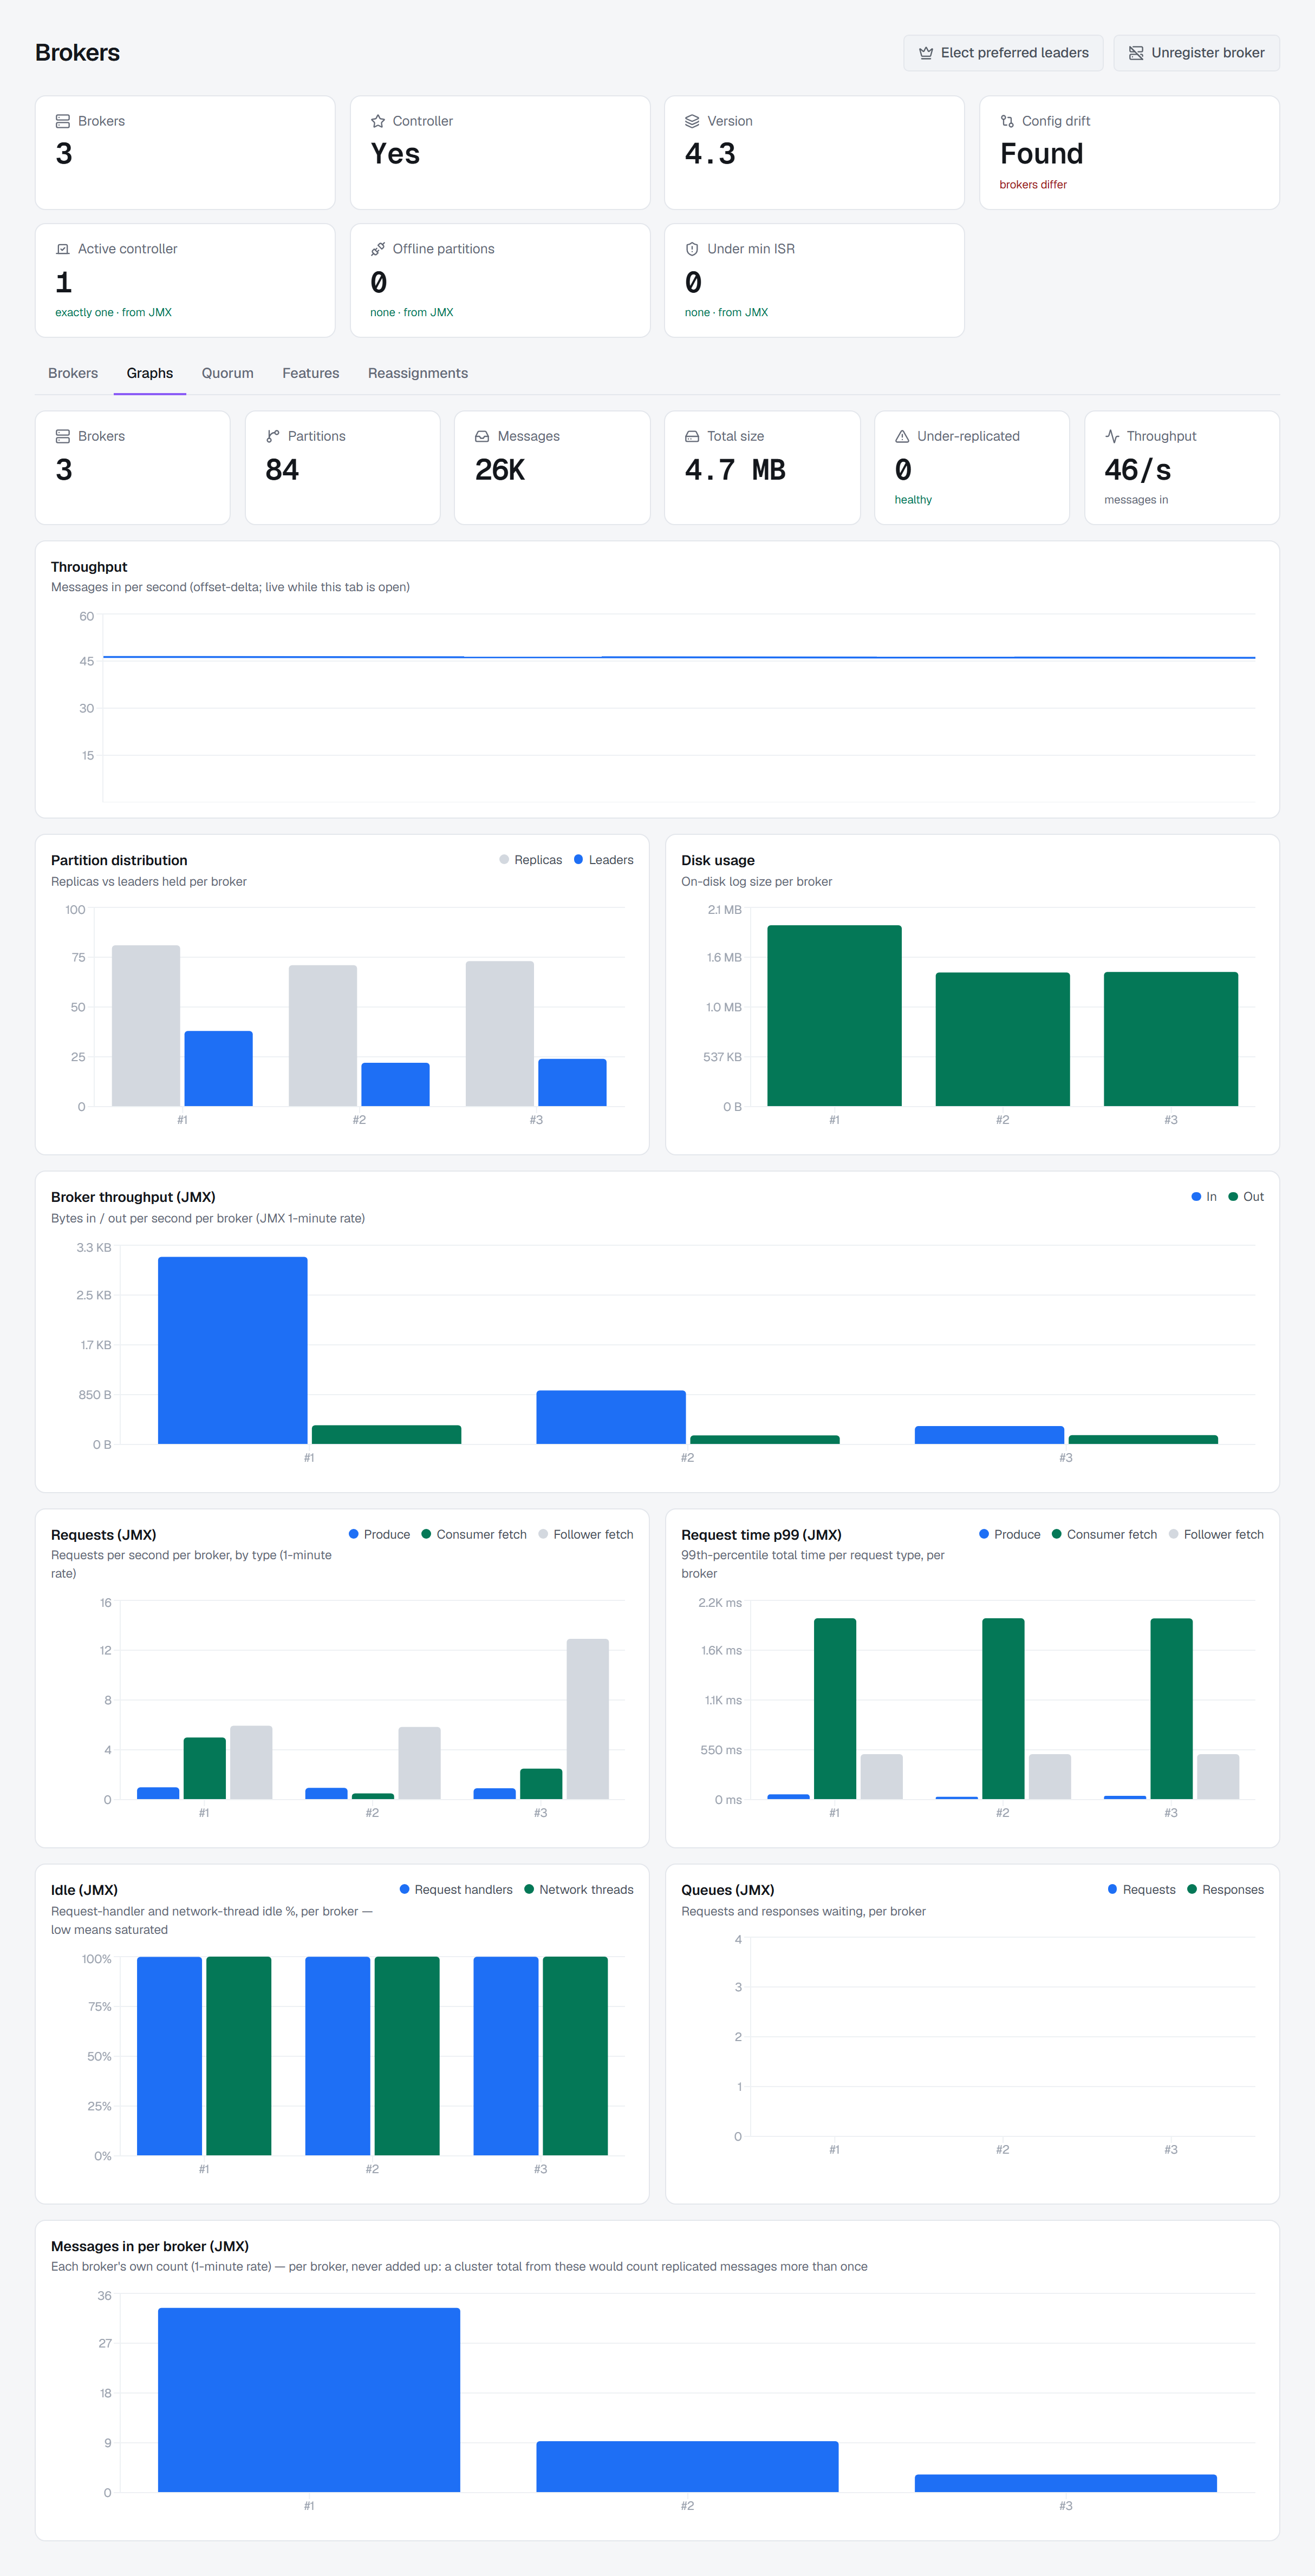
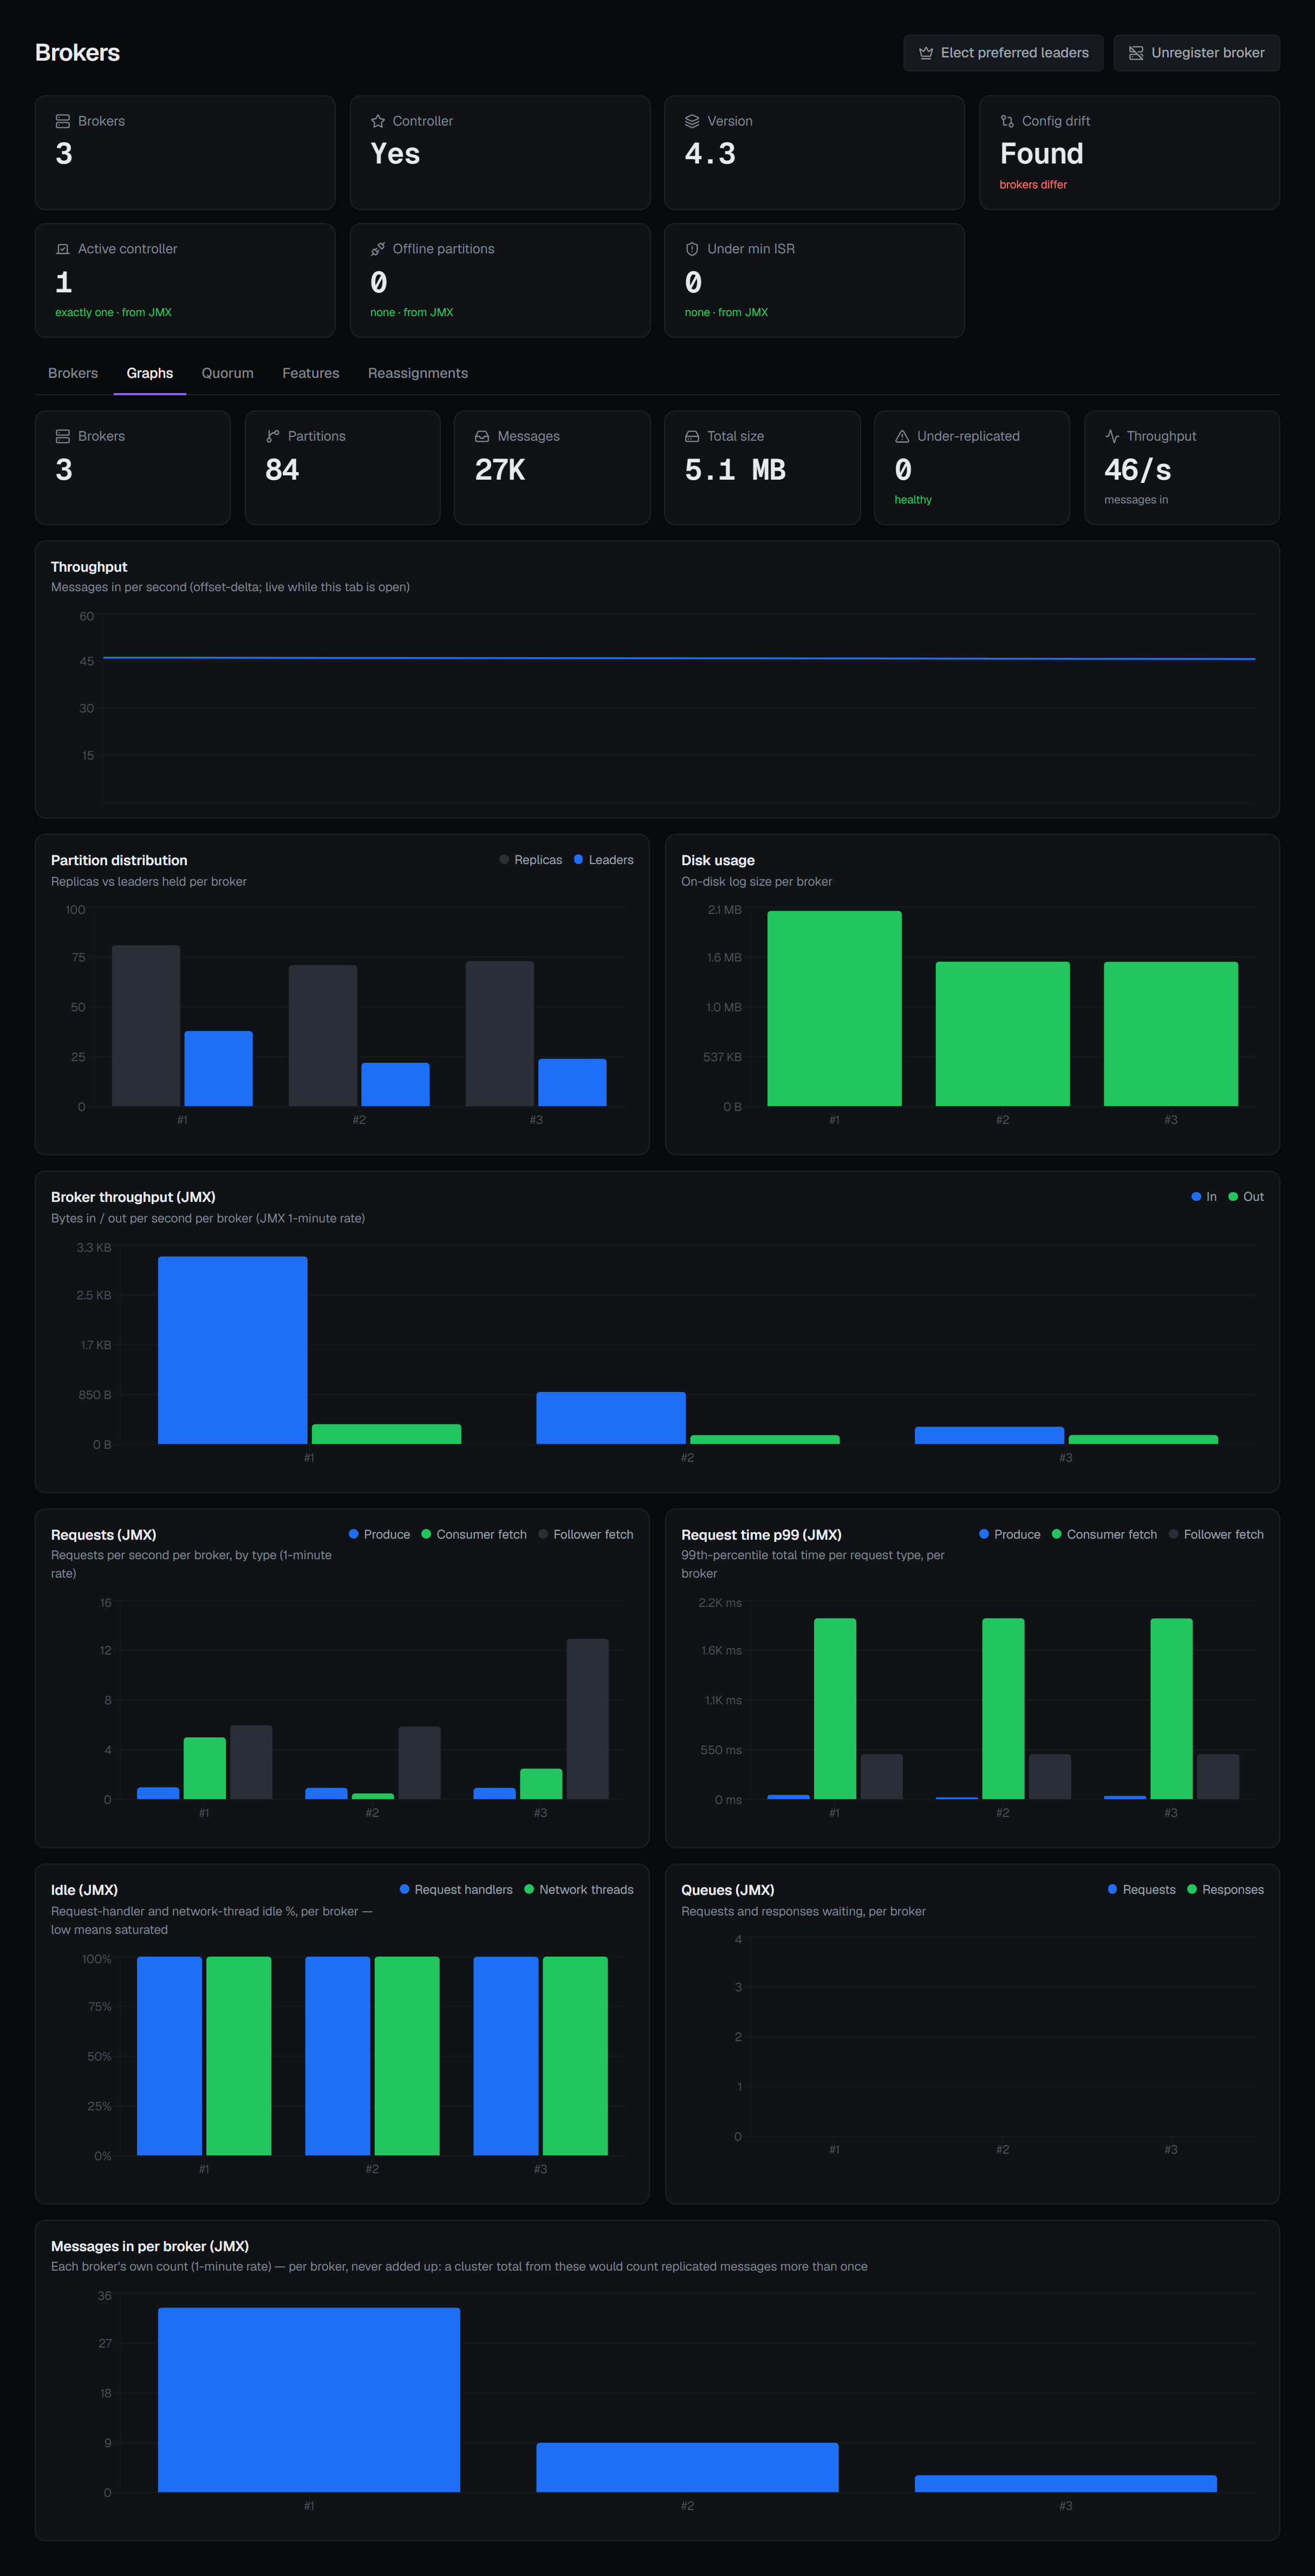
The Graphs tab draws what the list implies: partition distribution across brokers as replicas and leaders, on-disk size per broker, and cluster throughput.
Throughput is measured in messages per second, and it is derived rather than reported — BROKA samples the sum of every partition's latest offset twice and divides the difference by the elapsed time. An offset is a message count, which is why the figure is messages and not bytes, and why it appears only after the second sample has landed rather than guessing from the first.
Everything so far needs nothing but the Kafka Admin API — no agent, no exporter, no JMX.
With JMX the tab adds, per broker: its byte rates in and out, requests per second by type (produce, consumer fetch, follower fetch), the 99th-percentile time of each, how idle its request handlers and network threads are — low means saturated — and its request and response queues. Messages in is drawn per broker and never added up: a total from these would count a message once for every replica that wrote it. Each JMX chart without figures says where JMX is set up instead of drawing an empty chart.
The tab reads the cluster every 15 seconds while it is open. Each reading describes every topic and every broker's disks, so BROKA takes one reading of a cluster at a time and hands it to everyone who asks within ten seconds — several people on the Graphs tab, and the alert rules on the same cluster, cost the cluster one reading between them. The reading counts against the allowance of 30 live reads a minute per person that a consumer group's detail and the lists' Refresh also draw on.
Adding JMX
The Admin API says what the cluster holds; it cannot say whether exactly one controller is active, how long produce requests take or how full a broker's heap is. Each broker measures those itself and publishes them over JMX. With JMX set up, BROKA reads a fixed list of them — nothing outside that list is ever asked for — and they unlock:
- the Health tiles and the State and Offline log dirs columns;
- the request, utilisation and per-broker charts on the Graphs tab;
- each broker's Metrics tab, and a controller's from the Quorum tab;
- a topic's own bytes in and out and messages in, on its detail;
- the JMX figures as alert metrics, and the JMX metrics row of the connection's Supported features panel.
JMX metrics lists every figure, what each needs and what it costs.
Set it up once the cluster is registered: on Kafka ▸ Clusters, open the cluster's ⋮ menu and choose JMX, beside Kafka Connect and Schema Registry.
- JMX port — BROKA asks each broker's agent at the broker's advertised host on this port.
- Broker addresses — one row per broker, and one per KRaft controller that is not a broker, listed after them as
Controller N. Behind a load balancer every broker advertises the
balancer — the same host on different ports — and a balancer does not forward JMX. Give each such
broker the address its agent is reached at, typically its own IP and port (
10.0.0.11:9999, or[fd00::11]:9999). A broker with an address of its own is asked there; the others at the port above. - Username and password — for an agent that asks for them. The password is stored encrypted and never shown again; changing an address without typing it again clears it, so it is never sent somewhere it was not given for.
Test connection asks every broker's agent once and says, for each, whether it answered and, if
not, why: nothing listening, an unknown host, a refused user name or password, or the agent answering
and then pointing to an address BROKA cannot reach. That last one is the broker's
java.rmi.server.hostname: JMX answers at the address you gave, then hands back a second address of
its own, so start each broker with -Djava.rmi.server.hostname set to the address BROKA should use
(and com.sun.management.jmxremote.rmi.port equal to the JMX port, so one port is enough).
BROKA reads every node — each broker, and each controller that is not one — at once, waiting three seconds at most for all of them together, so an unreachable node cannot slow the page whatever the number of nodes. It keeps each node's connection open between readings, and a node that did not answer is left alone for thirty seconds before it is asked again — its figures are missing until then. One node's whole list takes about 60 milliseconds and some 23 KB on the wire once its connection is open, so every figure is read on every refresh.
Without JMX everything else still works, and each place that needs it says so — a tile reads Needs JMX, a chart or a tab says where to set it up. When some nodes answered and others did not, each node's own figures are shown and a figure for the whole cluster is not. A figure an older Kafka does not publish, or one that exists only once traffic of that kind has been seen, is a missing value, never 0. The connection's Supported features panel lists JMX metrics as available once the last reading reached a node, and otherwise says why.
The connection to a metrics port is checked before it is made: BROKA refuses to connect to link-local and metadata addresses, so a mistyped or hostile broker address cannot turn the console into a probe of its own network.
What gets recorded
A configuration change is recorded with every property before and after; a sensitive property is recorded by name only. A log level change is recorded with the level before and after. A preview writes nothing and records nothing.
Nothing here is stored
There is no metrics database behind these graphs, the tiles or the Metrics tab. Each reading — the Admin API's and JMX's alike — is taken when you ask for it; the throughput line is a handful of points held in your browser tab while you watch it, and it starts fresh when you come back. BROKA measures your brokers and shows you the answer — it does not become a second system you have to operate.