

Consumer groups and lag
Updated 3 October 2026 · applies to 1.0.0 · Community and Commercial
Consumer Groups, under Kafka in the sidebar, lists every group on the cluster with its type, state, consume rate, members and lag in messages and in time. This page says what each of those numbers measures.
Lag is the number people actually watch, and it is easy to report in a way that is technically true and practically misleading. This page says what BROKA measures, so that the number on the screen means what you think it means.
The list
Every group on the cluster, with its type, its state, how fast it is consuming, how far behind it is in messages and in time, its members and the topics it reads. Time lag starts hidden; turn it on from the column settings, where every column but the group's name can be shown, hidden or moved.
Kafka keeps three kinds of group in one namespace, and the Type column says which each row is:
- Consumer — an ordinary consumer group, on the classic protocol or the newer consumer protocol.
- Share — a share group, Kafka's queue-like group: its members share the records of a partition rather than each owning partitions of their own.
- Streams — the group a Kafka Streams application forms on the streams protocol.
The Type filter narrows the list to one kind. Share and streams groups exist only on a cluster that runs them; where a cluster does not, that type is listed in the filter disabled with the reason on hover — on Kafka 3.8, Requires Kafka 4.2. Measurements the protocol does not have are left as —. What a share or streams group's own detail shows, and which clusters have them, is on Share and streams groups.
The group names arrive first and the measurements fill in behind them, because the numbers cost a round trip each and the names do not. While a measurement is still coming the cell shows a placeholder; if it could not be taken, the cell shows —.
A group the broker could not describe is still listed. Losing a group's details is not a reason to hide the group.
The Signal column flags the two states that look ordinary in every other column, and is empty when neither applies:
- Inactive — the group has committed offsets and no live members: something consumed the topic and nothing is consuming it now. A finished job, a service scaled to zero and a group left behind by a deployment all look like this, so it is a signal, not a fault.
- Stalled — members are connected and the committed offset has not moved while records wait. BROKA raises it only after at least three readings spanning at least a minute have seen the same position, so a momentary pause does not, and it clears on the first reading after the group moves again.
A group that has never committed anything gets neither. The filter beside the search box narrows the list to Any signal, Inactive or Stalled, and a group's detail repeats its signal at the top.
Offset lag: what it counts
Offset lag is the sum, over the partitions the group has committed to, of how many records sit between its committed position and the end of the log.
The domain of that sum is worth knowing. A partition the group has been assigned but never committed to contributes nothing, as does a partition of a subscribed topic that no member currently holds. So offset lag reads as "records behind the positions this group has recorded" rather than "everything this group has left to read" — the two agree on a steadily running consumer and diverge on one that has just started, just been reset, or lost a partition.
A committed offset past the end of the log contributes zero, never a negative number.
Because of that domain, a lag of zero on a group that has never committed anything is a zero about nothing. A brand-new group and a perfectly caught-up group report the same figure. The state column next to it is what tells them apart.
Time lag: what it measures
Time lag is the gap between two record timestamps — the newest record in the partition and the record sitting at the group's committed offset — taken as the worst across the group's partitions.
That is deliberately not "how long ago this consumer stopped". A group stopped for an hour on a topic that has received nothing for an hour has a small time lag, because the newest record is also an hour old. Time lag answers "how much history is between here and the end", which is the question that tells you whether catching up is a minute of work or a weekend of it.
It is measured on a budget: BROKA reads records to find those timestamps, and it caps how long it will spend doing so across a pass. On a cluster with many groups behind, one pass does not reach them all, so the groups take turns: each pass starts where the last one stopped. A group the pass did not reach keeps the time lag measured for it last — for up to ten minutes — and hovering the figure says how long ago that was (Read 3m ago). A figure with nothing behind it was measured with the rest of the row. A group never measured, or last measured more than ten minutes ago, shows —.
When the probe cannot be taken at all, the answer is — and not 0. A zero here would mean
"caught up", and that is a claim BROKA only makes when it measured it.
Consume rate
Consume rate is derived the same way produce rate is: the difference between two readings of the group's committed positions, divided by the time between them. It needs no exporter, no JMX and no agent — and it needs two readings, so it is blank on the first. A reading taken too close to the last one to divide by — two people refreshing a second apart — shows the rate the last reading gave rather than starting over. Each connection keeps its own readings, however many topics and groups the estate has, so the rate keeps being measured on a large one.
One group in detail
Clicking a group opens its detail. Its tabs are read live rather than from the snapshot; the state and the two lag figures at the top are the ones the list row showed, and the consume rate beside them is the detail's own. A live read costs the cluster a describe of the group and its offsets, so a group's detail, the list's Refresh and the Brokers page's Graphs tab share one allowance of 30 live reads a minute per person; past it, the read says to try again in ten seconds. Several people opening the same group at once cost the cluster one read. It has four tabs:
- Topics — each topic the group has committed offsets on: how many partitions, how much lag, how fast.
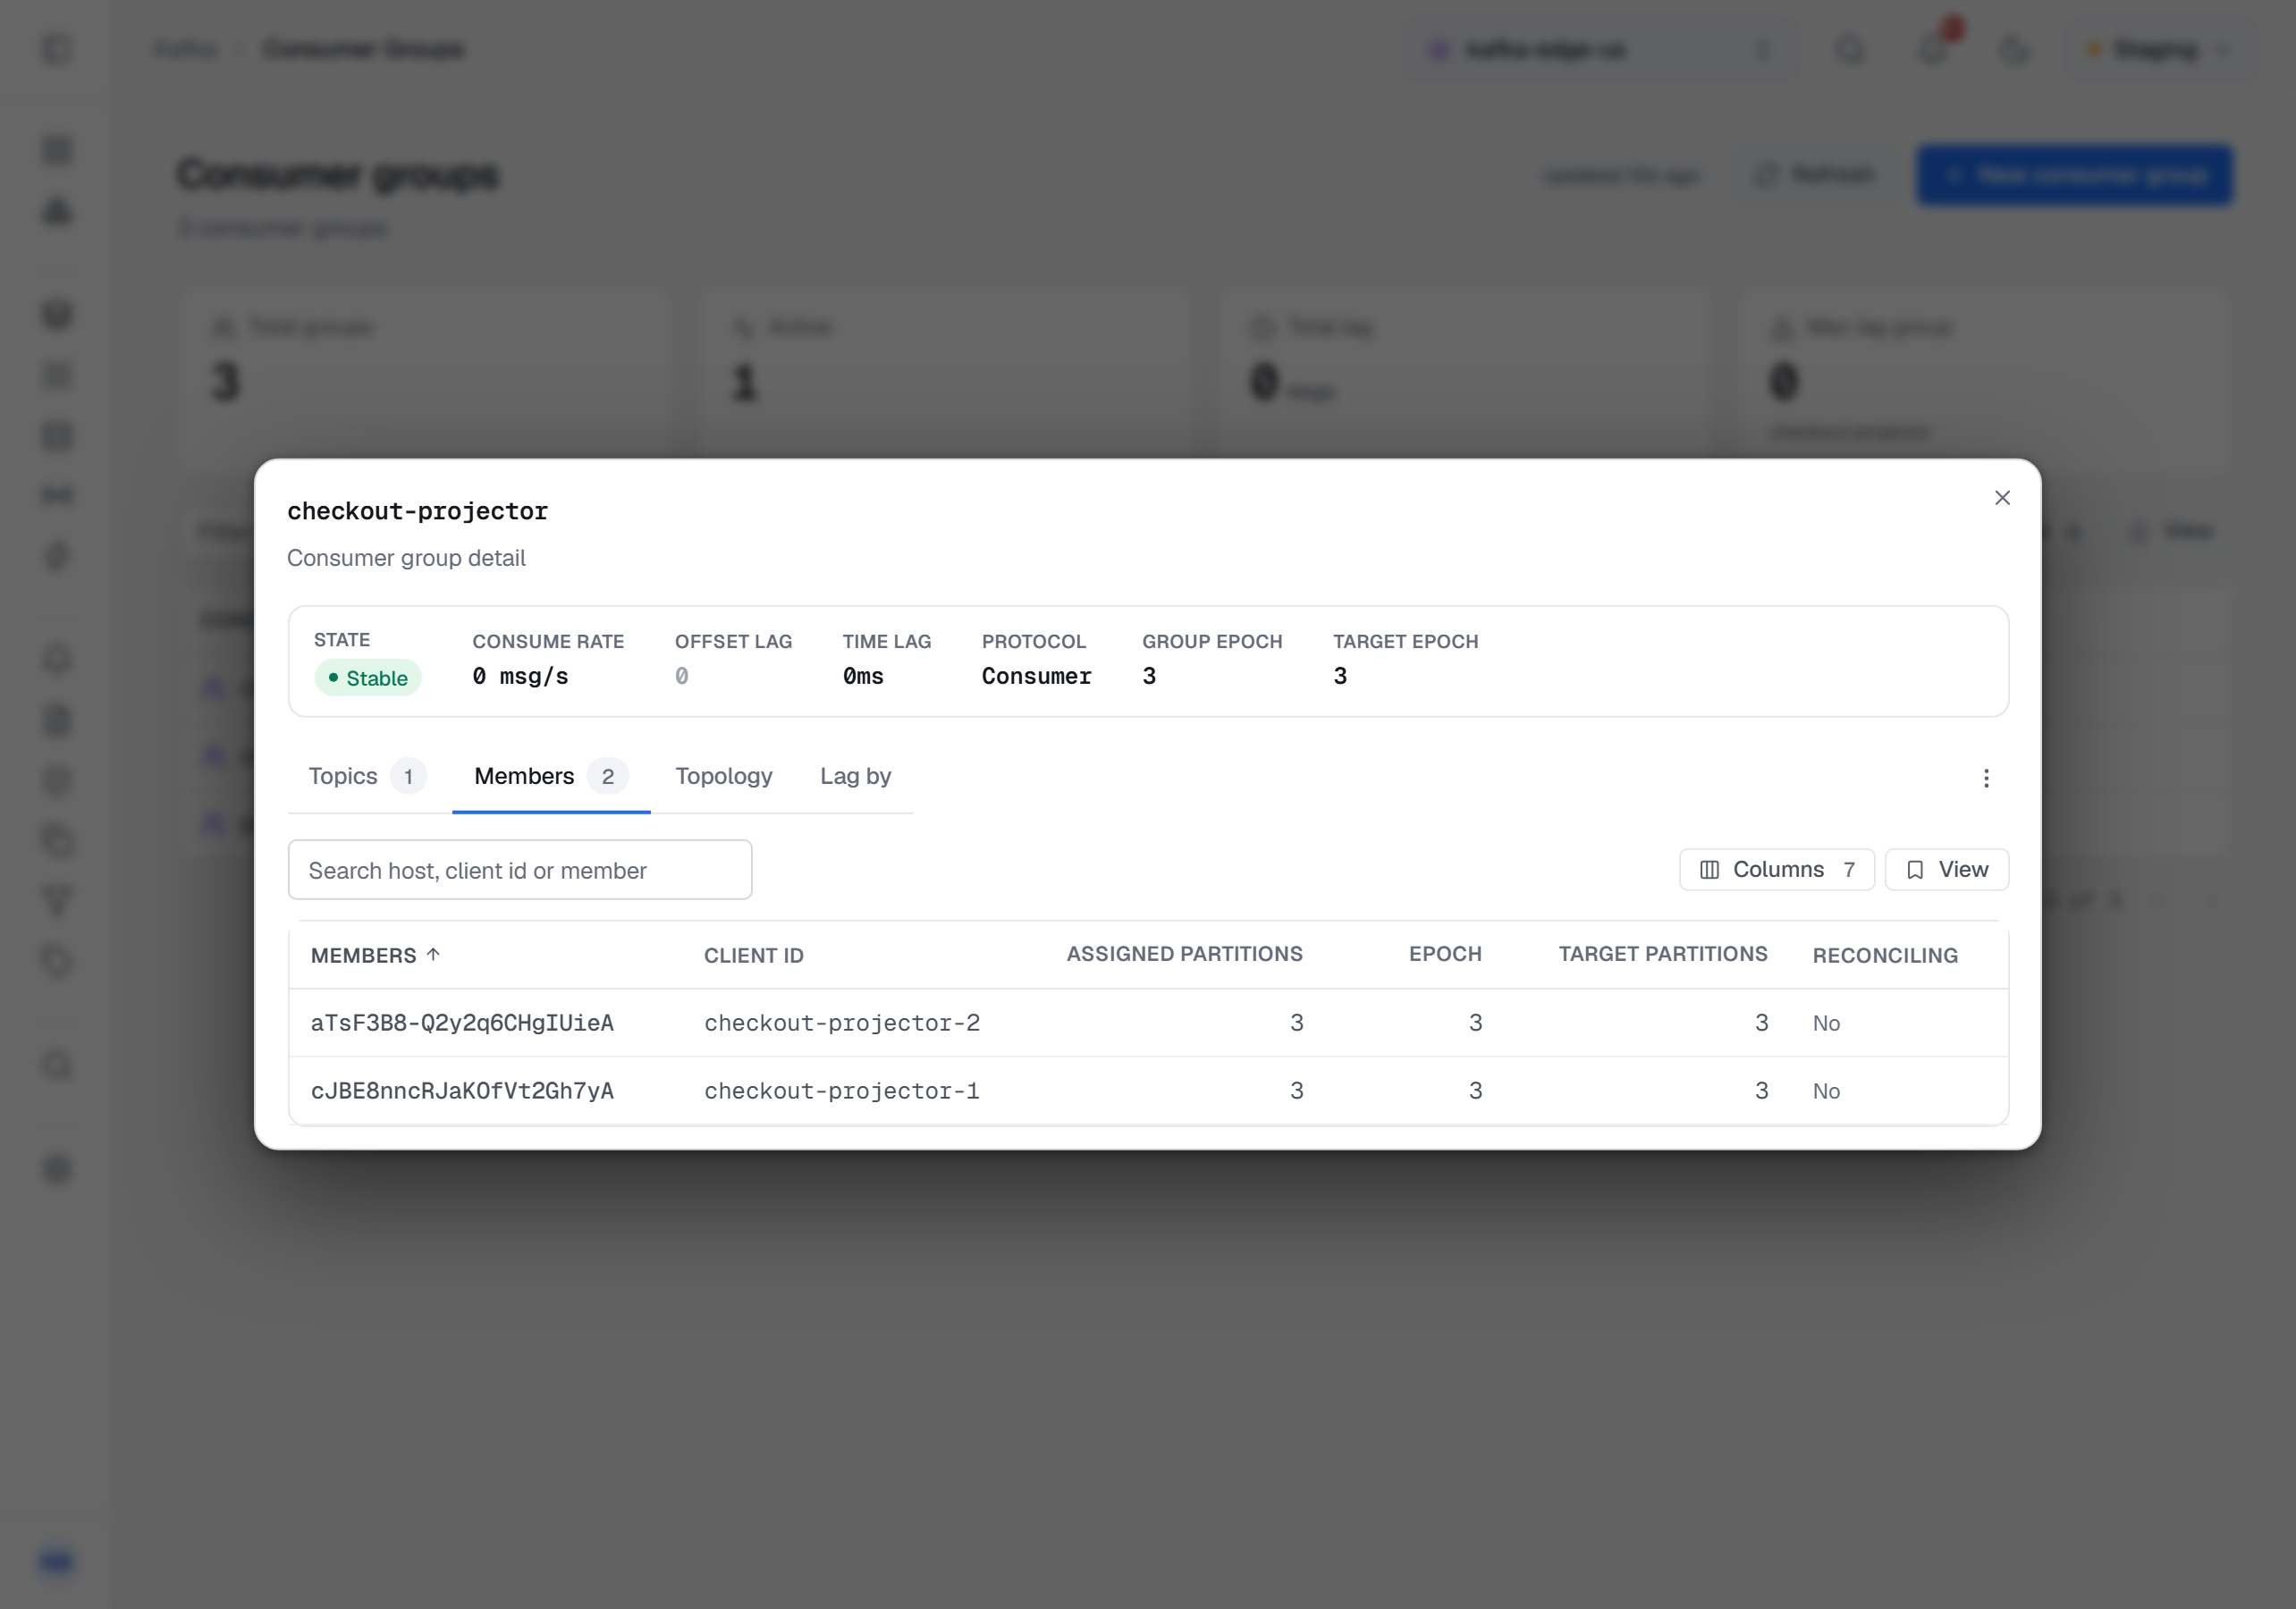
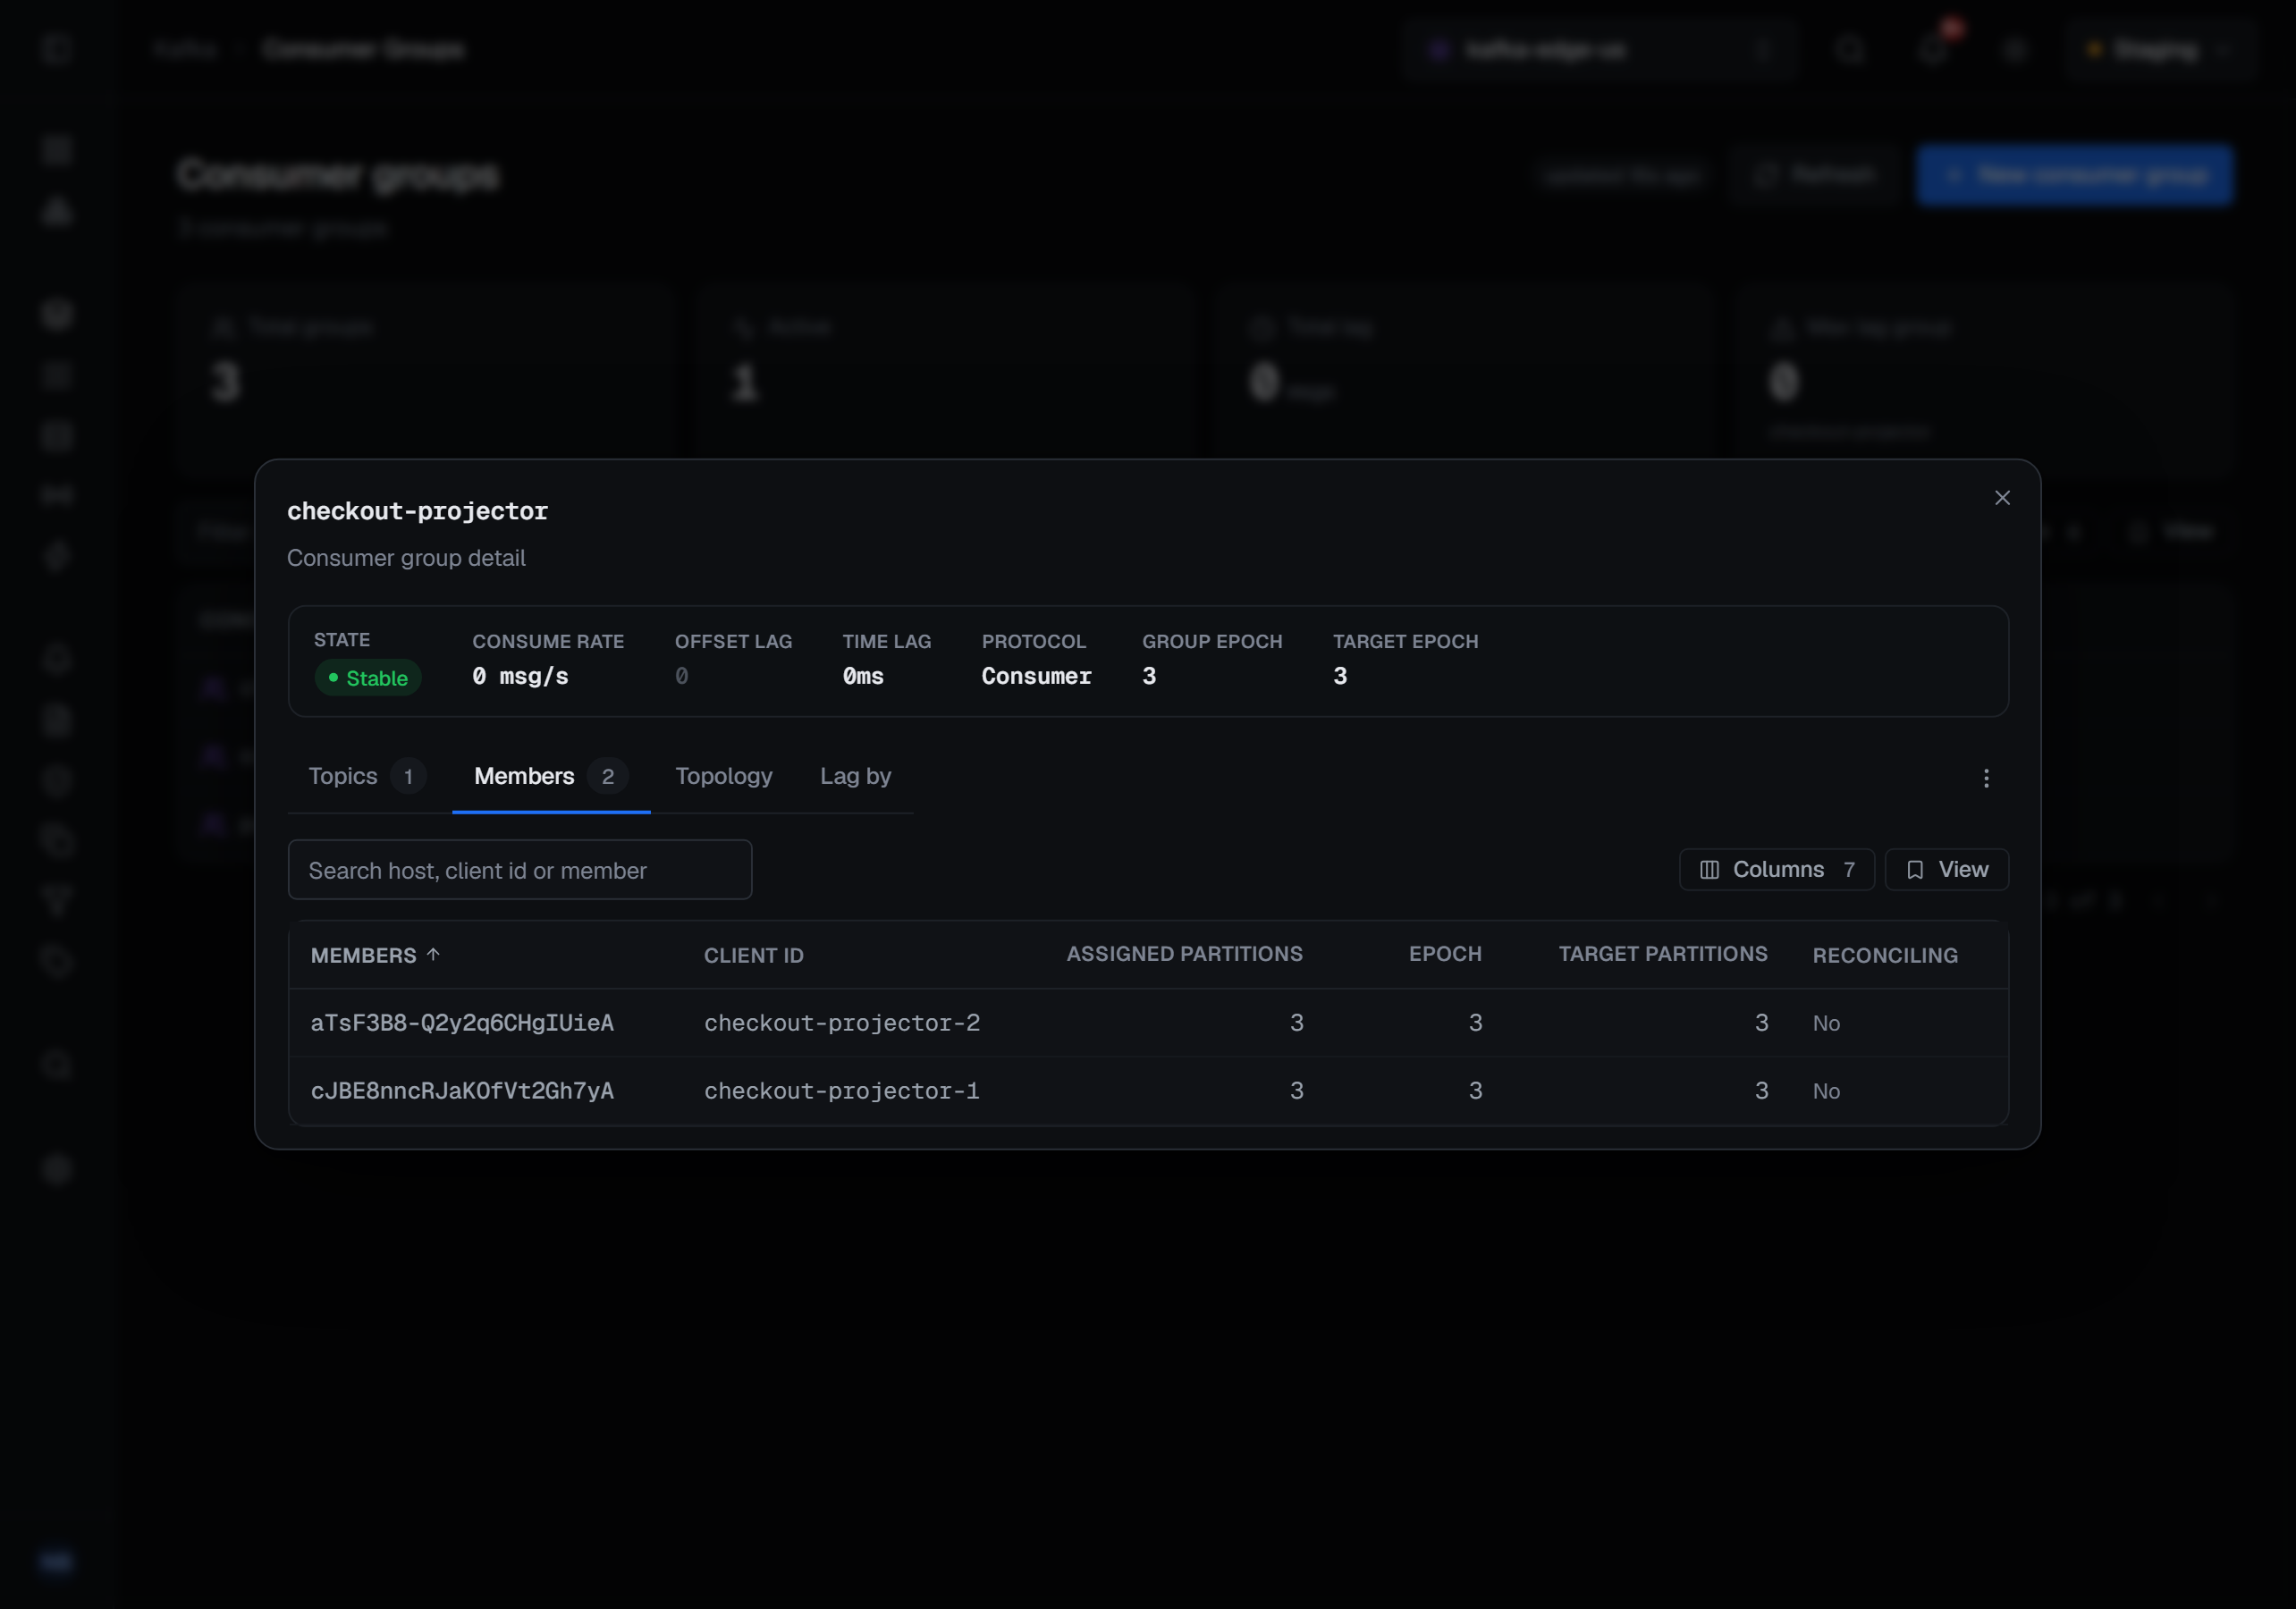
- Members — each live member with its client id, host, static id (or Dynamic), how many partitions it is assigned, its consume rate and its lag. This is the view that finds the one consumer instance that is stuck while its siblings are fine; the search box matches a host, a client id or a member id.
- Topology — one card per member, headed by its host, client id, static id and member id and its own lag, holding the partitions it owns as chips grouped by topic. Each chip is coloured by its lag, and hovering it gives the committed and end offsets. Committed partitions that no live member holds get a card of their own, Unassigned: a consumer left and the rebalance has not landed, or the group is idle — their lag is real and belongs to no machine. A member assigned partitions the group has never committed on says +N assigned with no committed offset, rather than drawing chips with a lag nobody knows.
- Lag by — the same lag summed three ways, by Topic, by Broker (the leader of each partition, with its address) or by Member host, each row with its partition count and lag, largest first. Under Member host the partitions no live member holds are summed as Unassigned, so the breakdown still adds up to the total; under Broker the partitions that have no leader are summed as No leader — offline, whoever consumes them. The Broker view needs a separate read of the partition leaders, and when that read fails the view is left empty and says so, rather than showing a broker with less lag than it has.
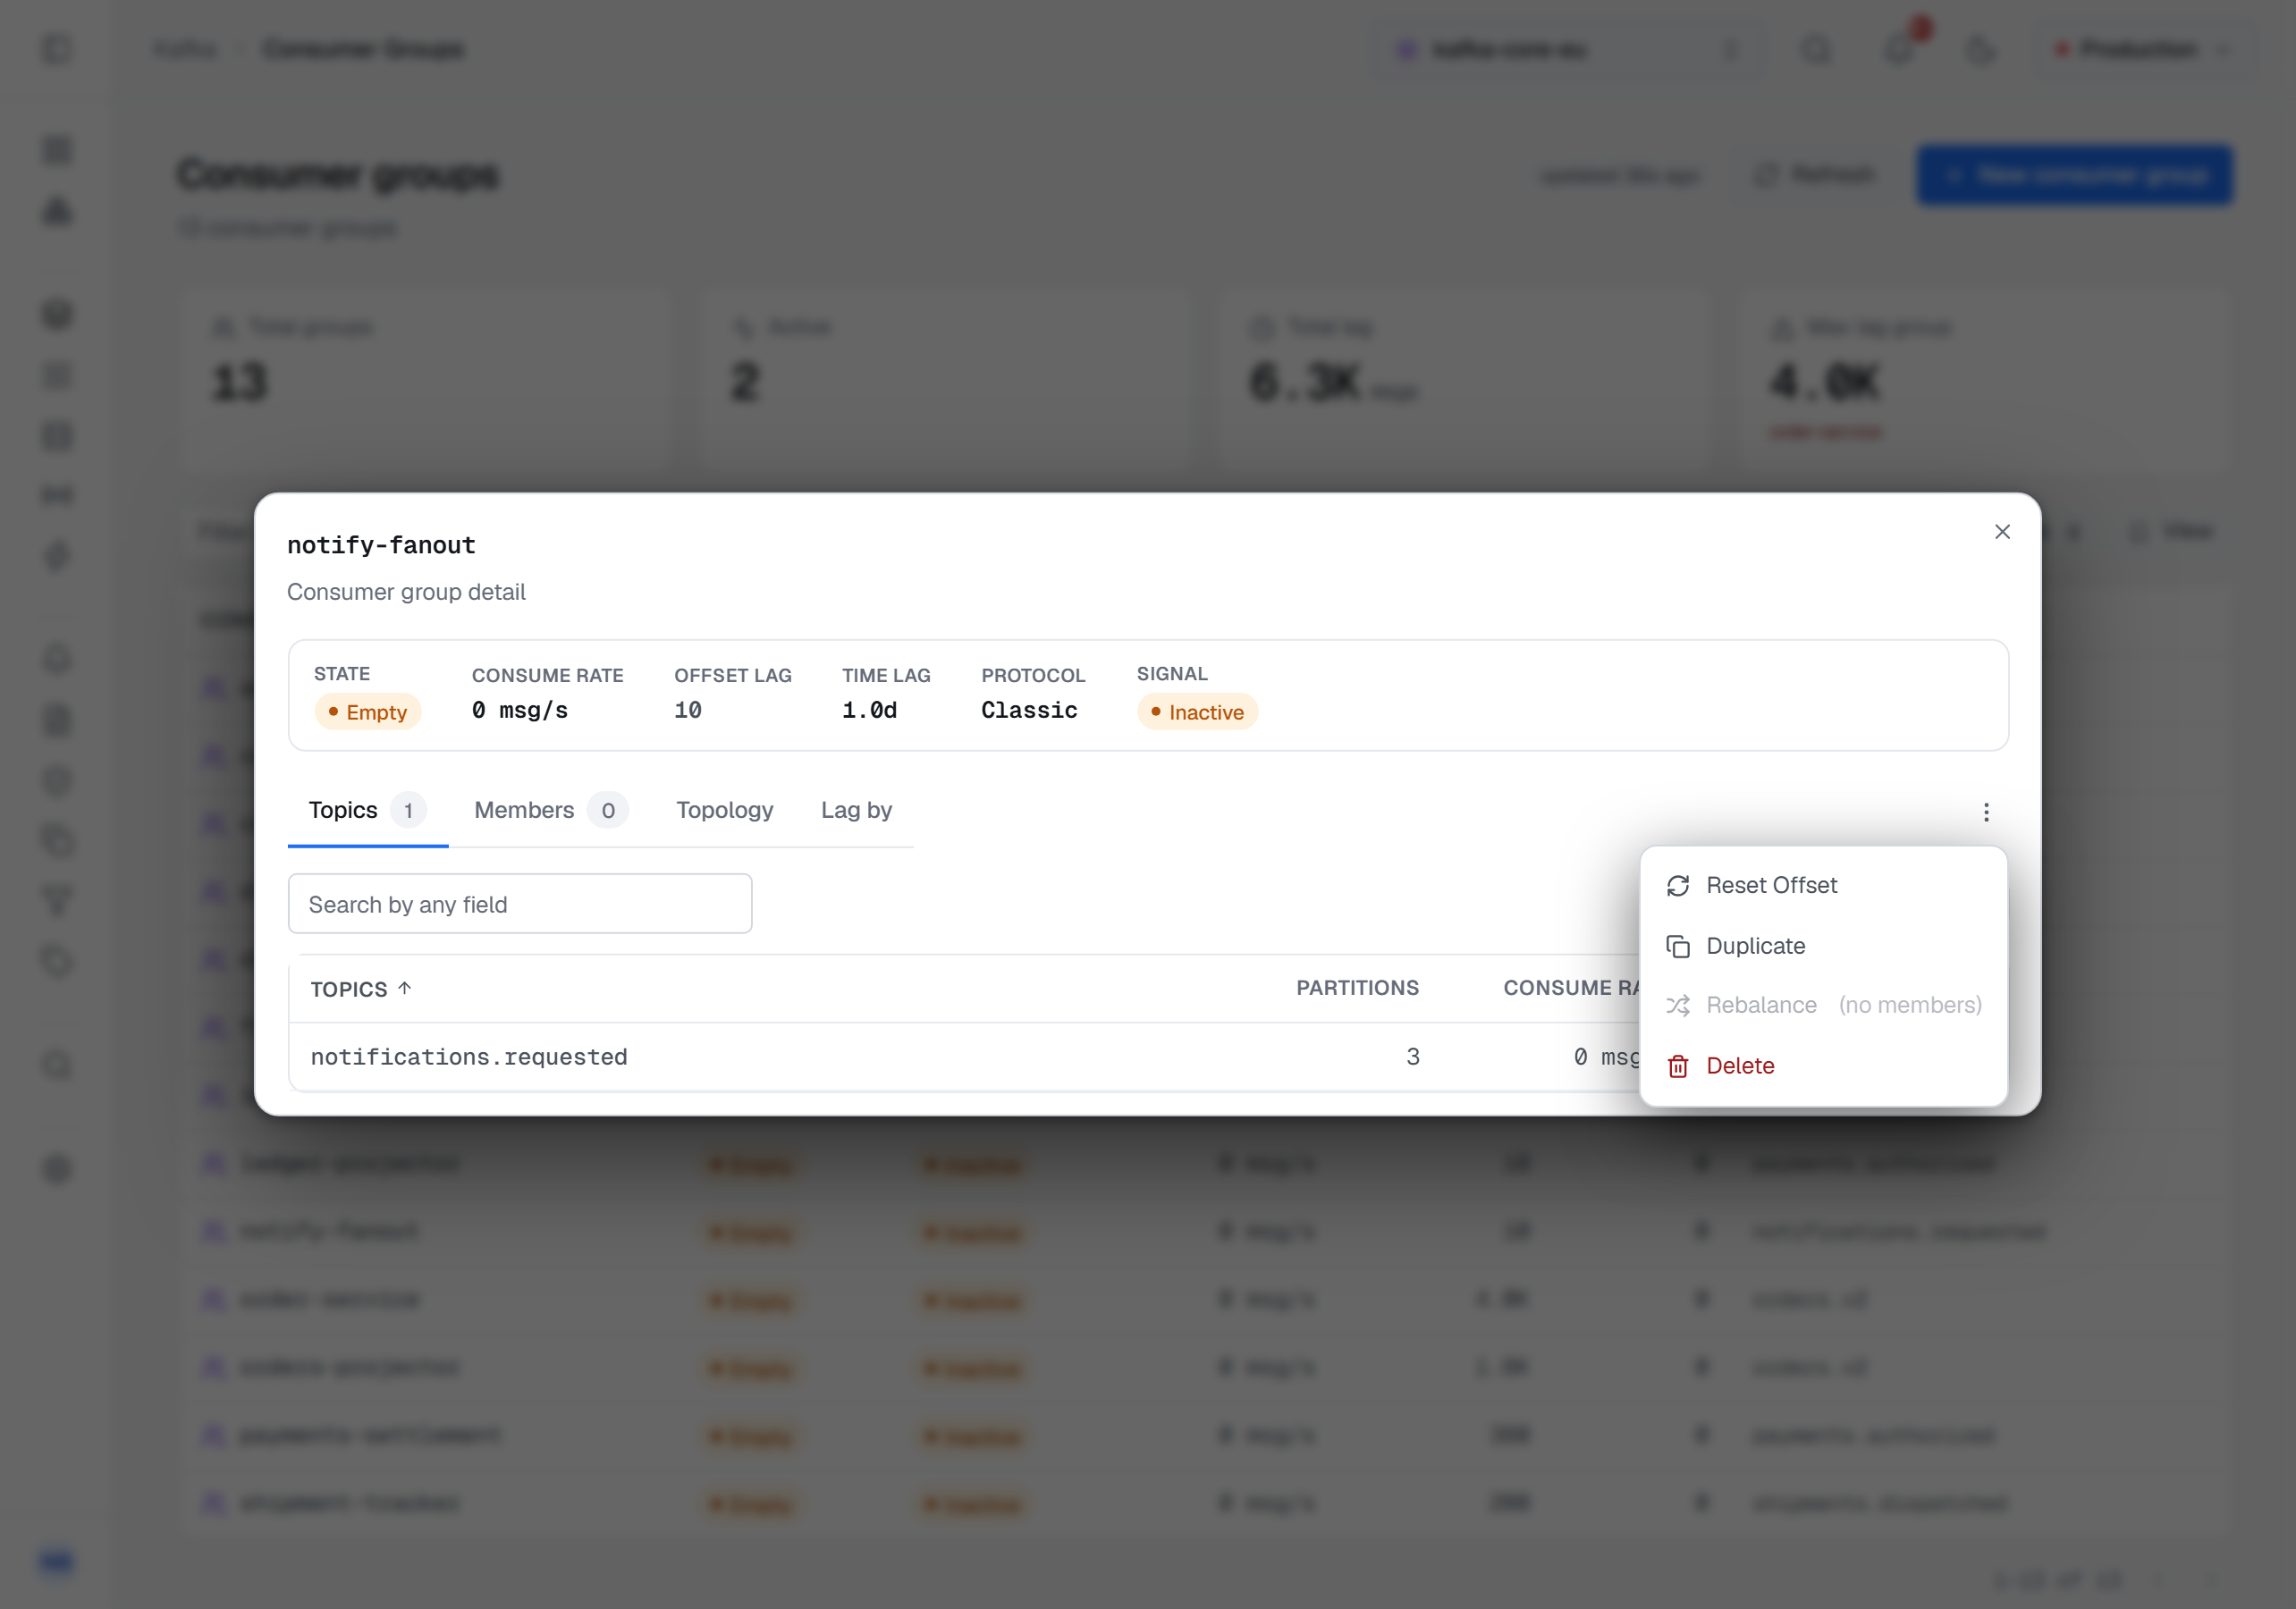
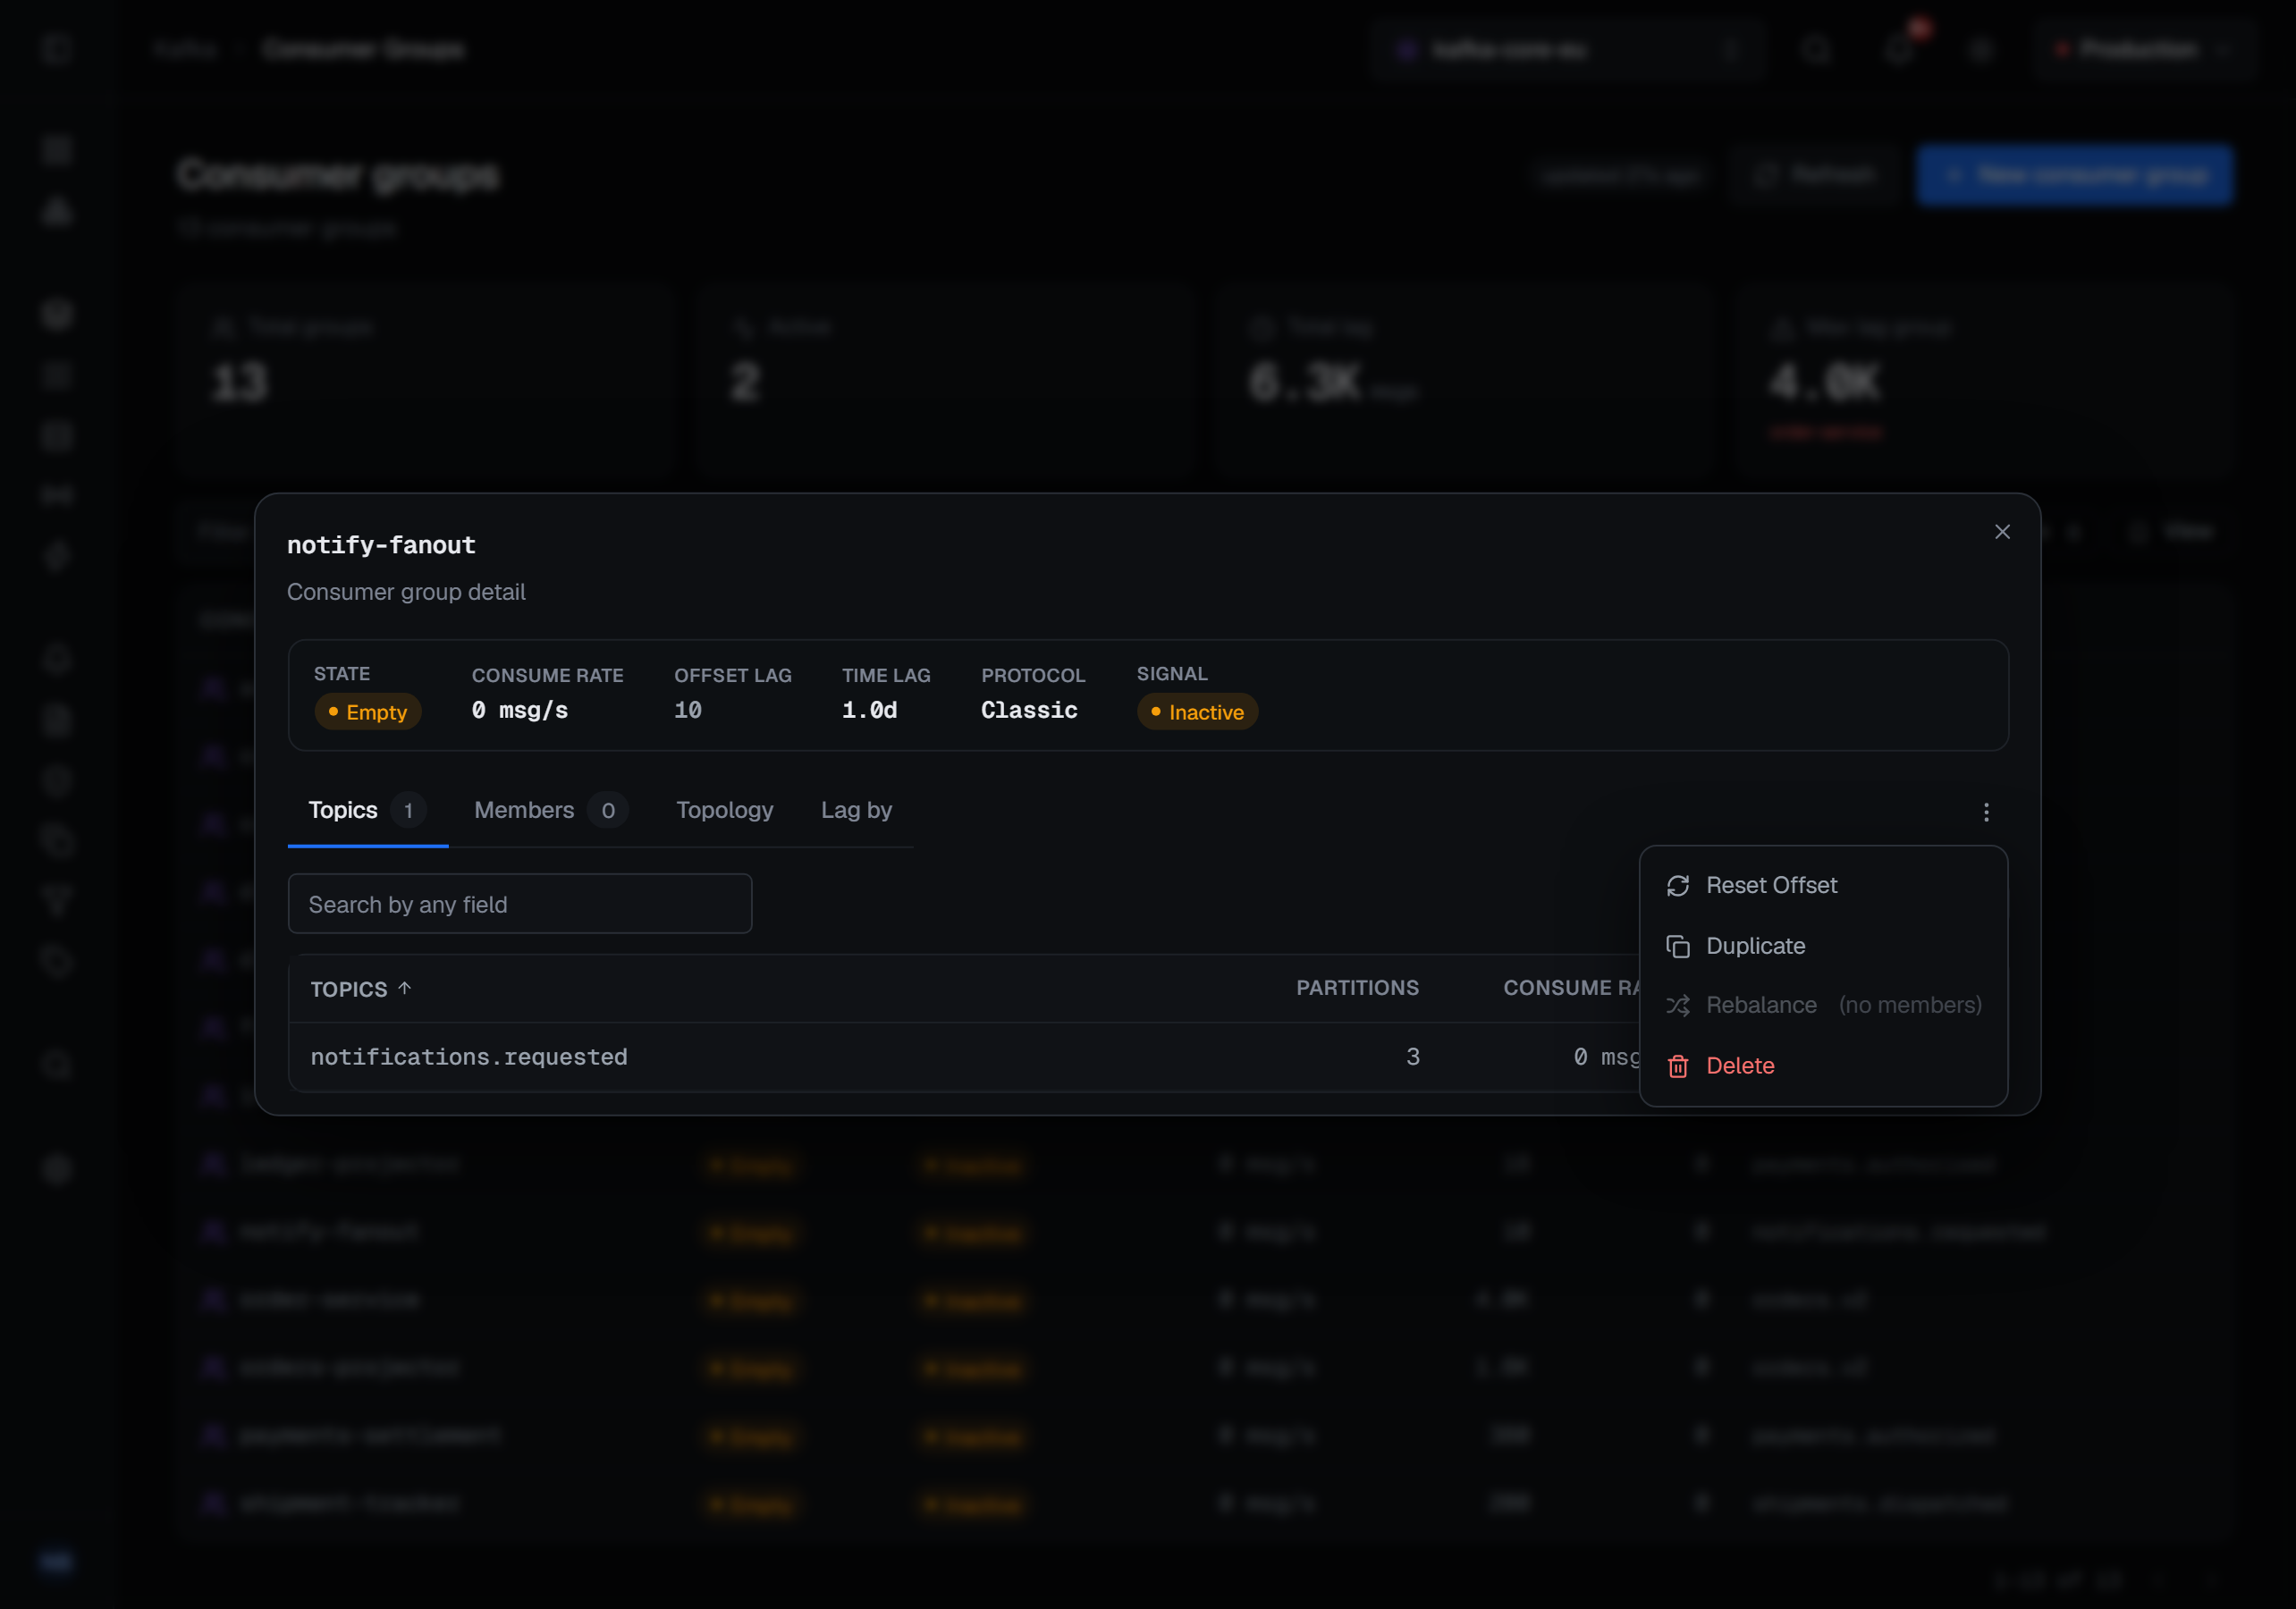
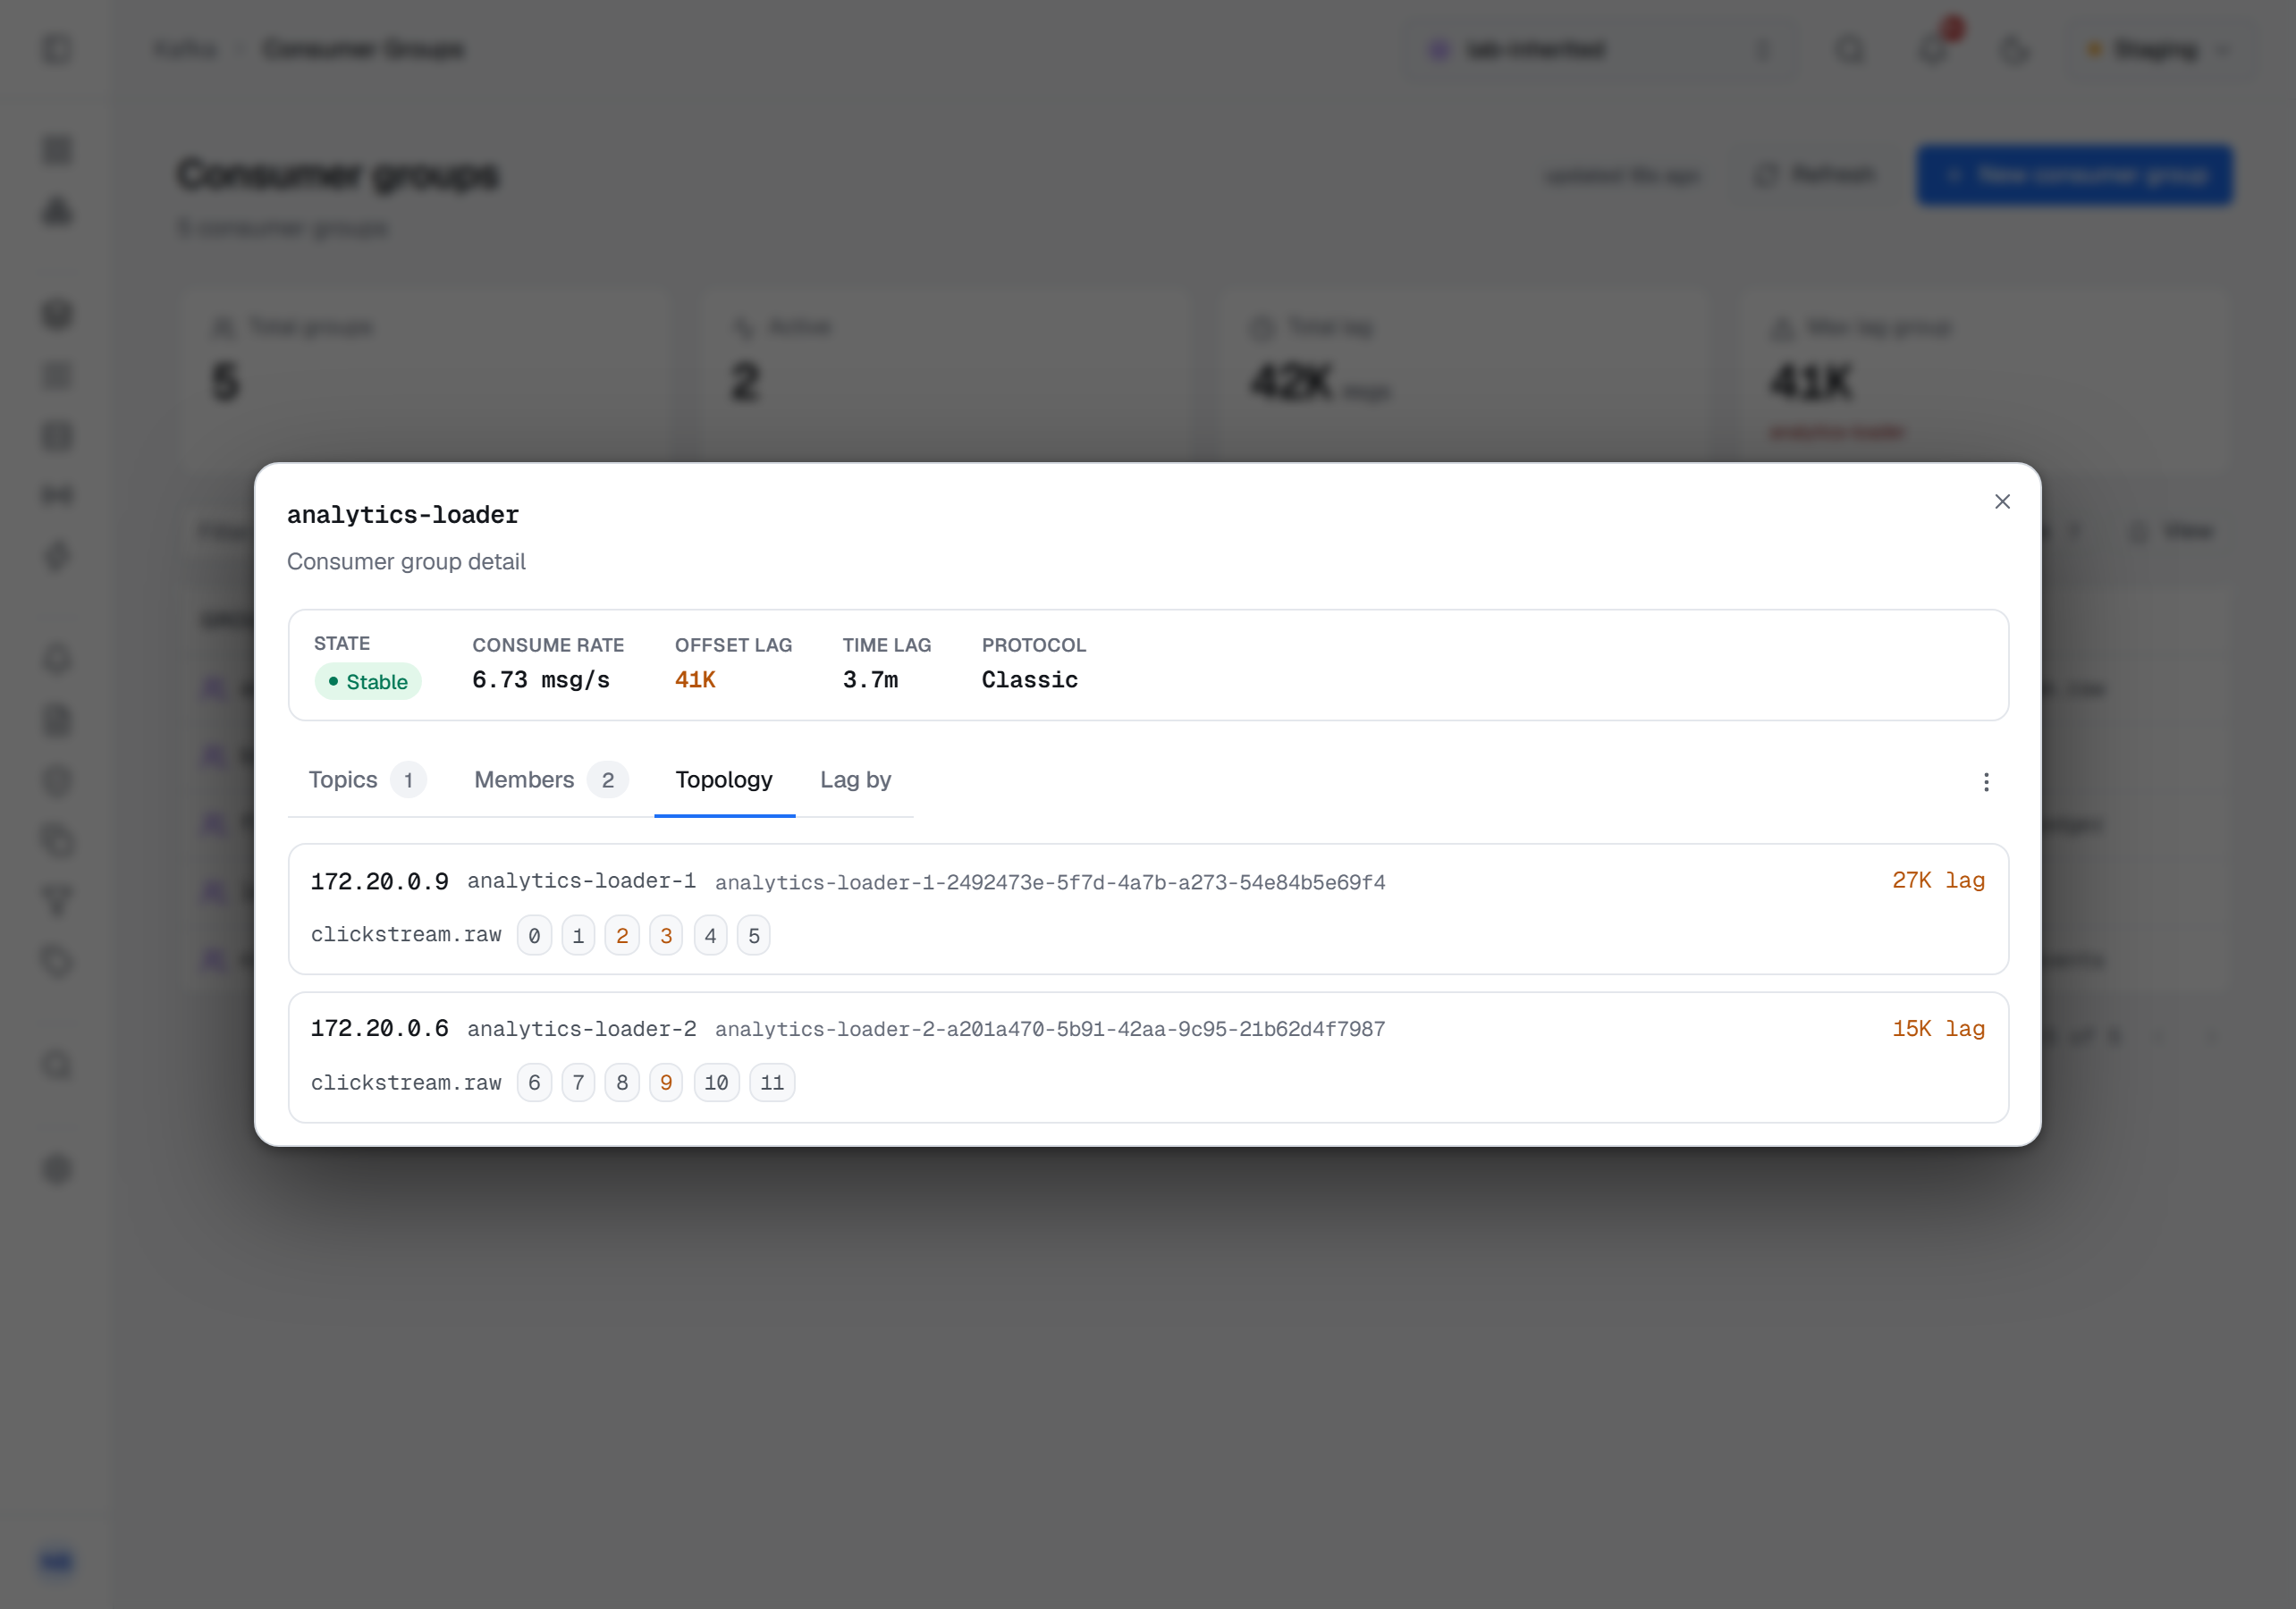
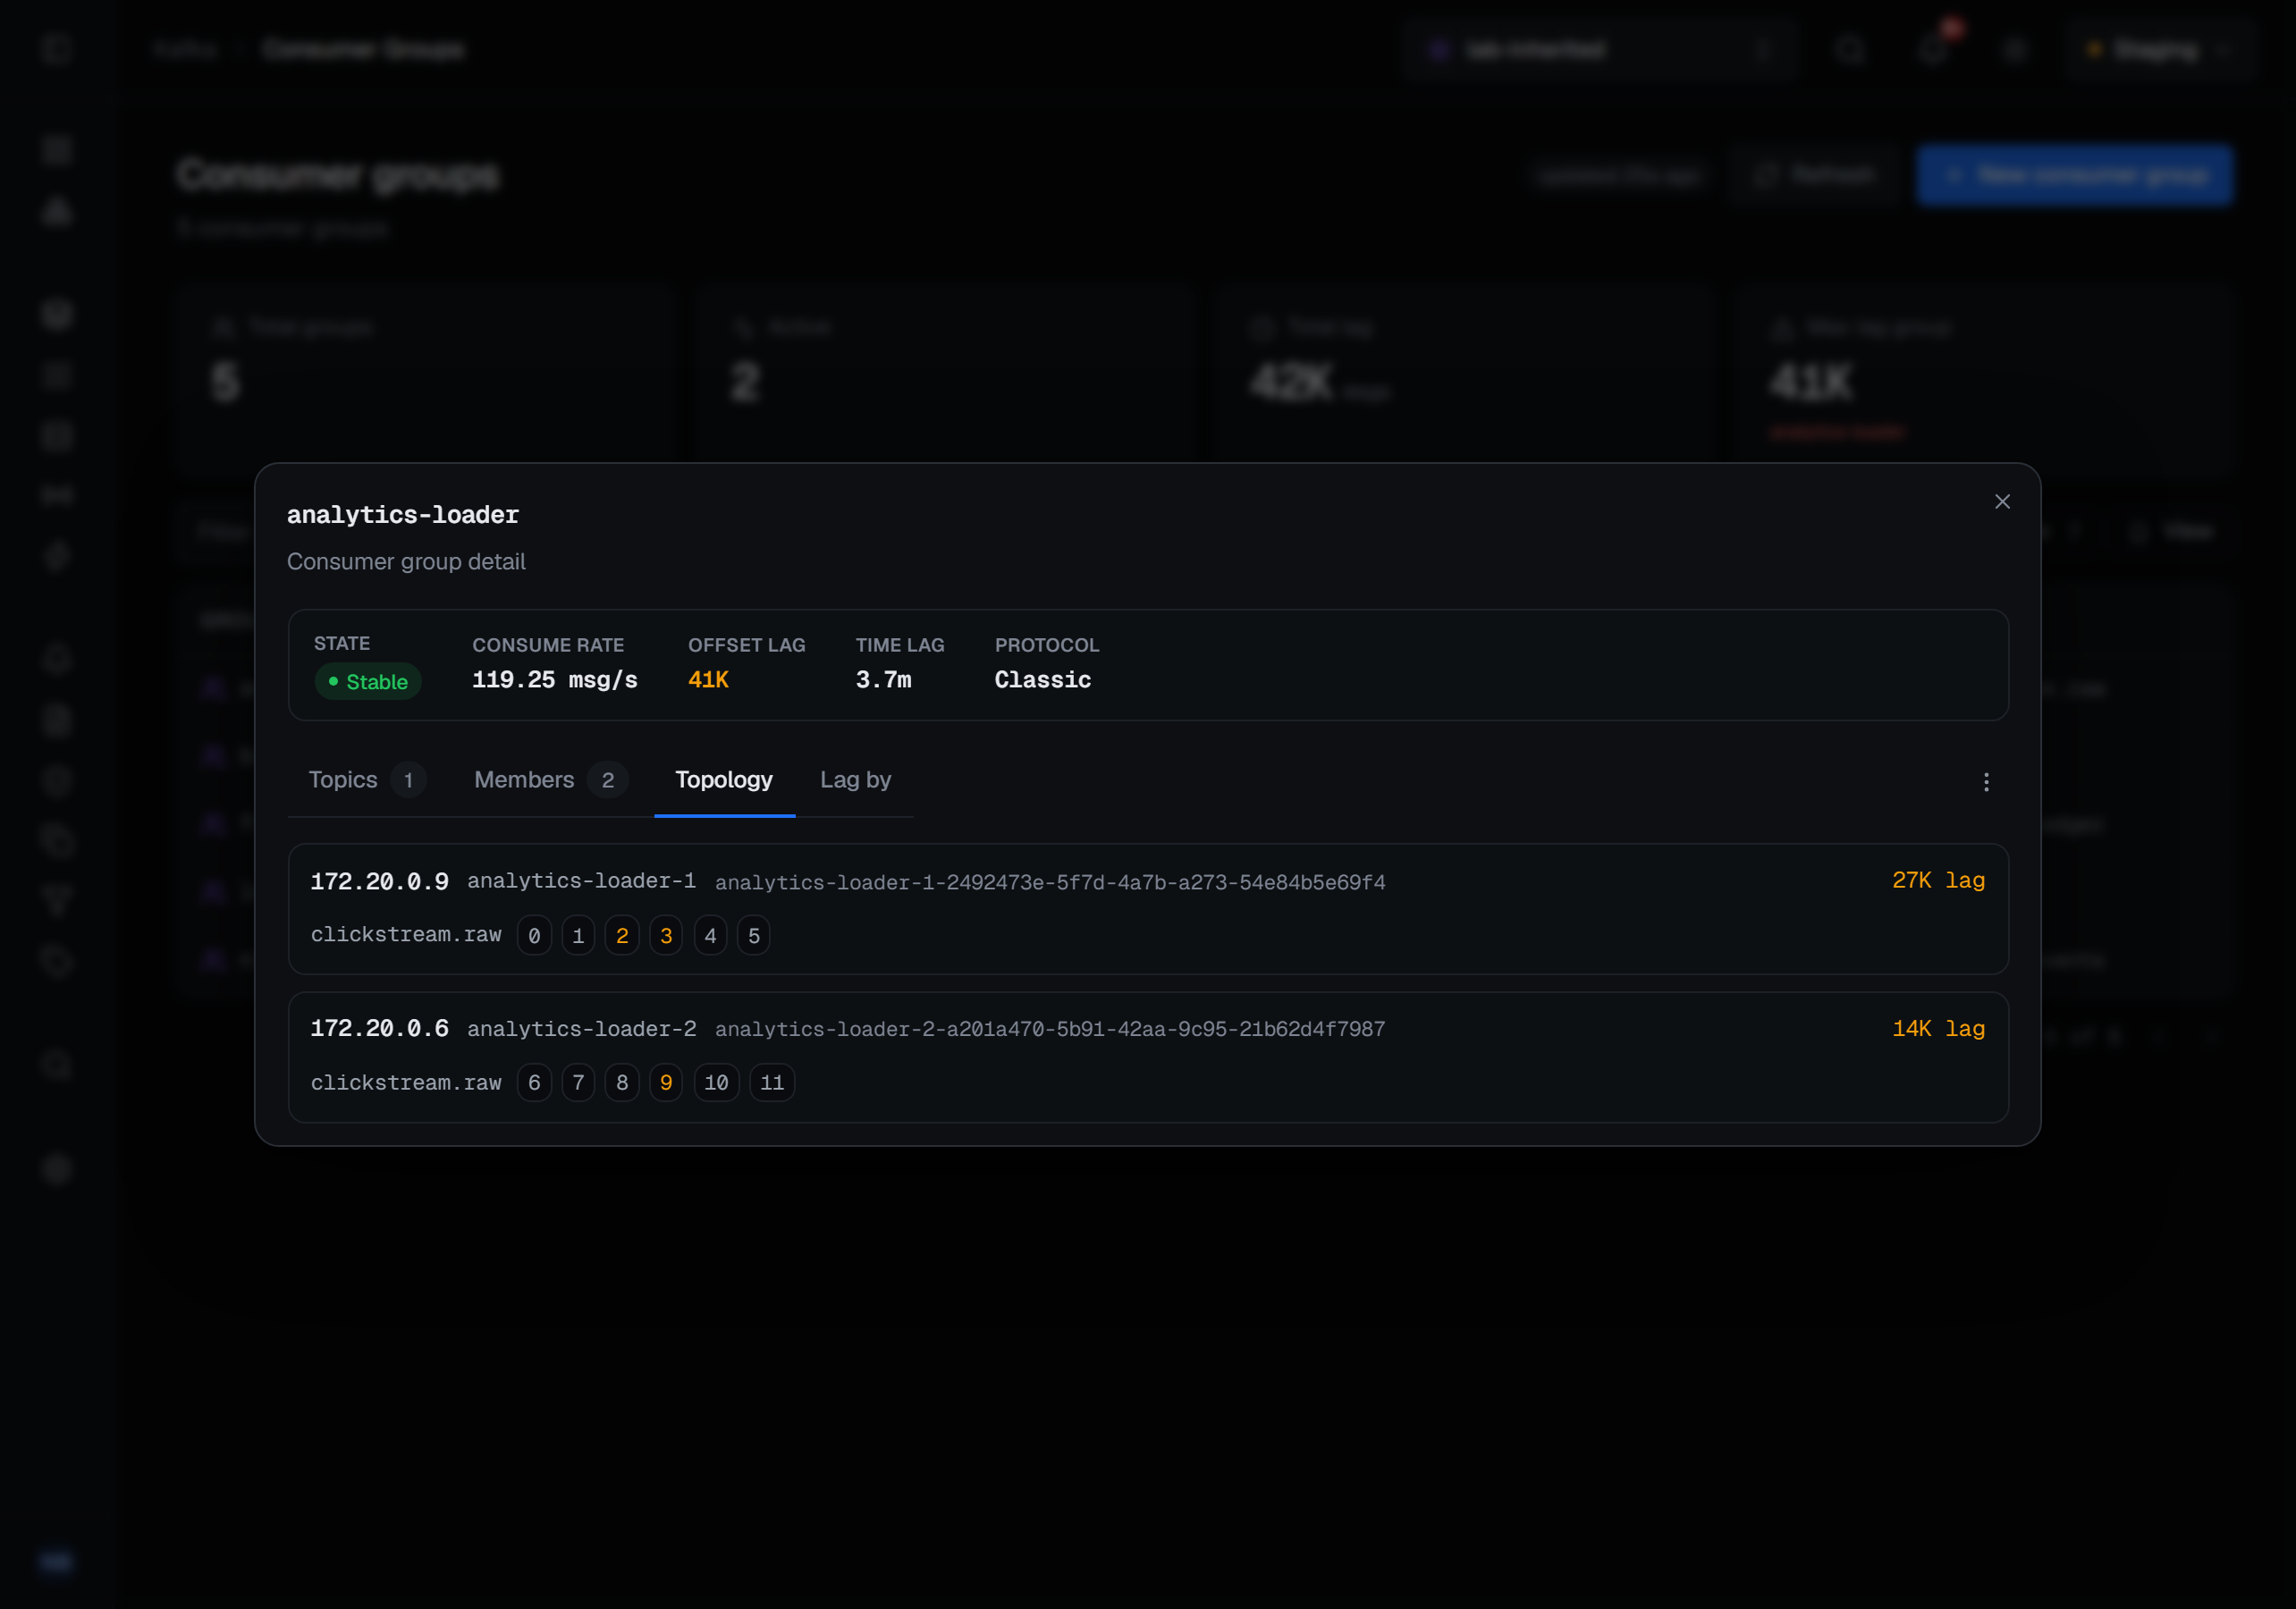
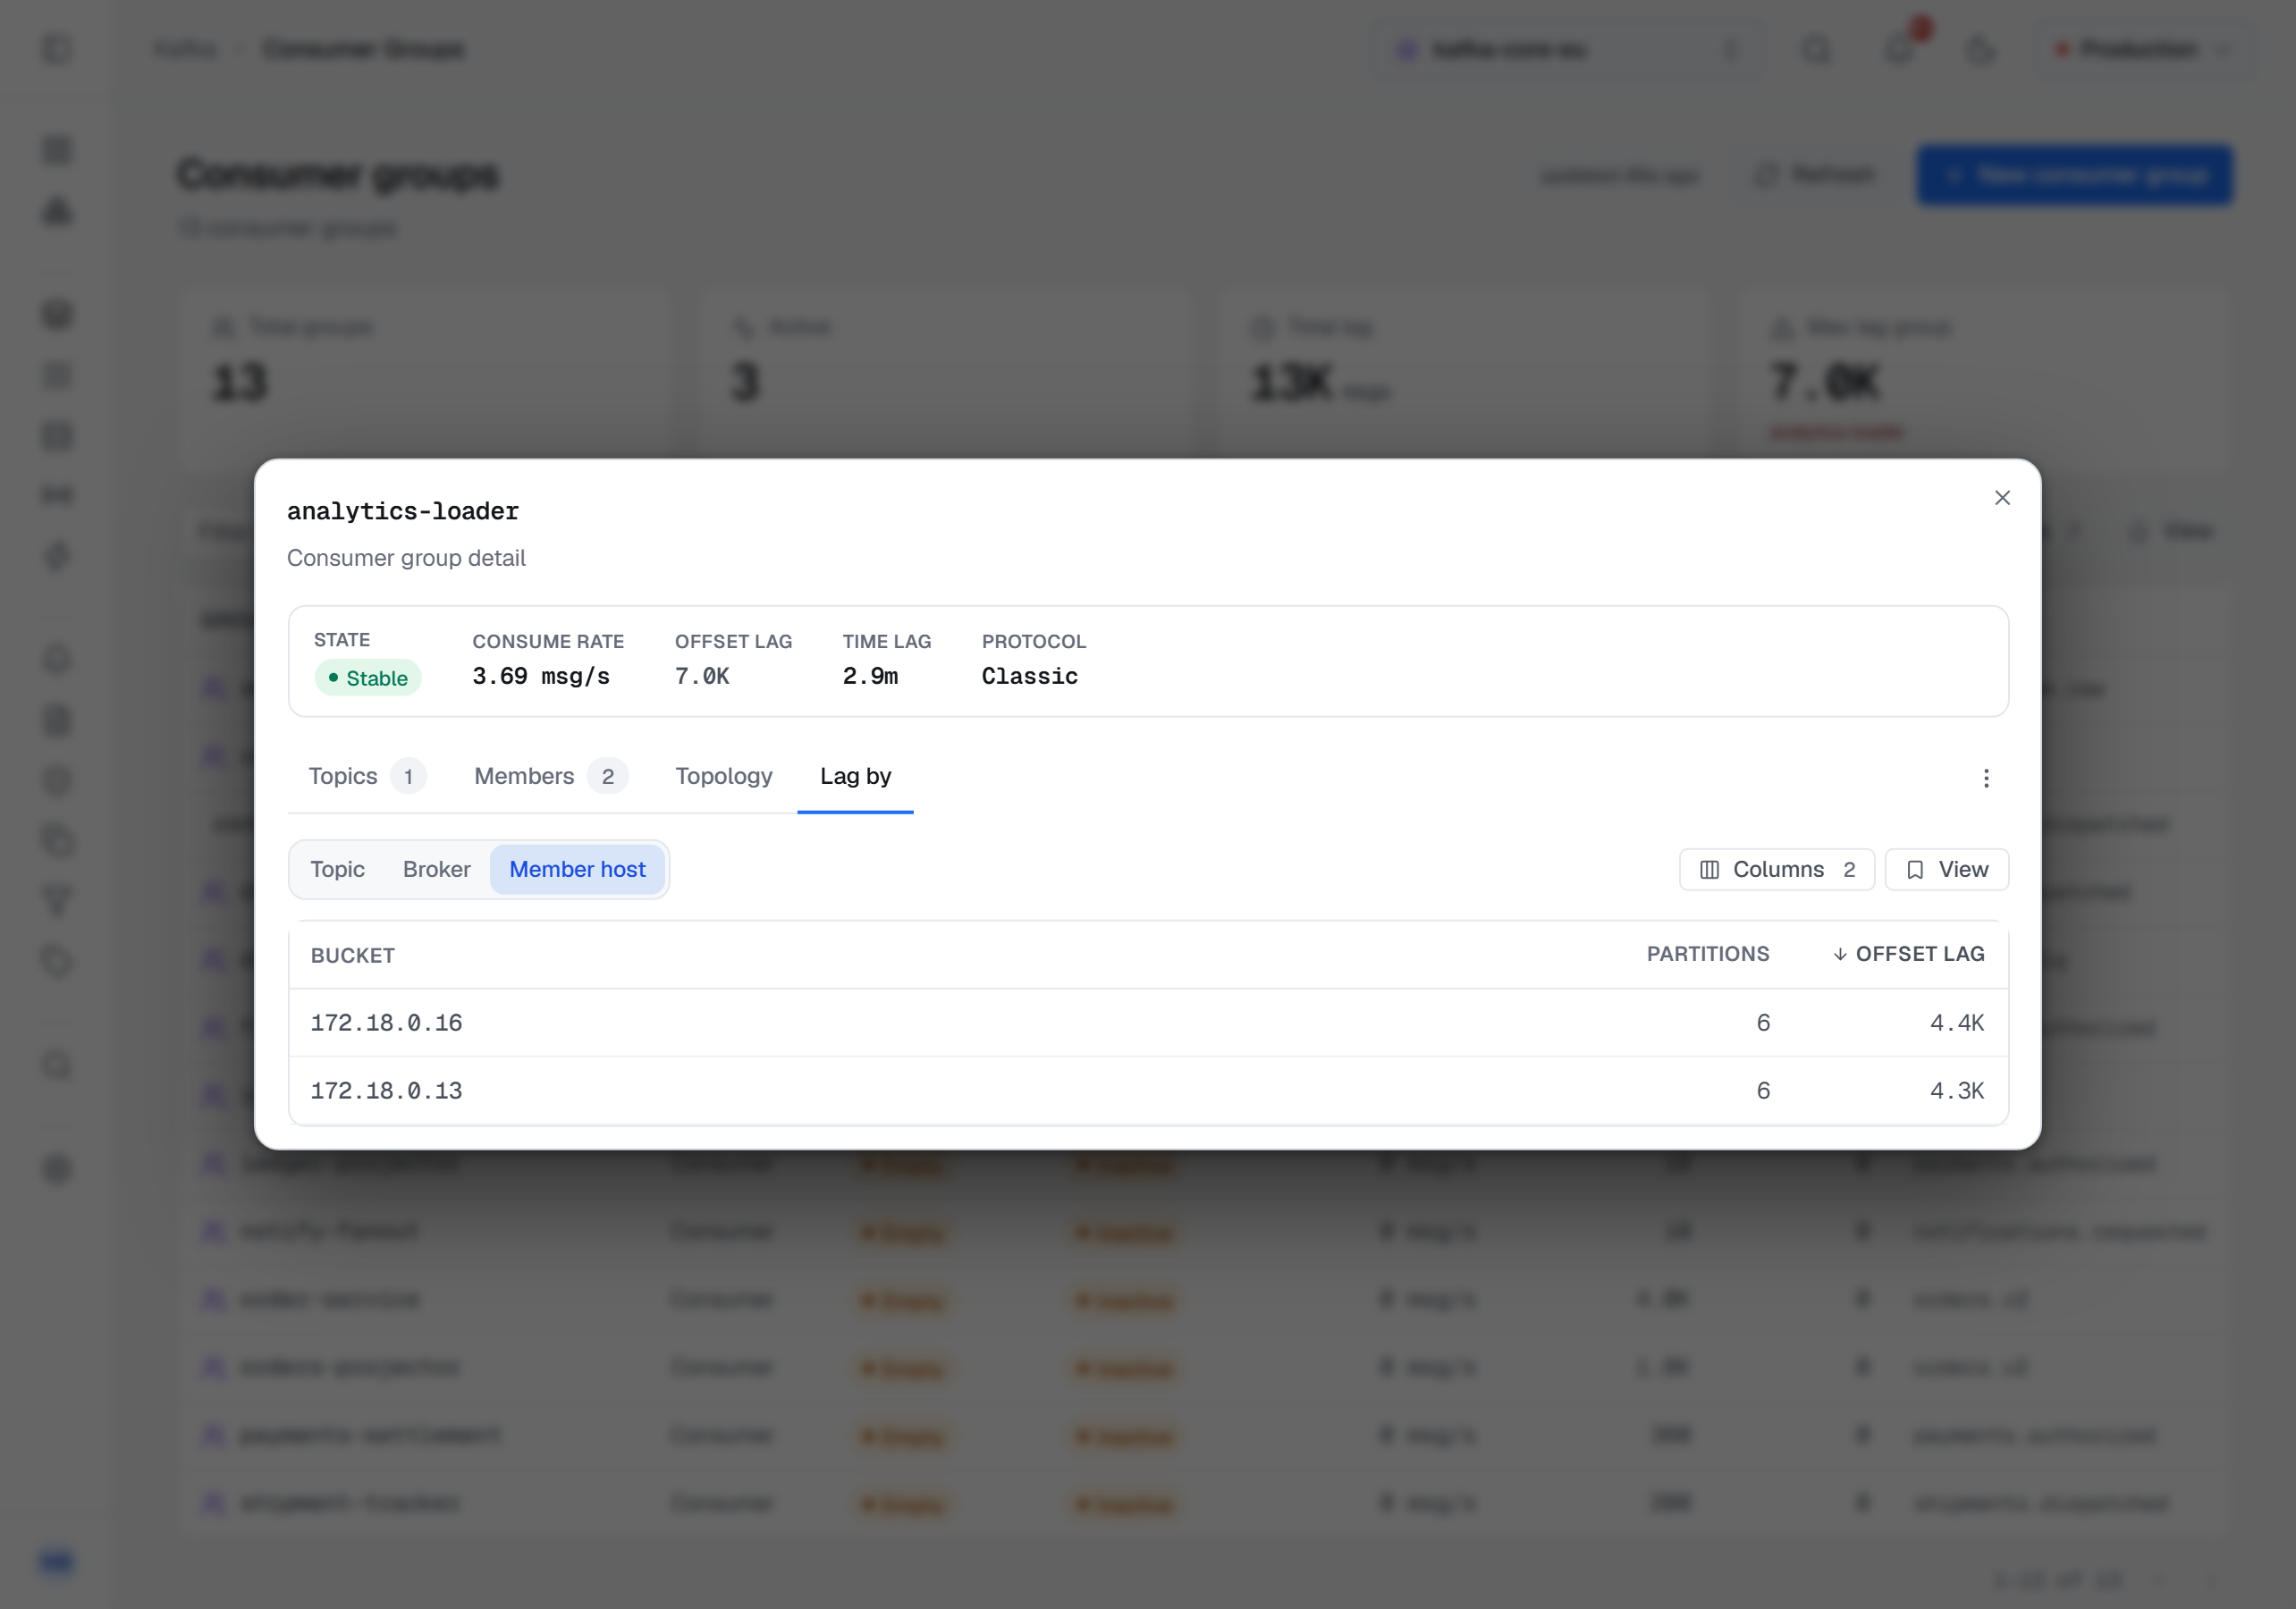
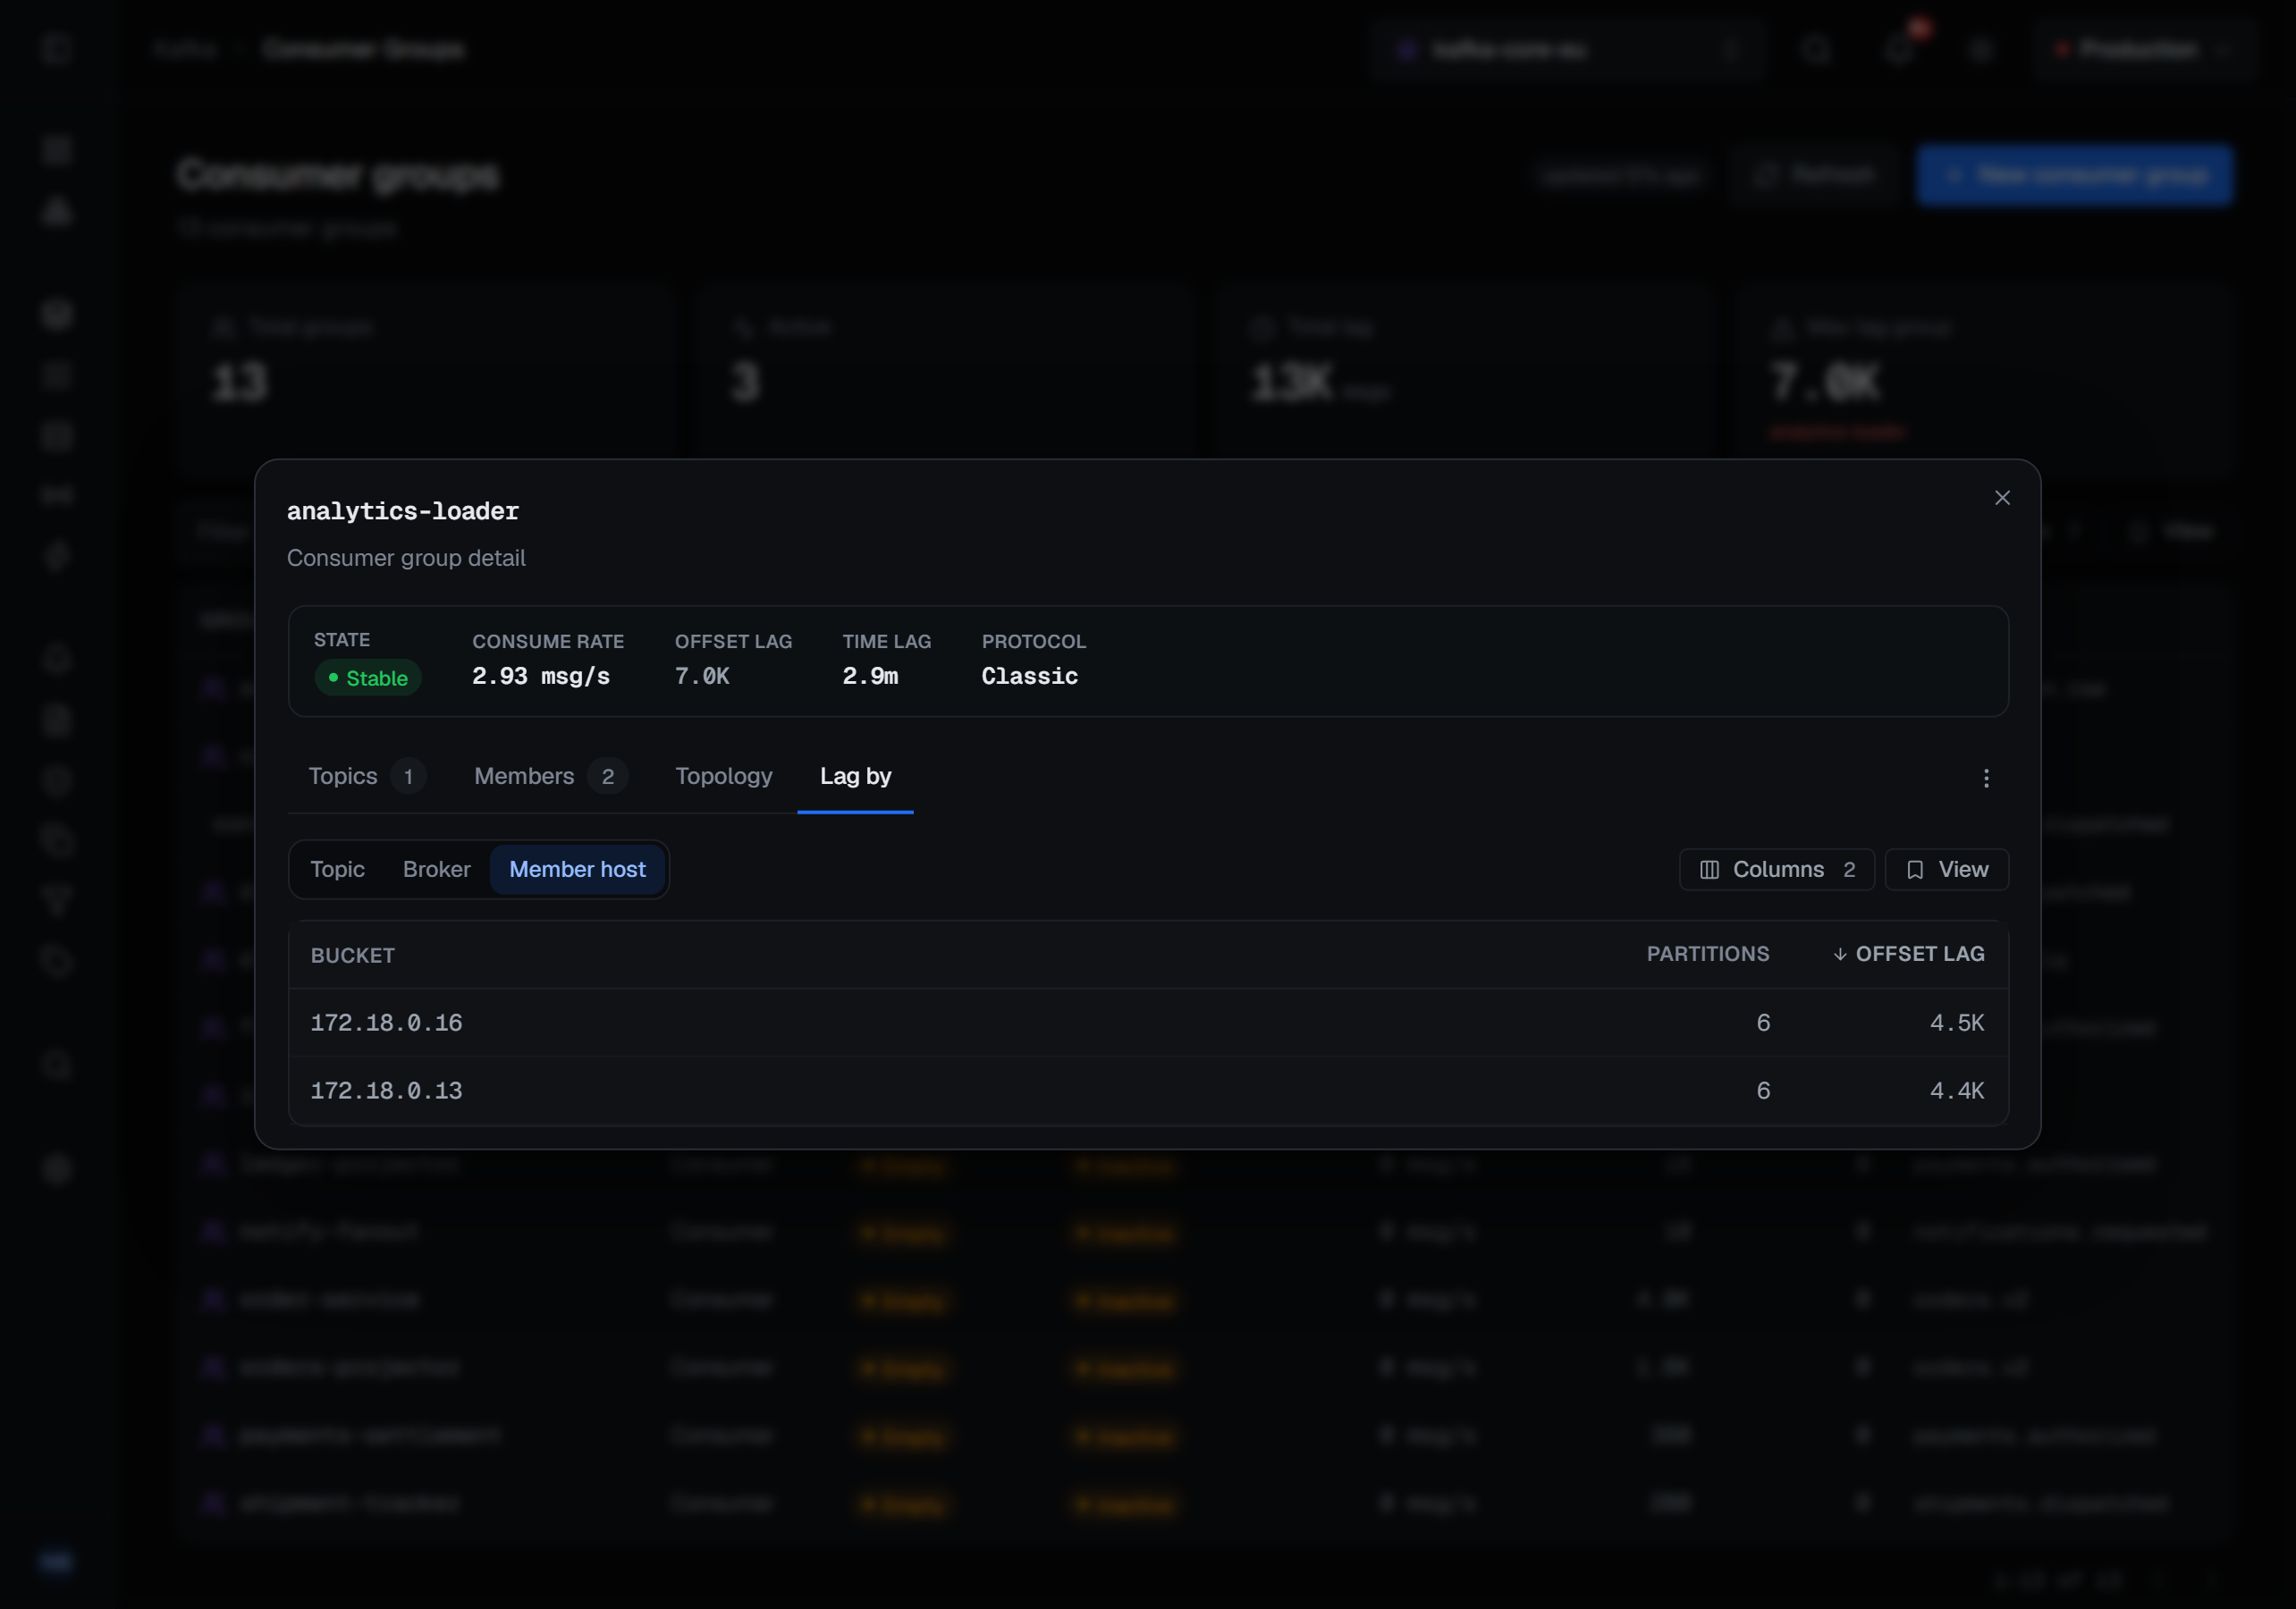
The Topics tab, the chips and the lag breakdowns are built from the group's committed offsets, so a partition the group has never committed on has no row and no lag in them. The Members tab is the coordinator's own list of live members, so a live group that has not yet committed anything shows its members and no topics yet.
The detail also says which protocol the group uses: Classic, or Consumer — the newer consumer group protocol (KIP-848), where the coordinator moves each member toward a target assignment one member at a time instead of stopping the whole group to rebalance. For a consumer-protocol group the detail adds the group epoch and the target epoch, and each member's row adds its own epoch, how many partitions it is being steered toward, and whether it is still reconciling — has not yet taken up the assignment it was given. A member that stays reconciling is the one holding the group's rebalance open. A classic group has no target assignment, so those columns are left out for it rather than drawn as a column of dashes.
Operations and other group types
A group's ⋯ menu resets its offsets, duplicates, rebalances or deletes it, and each topic row can drop that topic from the group; those writes, their guards and what they record are on Group offsets and operations. A share or streams group opens a detail of its own, described on Share and streams groups.
What gets recorded
Reading a group changes nothing, and nothing on this page is recorded as a change: the list, a group's detail and a reset preview are not audited as writes — an audit trail that fills up with people looking is one nobody reads. A read the server refuses is still recorded, so the trail answers who tried. Every write to a group is audited; what each one records is on Group offsets and operations.
Reading the same data from a topic
A topic's own page lists the groups reading it, with the same numbers and a reset scoped to that one topic. That is usually the better place to act from: it is the one that keeps you from moving a group's position on five topics when you meant to move it on one. The reset itself is described on Group offsets and operations.