

Topics
Updated 6 October 2026 · applies to 1.0.1 · Community and Commercial
Topics, under Kafka in the sidebar, lists every topic on the cluster and opens each one on a page of its own. The list is the screen most people leave open, and it is built to be shaped to the question you are currently asking rather than to show everything at once.
Choosing what you look at
The topic name is always there. Beside it you can turn on partitions, replication factor, message count, size, labels, cleanup policy, retention time, retention bytes, minimum in-sync replicas, produce rate and last activity — and turn off the ones you are not using. Your choice of columns, their order and the page size are remembered, so the view you built is the view you come back to.
Partitions and replication factor come with the list itself; most of the others cost the broker more. When the list is read live rather than from the snapshot described below, BROKA loads it first and fills the expensive columns in behind it, so the page is usable while the counts are still arriving.
Labels are not Kafka's: Kafka has no such thing. They are the key–value labels written for a topic under Operations ▸ Resource Metadata. The search box matches a label's key or value as well as the topic name, and a Label filter appears once any topic on the connection has one. The Status filter and the Unavailable tile pick out topics with a partition that has no leader.
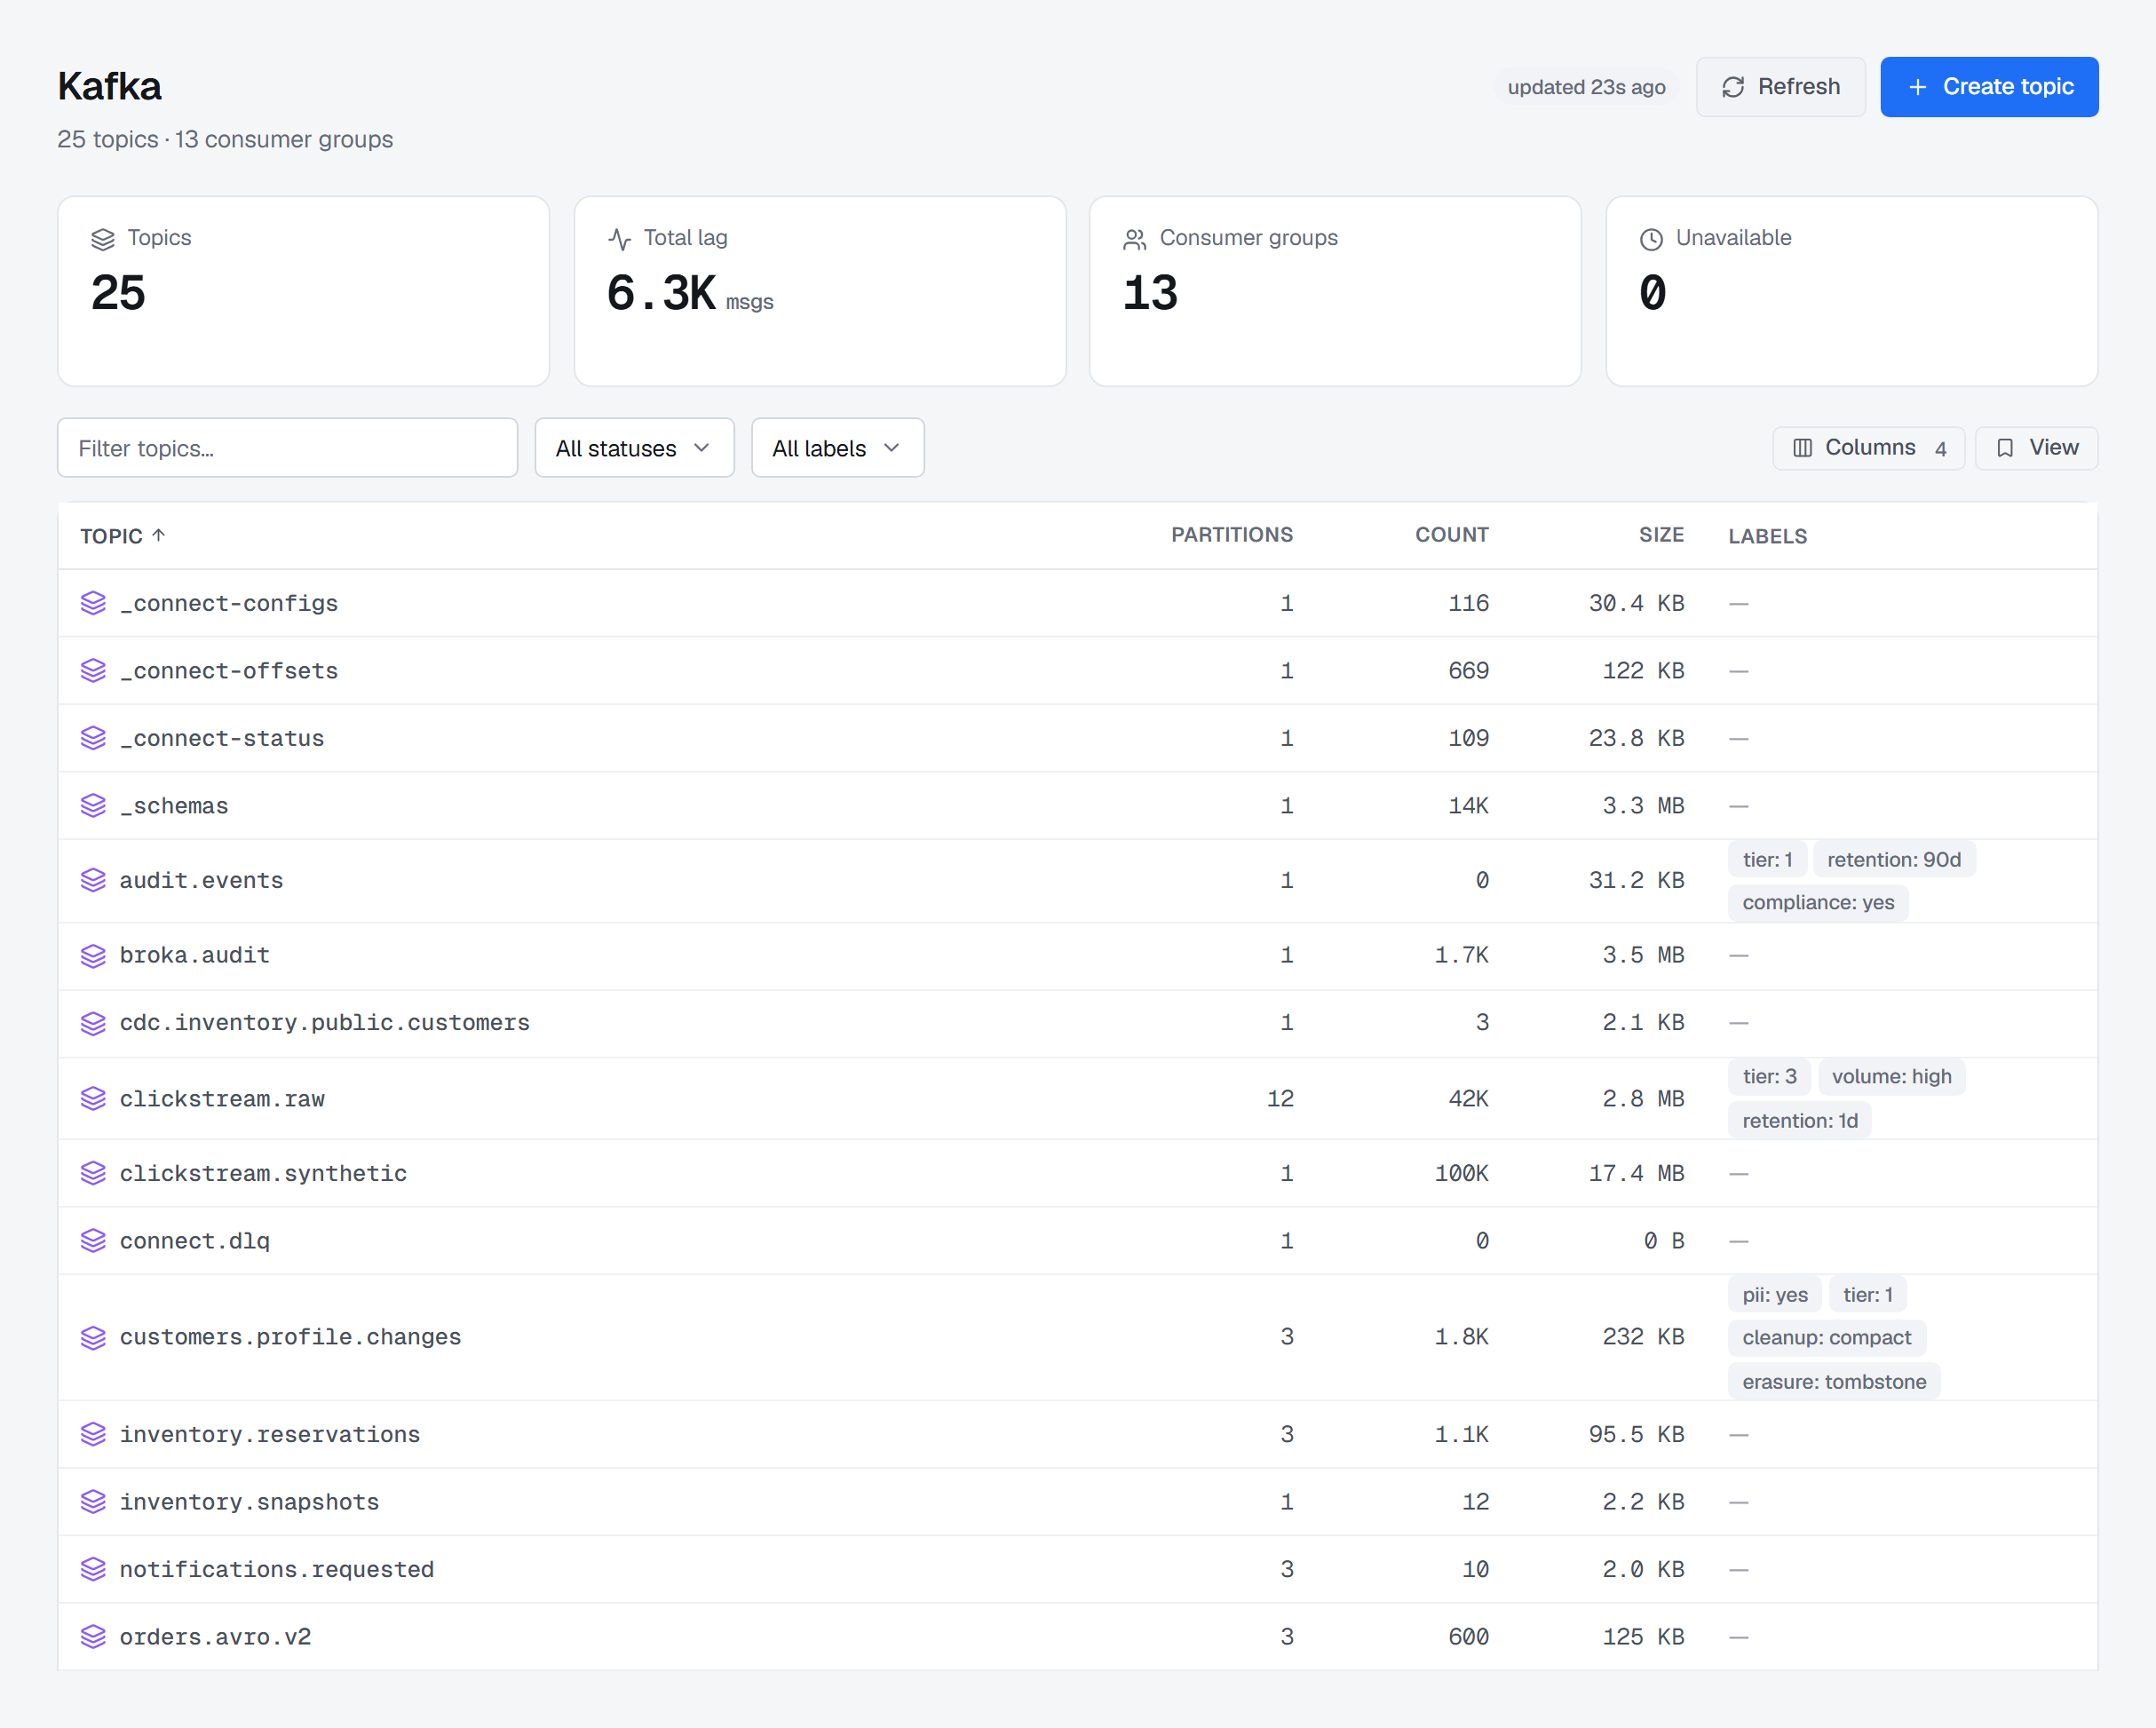
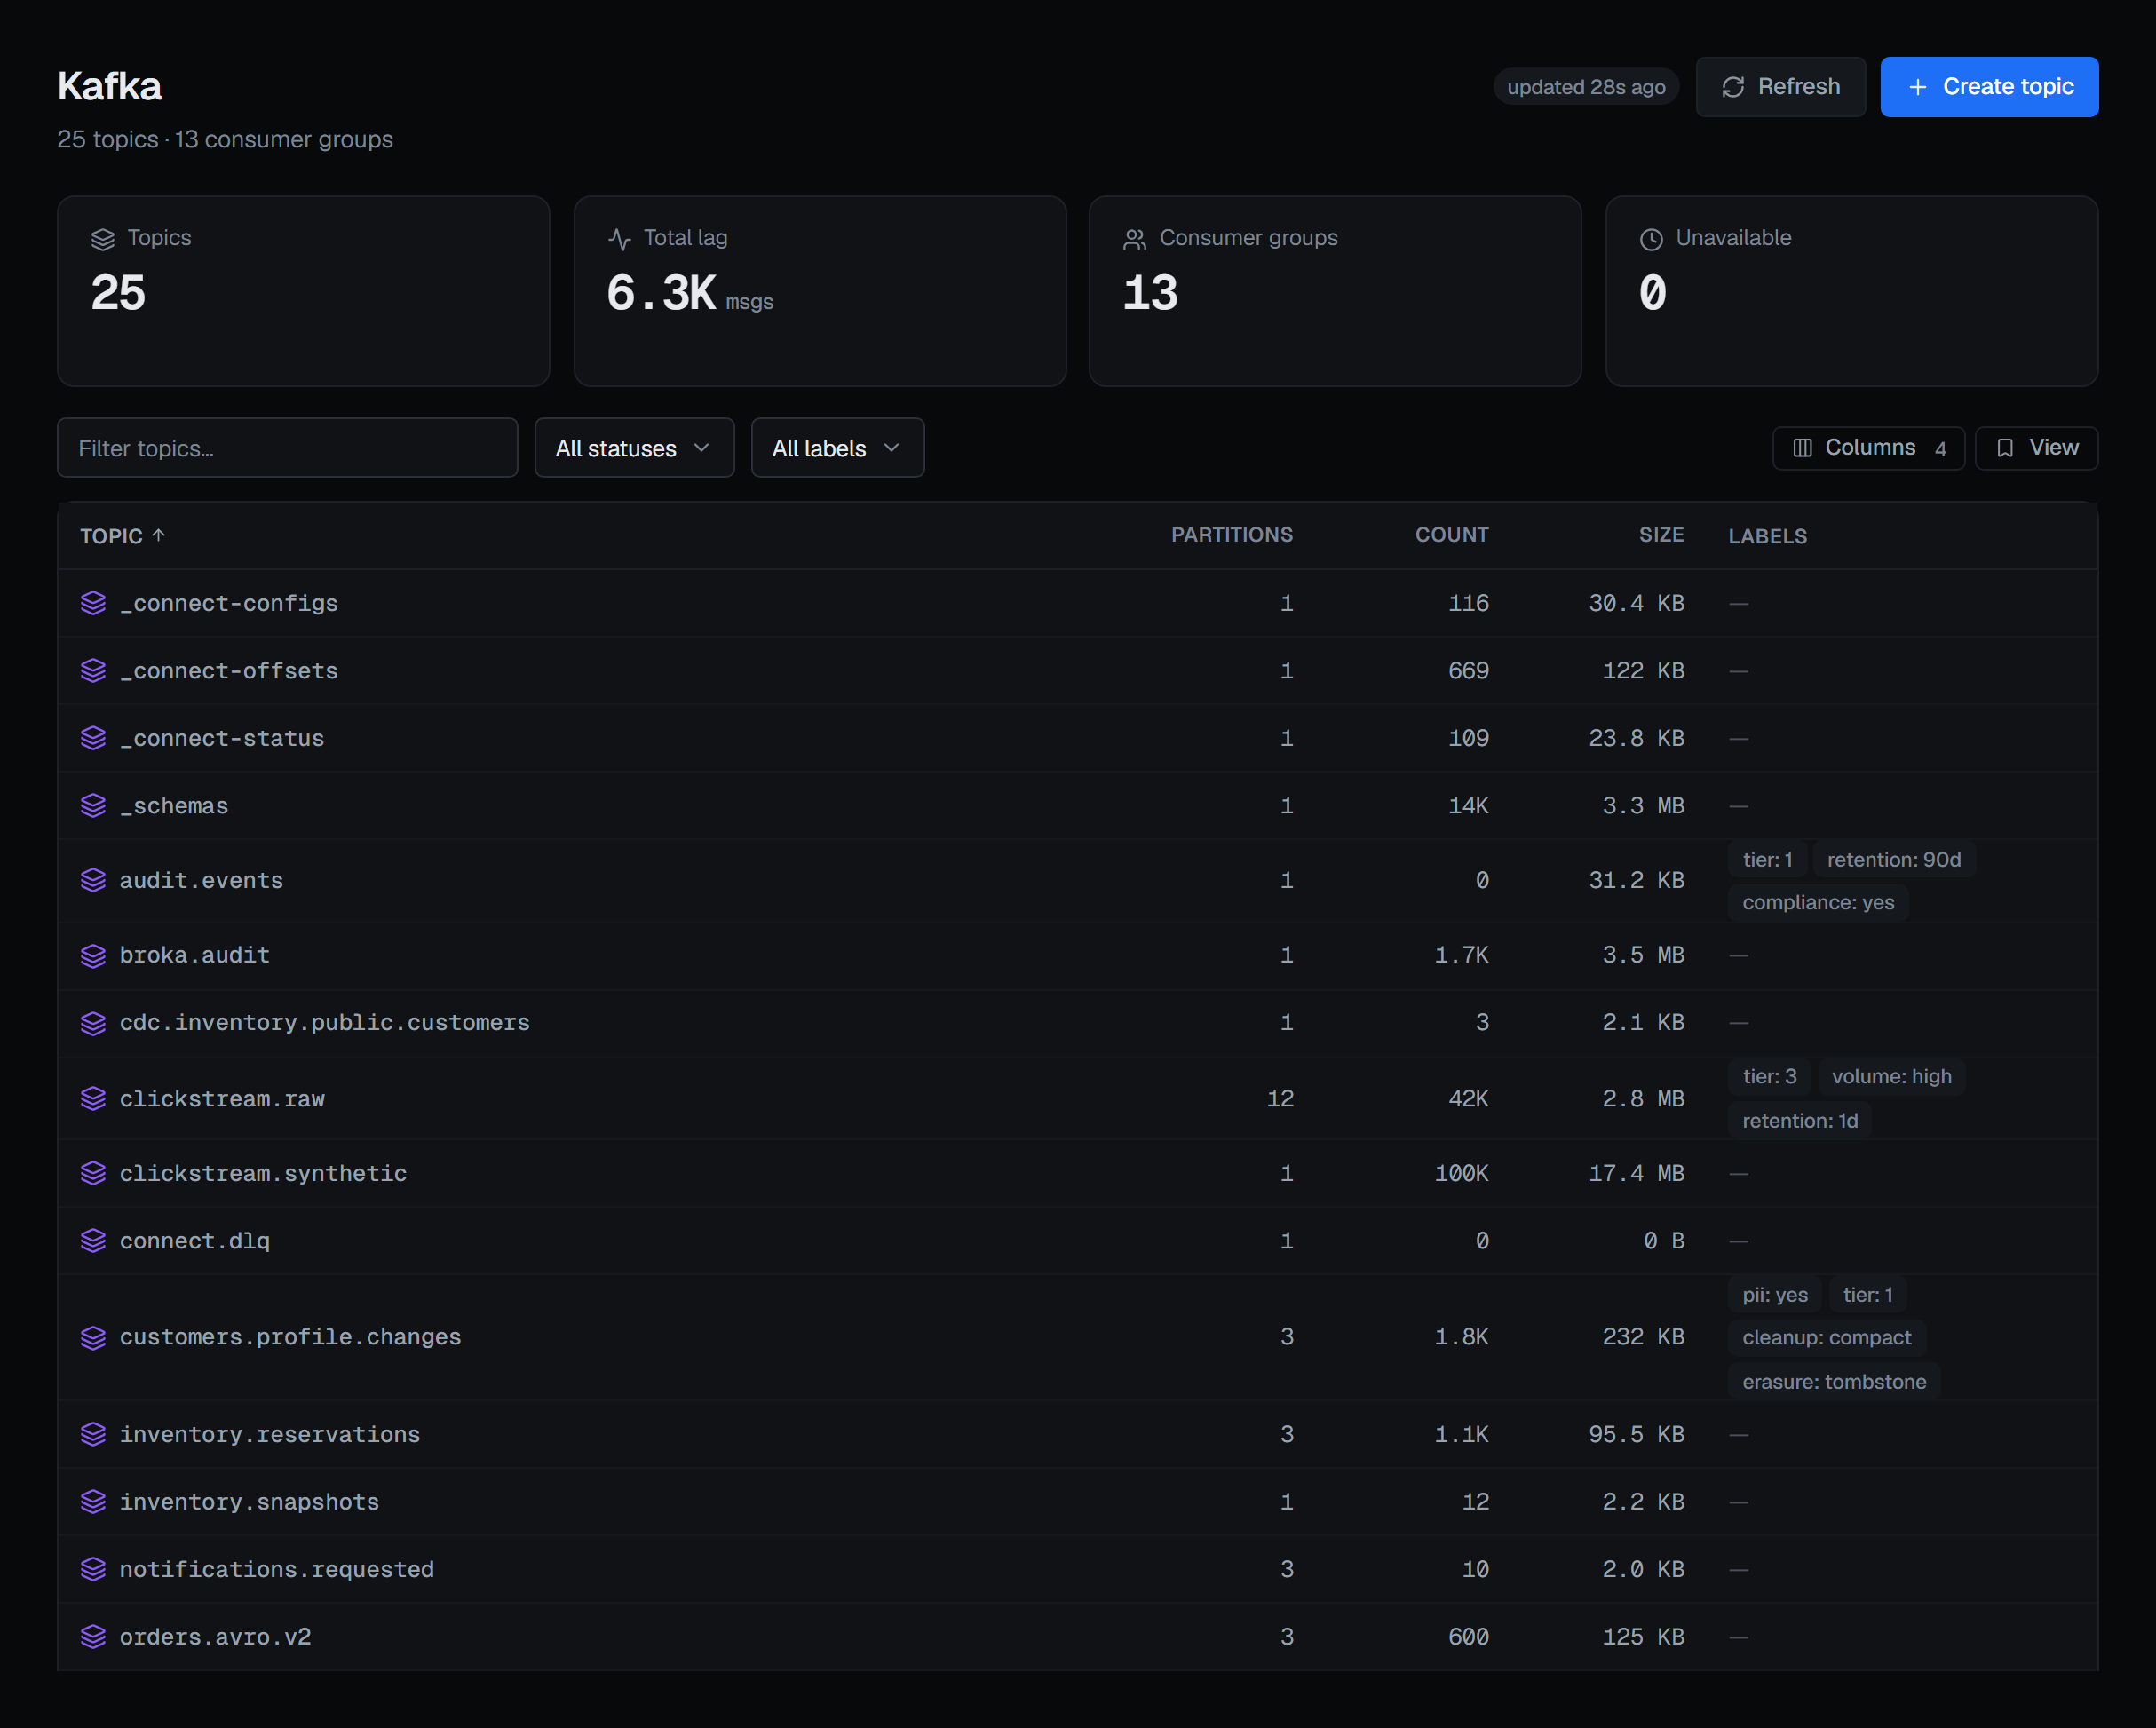
A read returns at most 500 topics. On a larger cluster the page says how many of how many it is showing; the search box then filters the loaded rows as you type, and pressing Enter searches every topic name on the cluster.
A column that could not be measured shows "—" rather than a number. Message counts, sizes and retention each come from a different probe on the broker, and any one of them can be unavailable without the others failing. When that happens the cell is empty and honest instead of quietly reporting zero.
Produce rate is derived, not read: BROKA compares each topic's offsets between two passes. That makes it available on any cluster with no exporter or agent involved, and it is why the column needs a second reading before it can show anything. Each connection keeps its own readings, however many topics and groups the estate has, so the rate keeps being measured on a large one.
Freshness
The list is served from a snapshot that BROKA refreshes about every thirty seconds, and it tells you how old what you are looking at is. When you need this second's answer — you have just created a topic, or you are watching something drain — Refresh reads the brokers directly and the chip changes to say so.
Looking at one topic
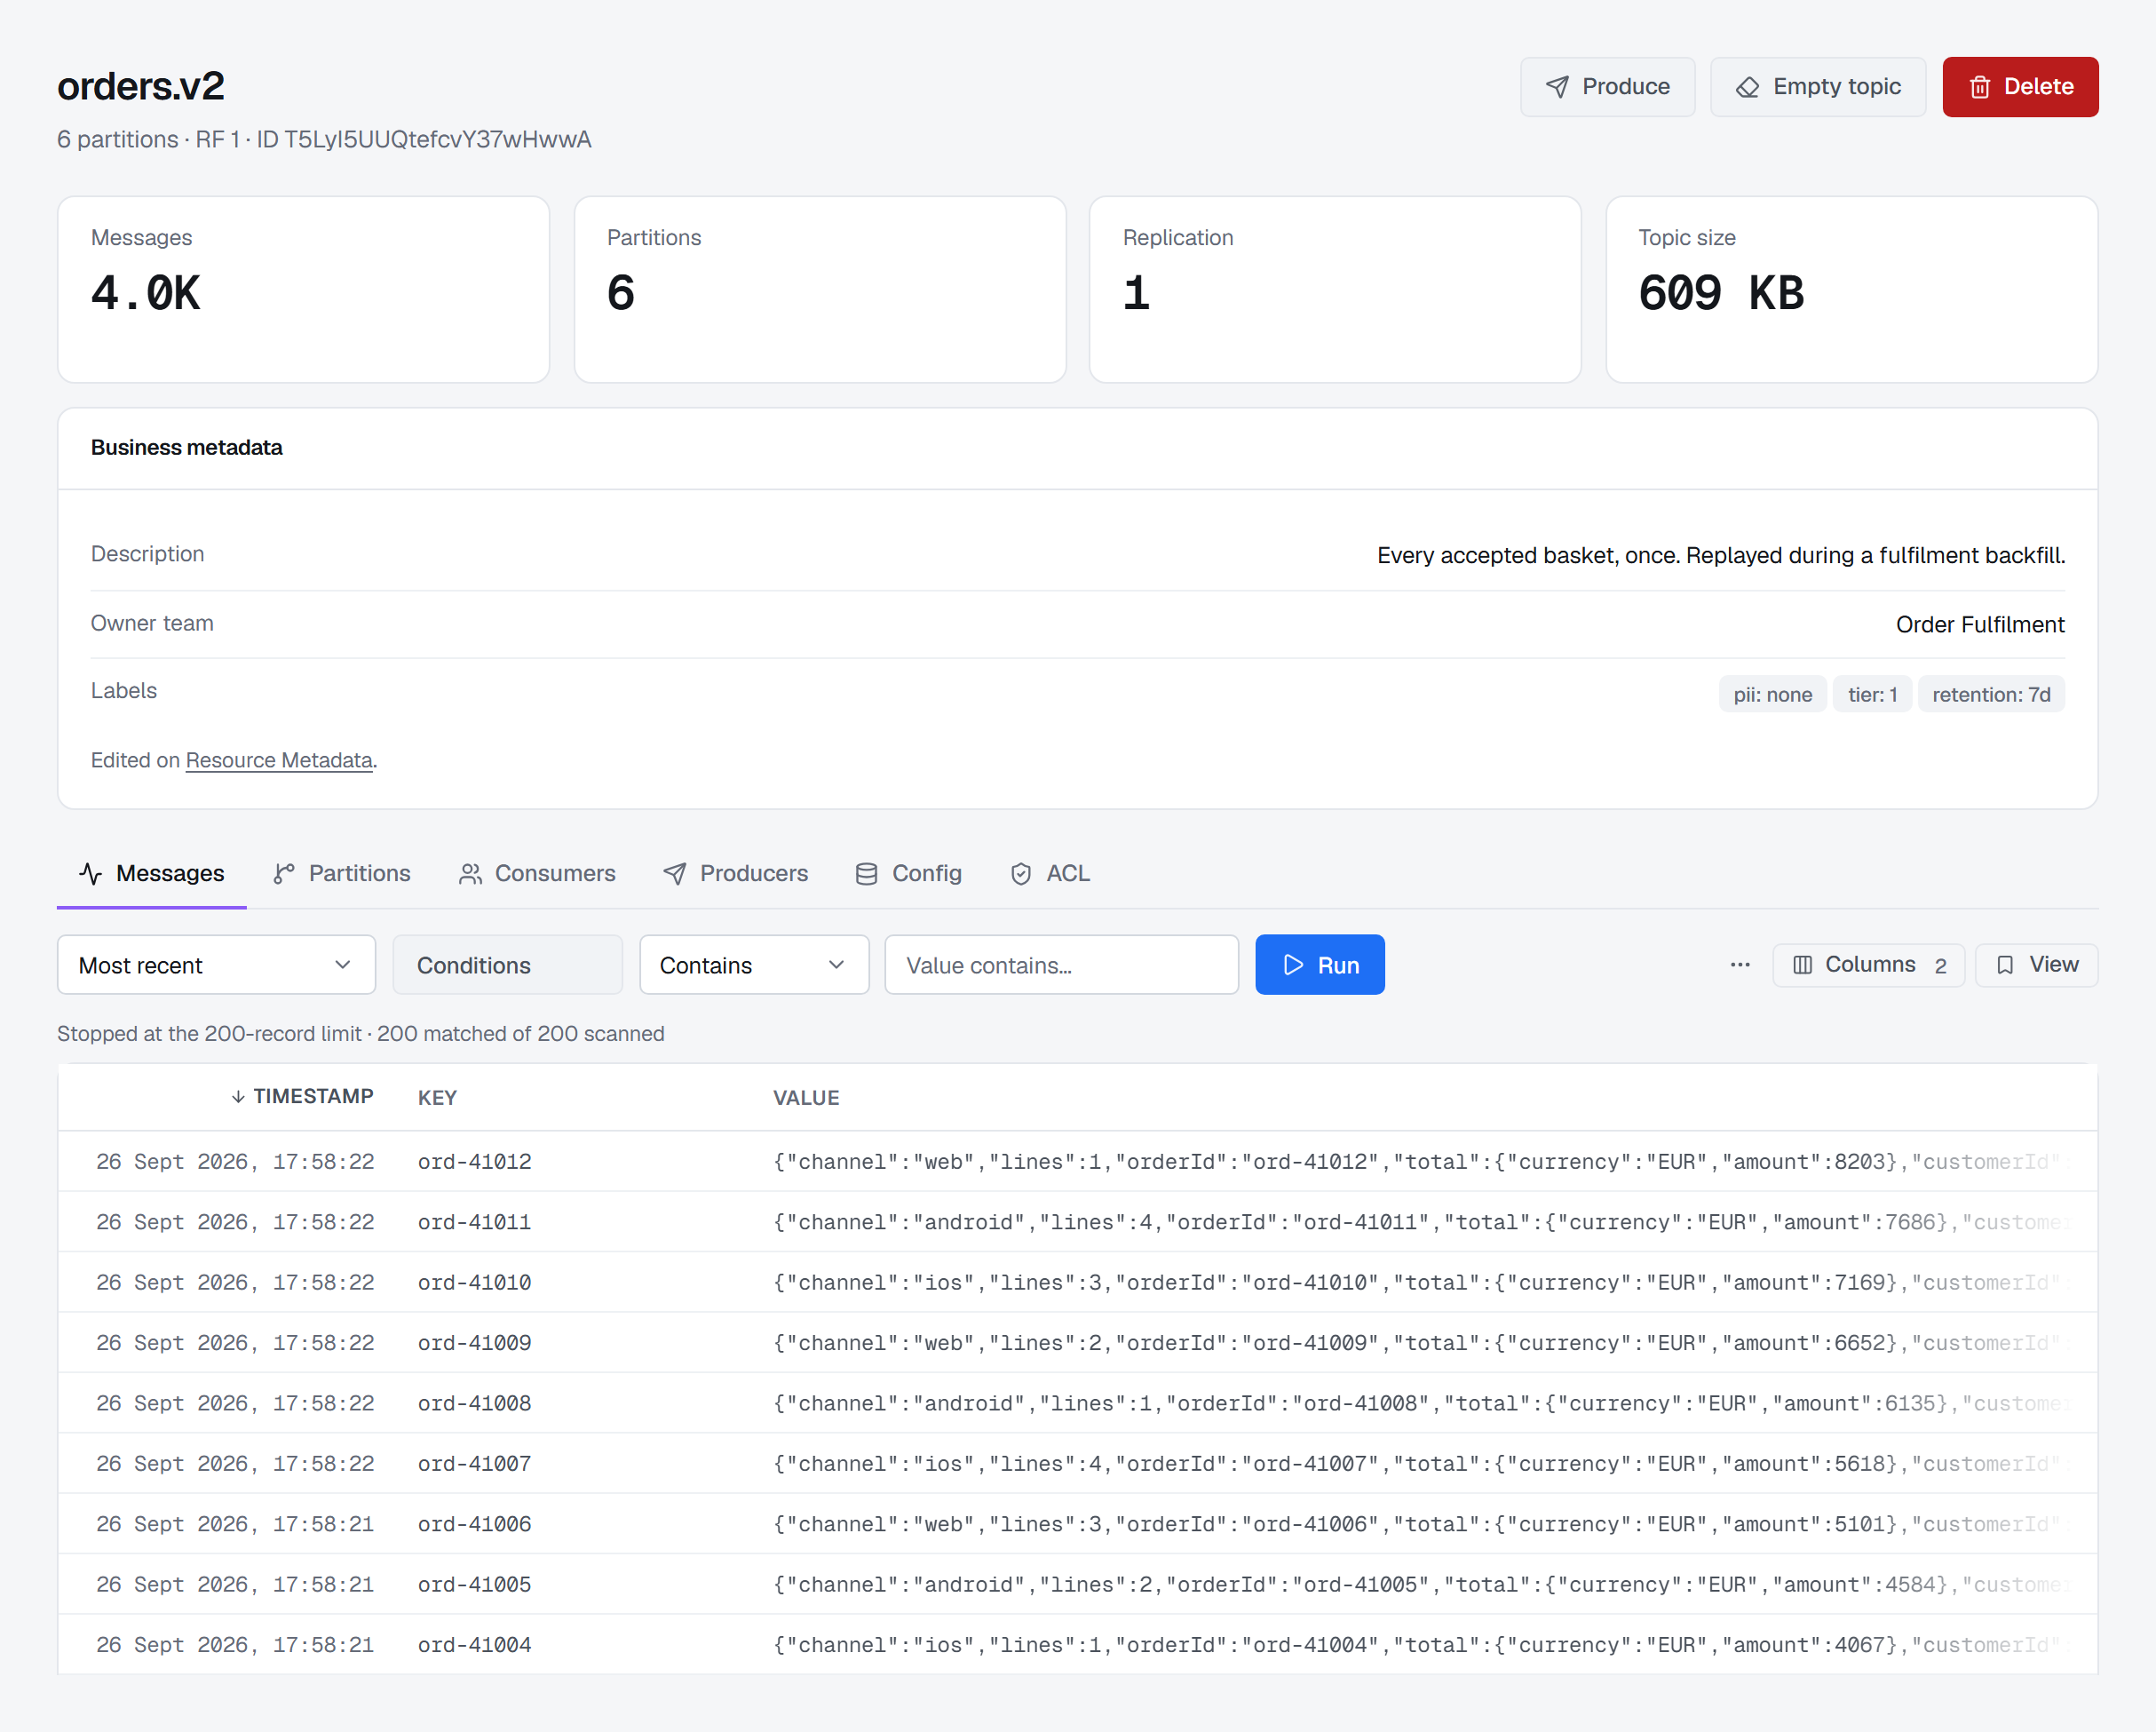
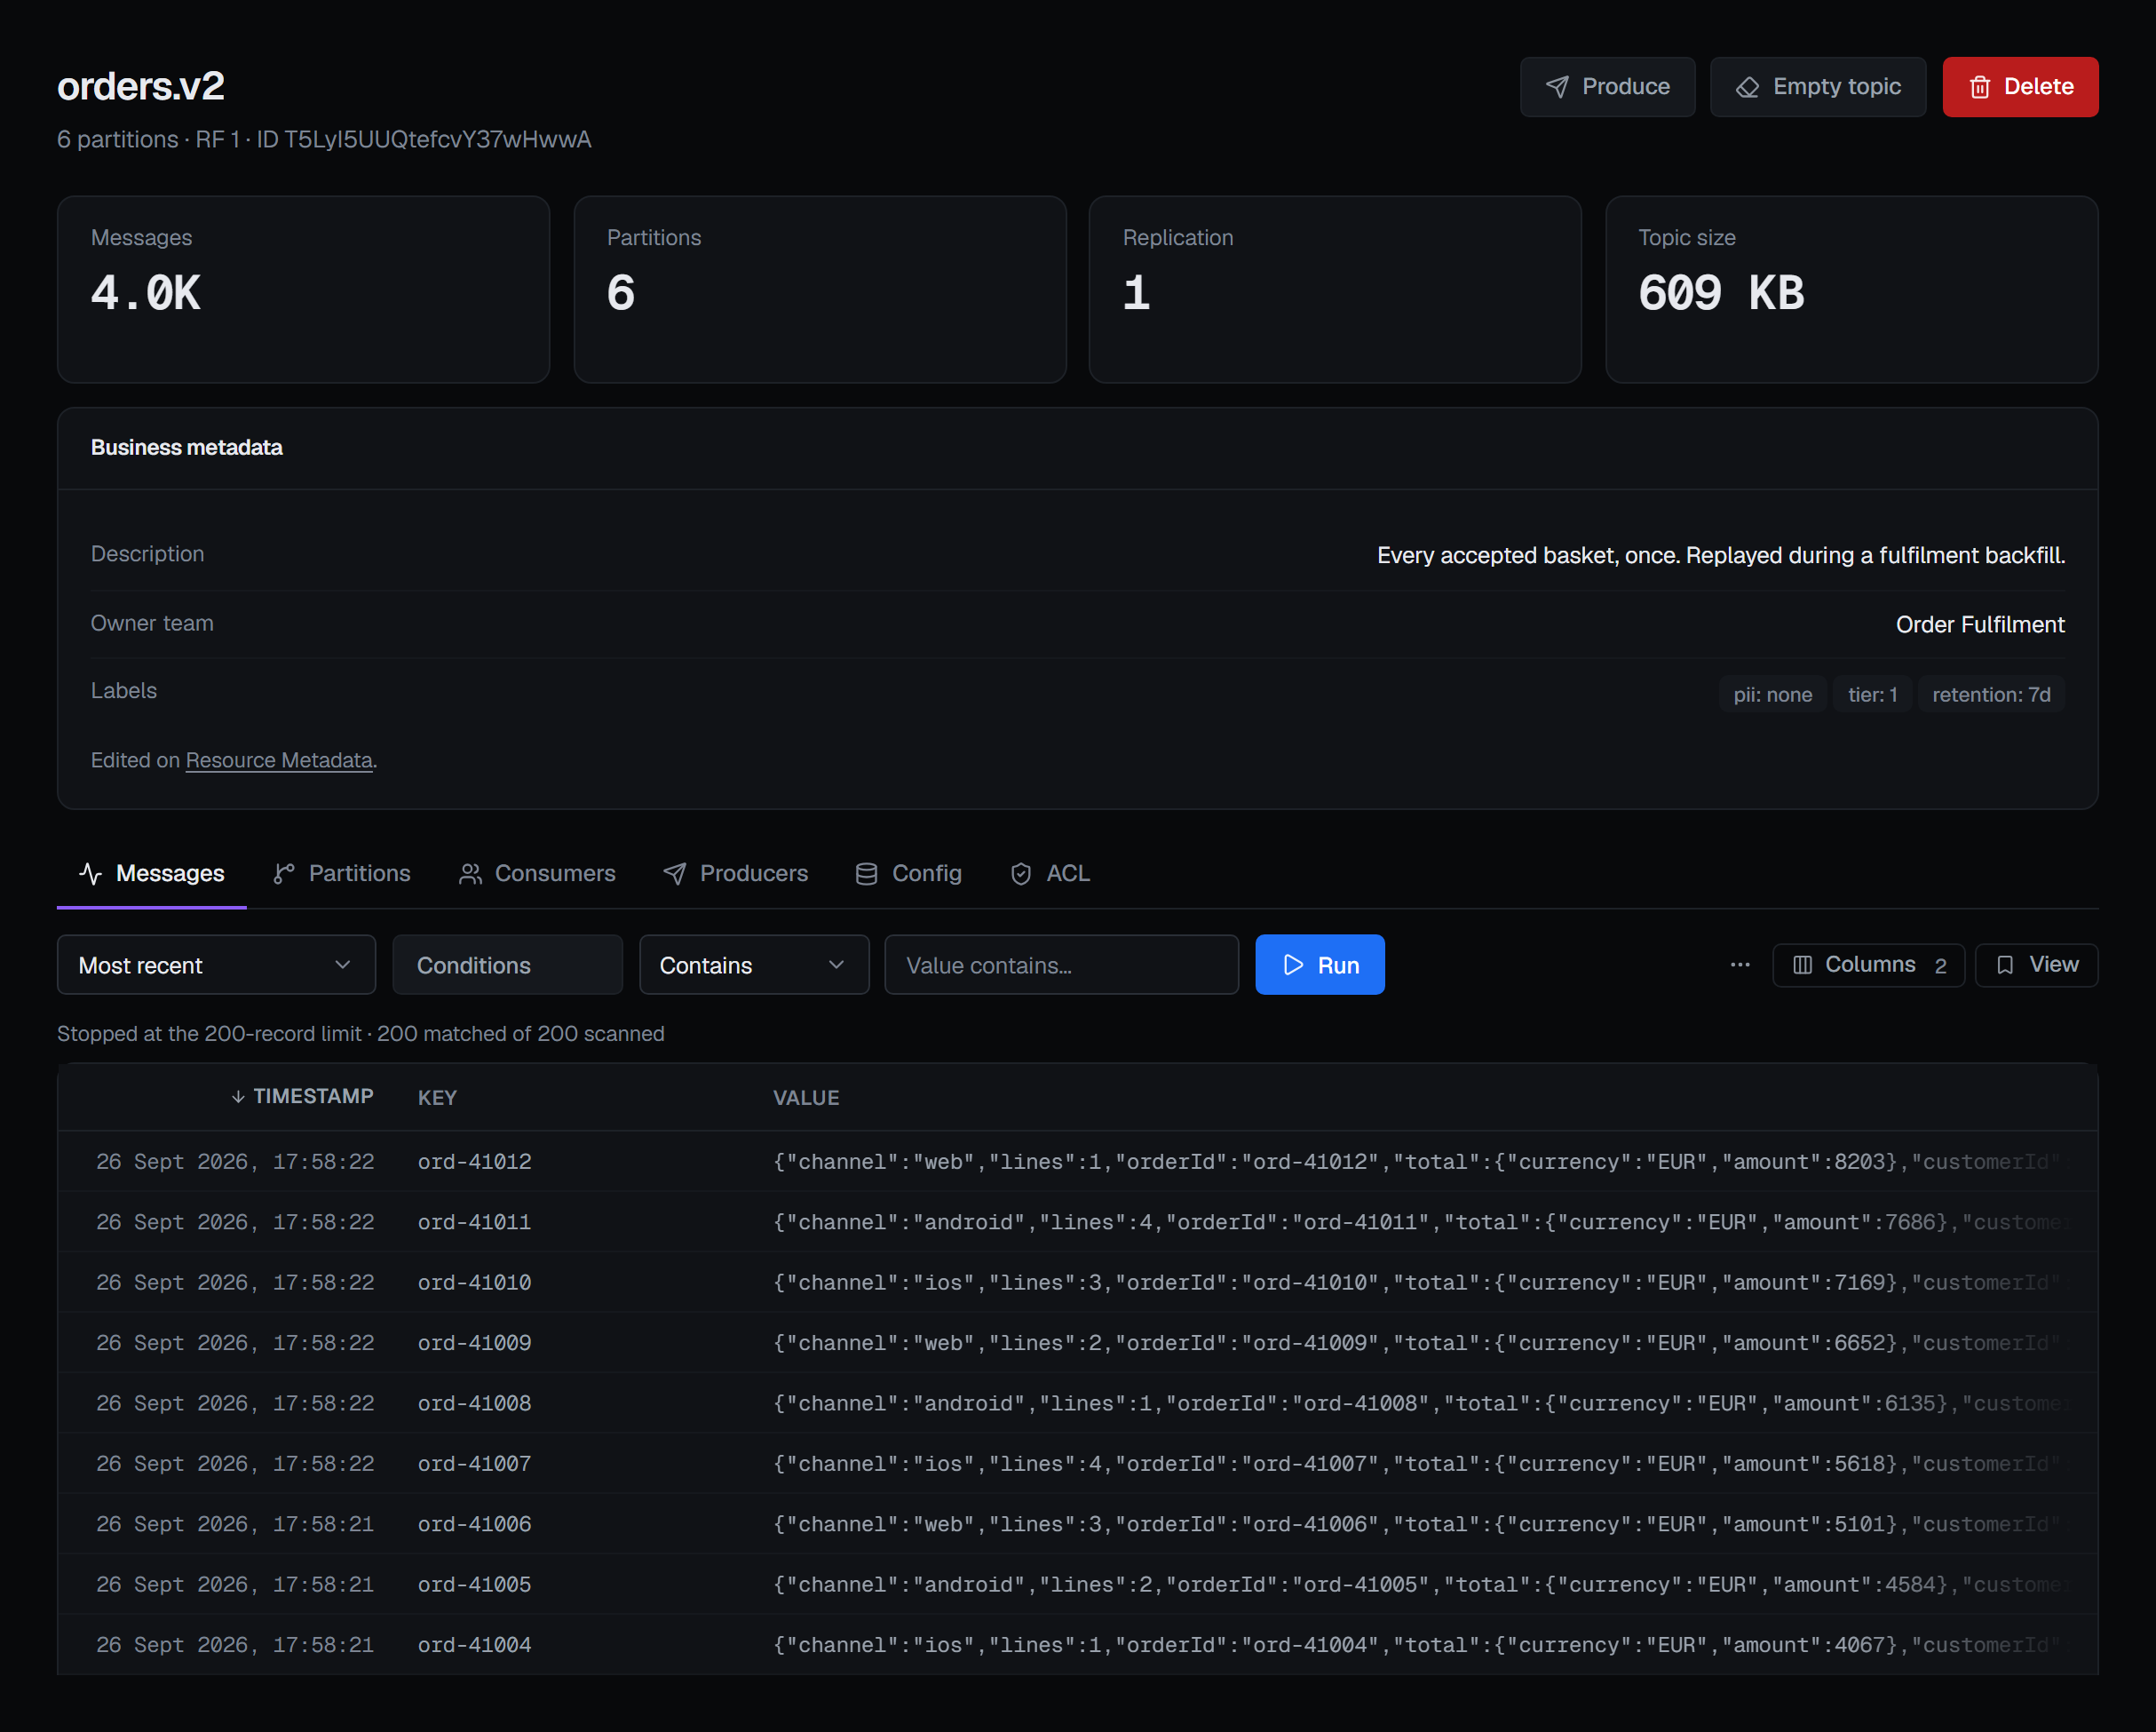
A topic's page opens on its messages, with its partitions, the consumer groups reading it, the producers writing to it, its configuration and its ACLs each a tab away. The header carries the numbers you would otherwise go looking for: message count, partitions, replication and size. The Partitions and Consumers tabs have a page of their own, Partitions and leaders, and so does the Producers tab, Producers and open transactions.
The line under the topic's name gives its partition count and replication factor and, where the cluster reports one, the topic id Kafka assigned when the topic was created. A topic deleted and created again under the same name gets a new id, which is how the two are told apart.
Size is the sum of every replica, so a topic with three replicas of one gigabyte of data reports three gigabytes. That is what the topic actually occupies on your disks, which is the number that matters when you are deciding whether it is the reason a broker is full.
Message count is the distance between the earliest and latest offsets. On an ordinary topic that is the number of messages in it. On a compacted topic it is higher than what a consumer reading from the start would receive, because the offsets of compacted-away records are still counted.
With JMX set up, the header adds the topic's own rates — bytes in and out and messages in per second — read from the JMX agents of the brokers that lead its partitions when you open the topic and while it stays open, and each says it comes from JMX. A rate needs every leader's answer: when one did not answer, the tile reads a dash and says how many of them did. Without JMX the three tiles are not there. The list never shows them — reading every topic's rates from every broker is the cost the list is built to avoid. See JMX metrics.
Configuration, and what is actually set
The Config tab groups the topic's settings the way you think about them — retention, compaction, message handling, storage, durability — rather than in the flat alphabetical list the broker returns. It opens showing only the properties that have been overridden, because on a typical topic that is four rows out of ninety, and those four are the ones somebody chose.
Each row says whether the value is an override or the broker's default. Turn the filter off to see everything, or search for a property by name.
Editing is per property, in a panel that knows what kind of value it is: a list where Kafka has a fixed set, true/false where it is a flag, free text otherwise. Read-only properties show a lock instead of a pencil, and sensitive values are masked.
Every editable property has Reset to default beside Update value. That is a real operation, not a convenience — it removes your override from the broker rather than writing the default back as a new override, which are different states with different futures.
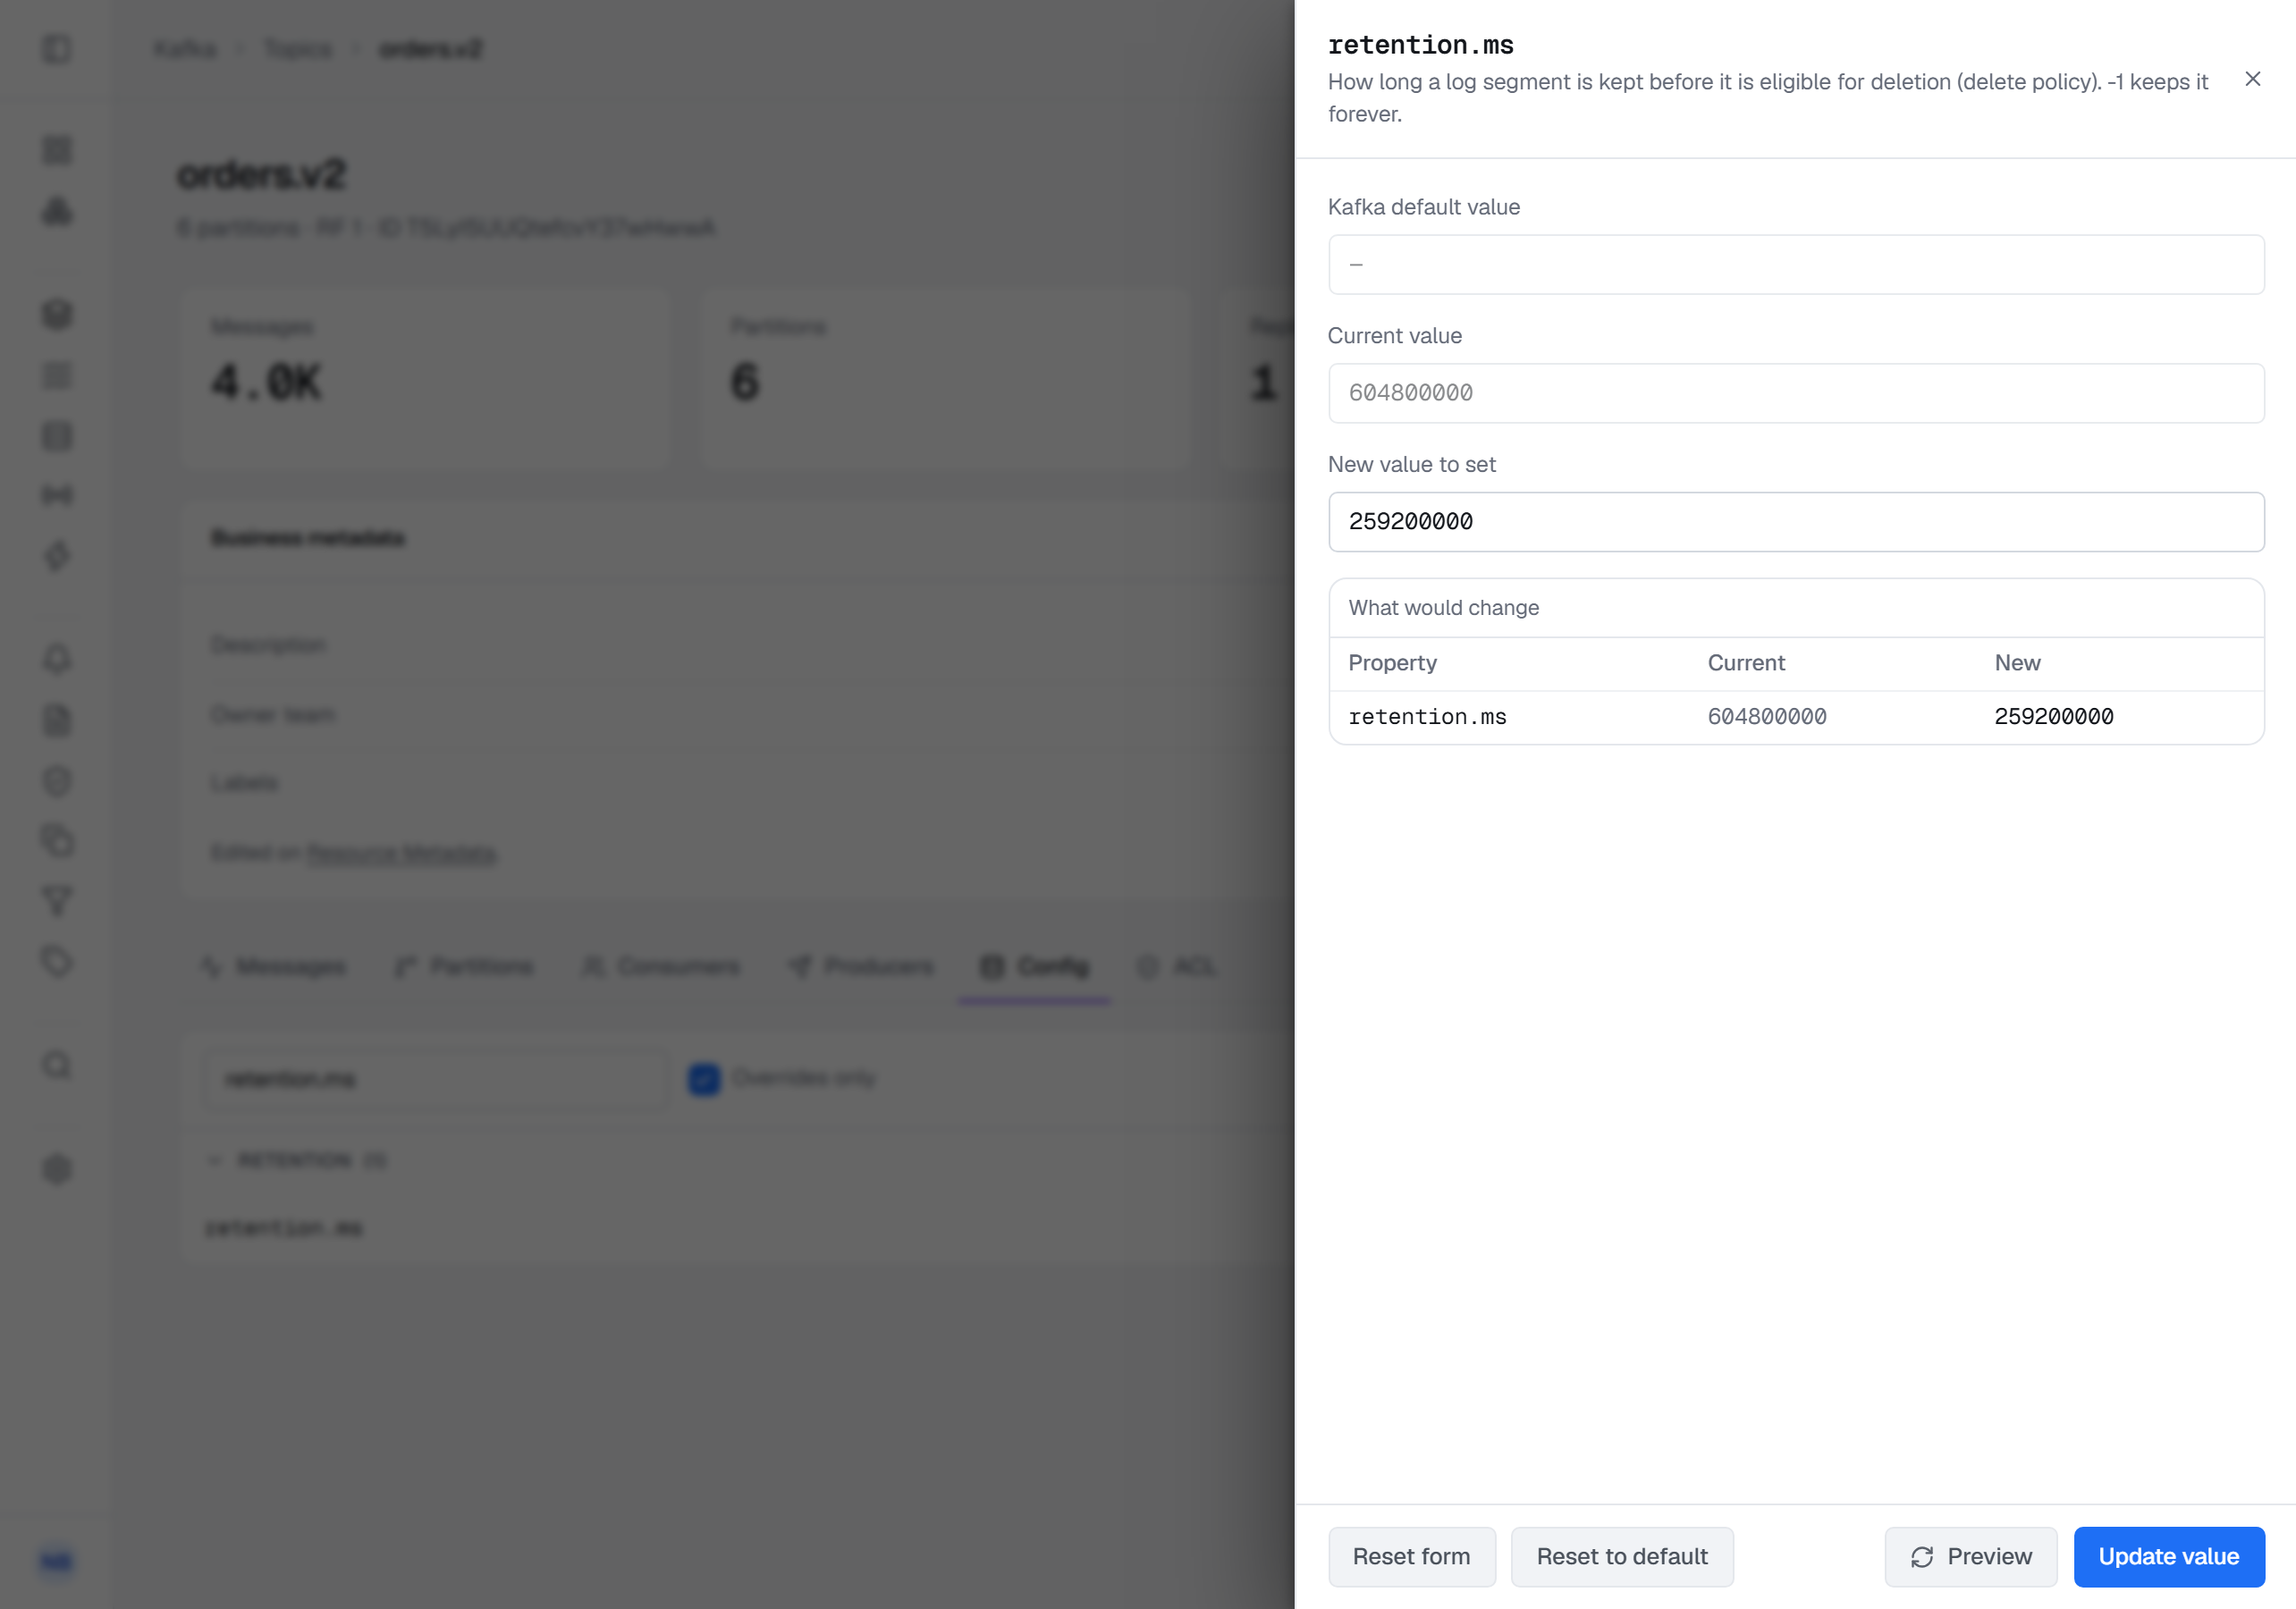
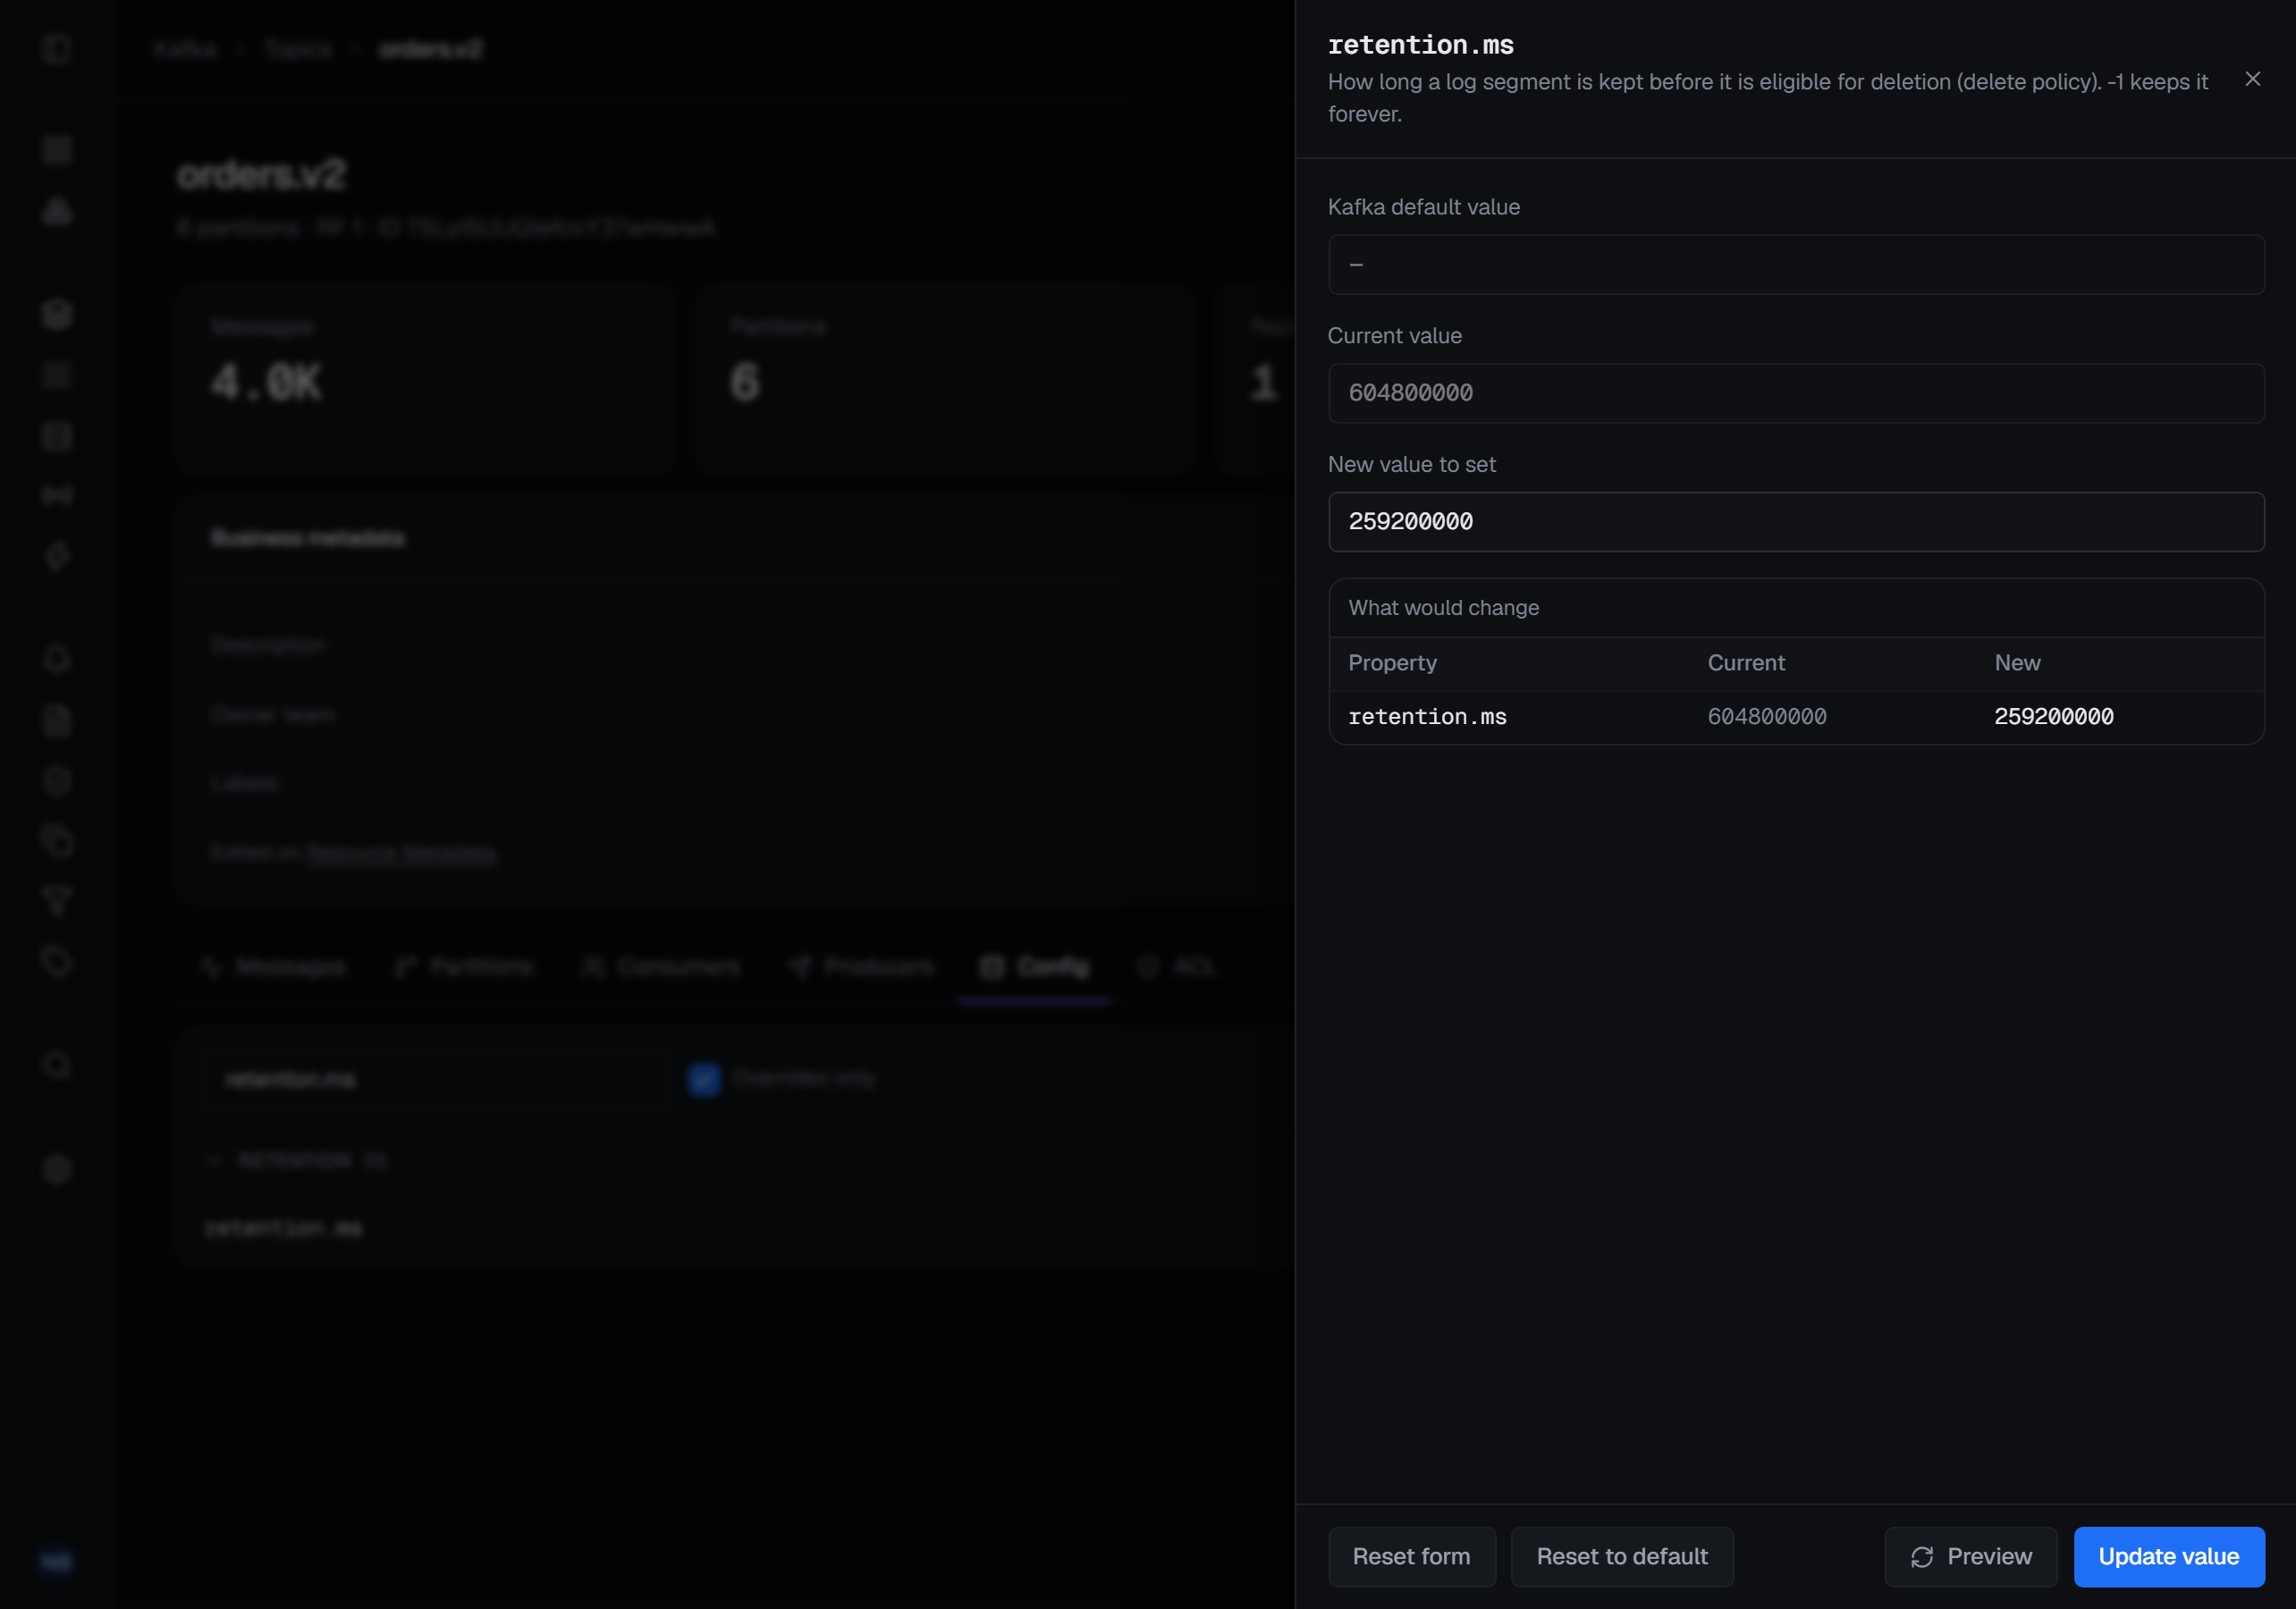
Preview asks the brokers to check a new value without writing it. They check the property's name, the value and any alter-config policy the cluster enforces, and either refuse it in their own words or answer with What would change — the property's current value beside the new one. A value Kafka will not take is refused there, before Update value sends anything. Previewing is optional, and it writes nothing and records nothing.
Creating a topic
Name, partitions, replication factor and cleanup policy are the first tab; thirty-three further settings across seven groups are the second, and only the ones you actually change are sent — a new topic inherits the rest from the broker rather than being frozen at whatever the form was showing.
The replication factor is offered against the cluster you are on: the default is the smaller of three and your broker count, and the maximum is your broker count, so a single-broker development cluster offers only 1 and says why, rather than accepting 3 and failing at the broker.
Changing a topic that already exists
Adding partitions, on the Partitions tab, is described under Adding partitions: it changes which partition a keyed message lands on, and the dialog makes you acknowledge that before it runs.
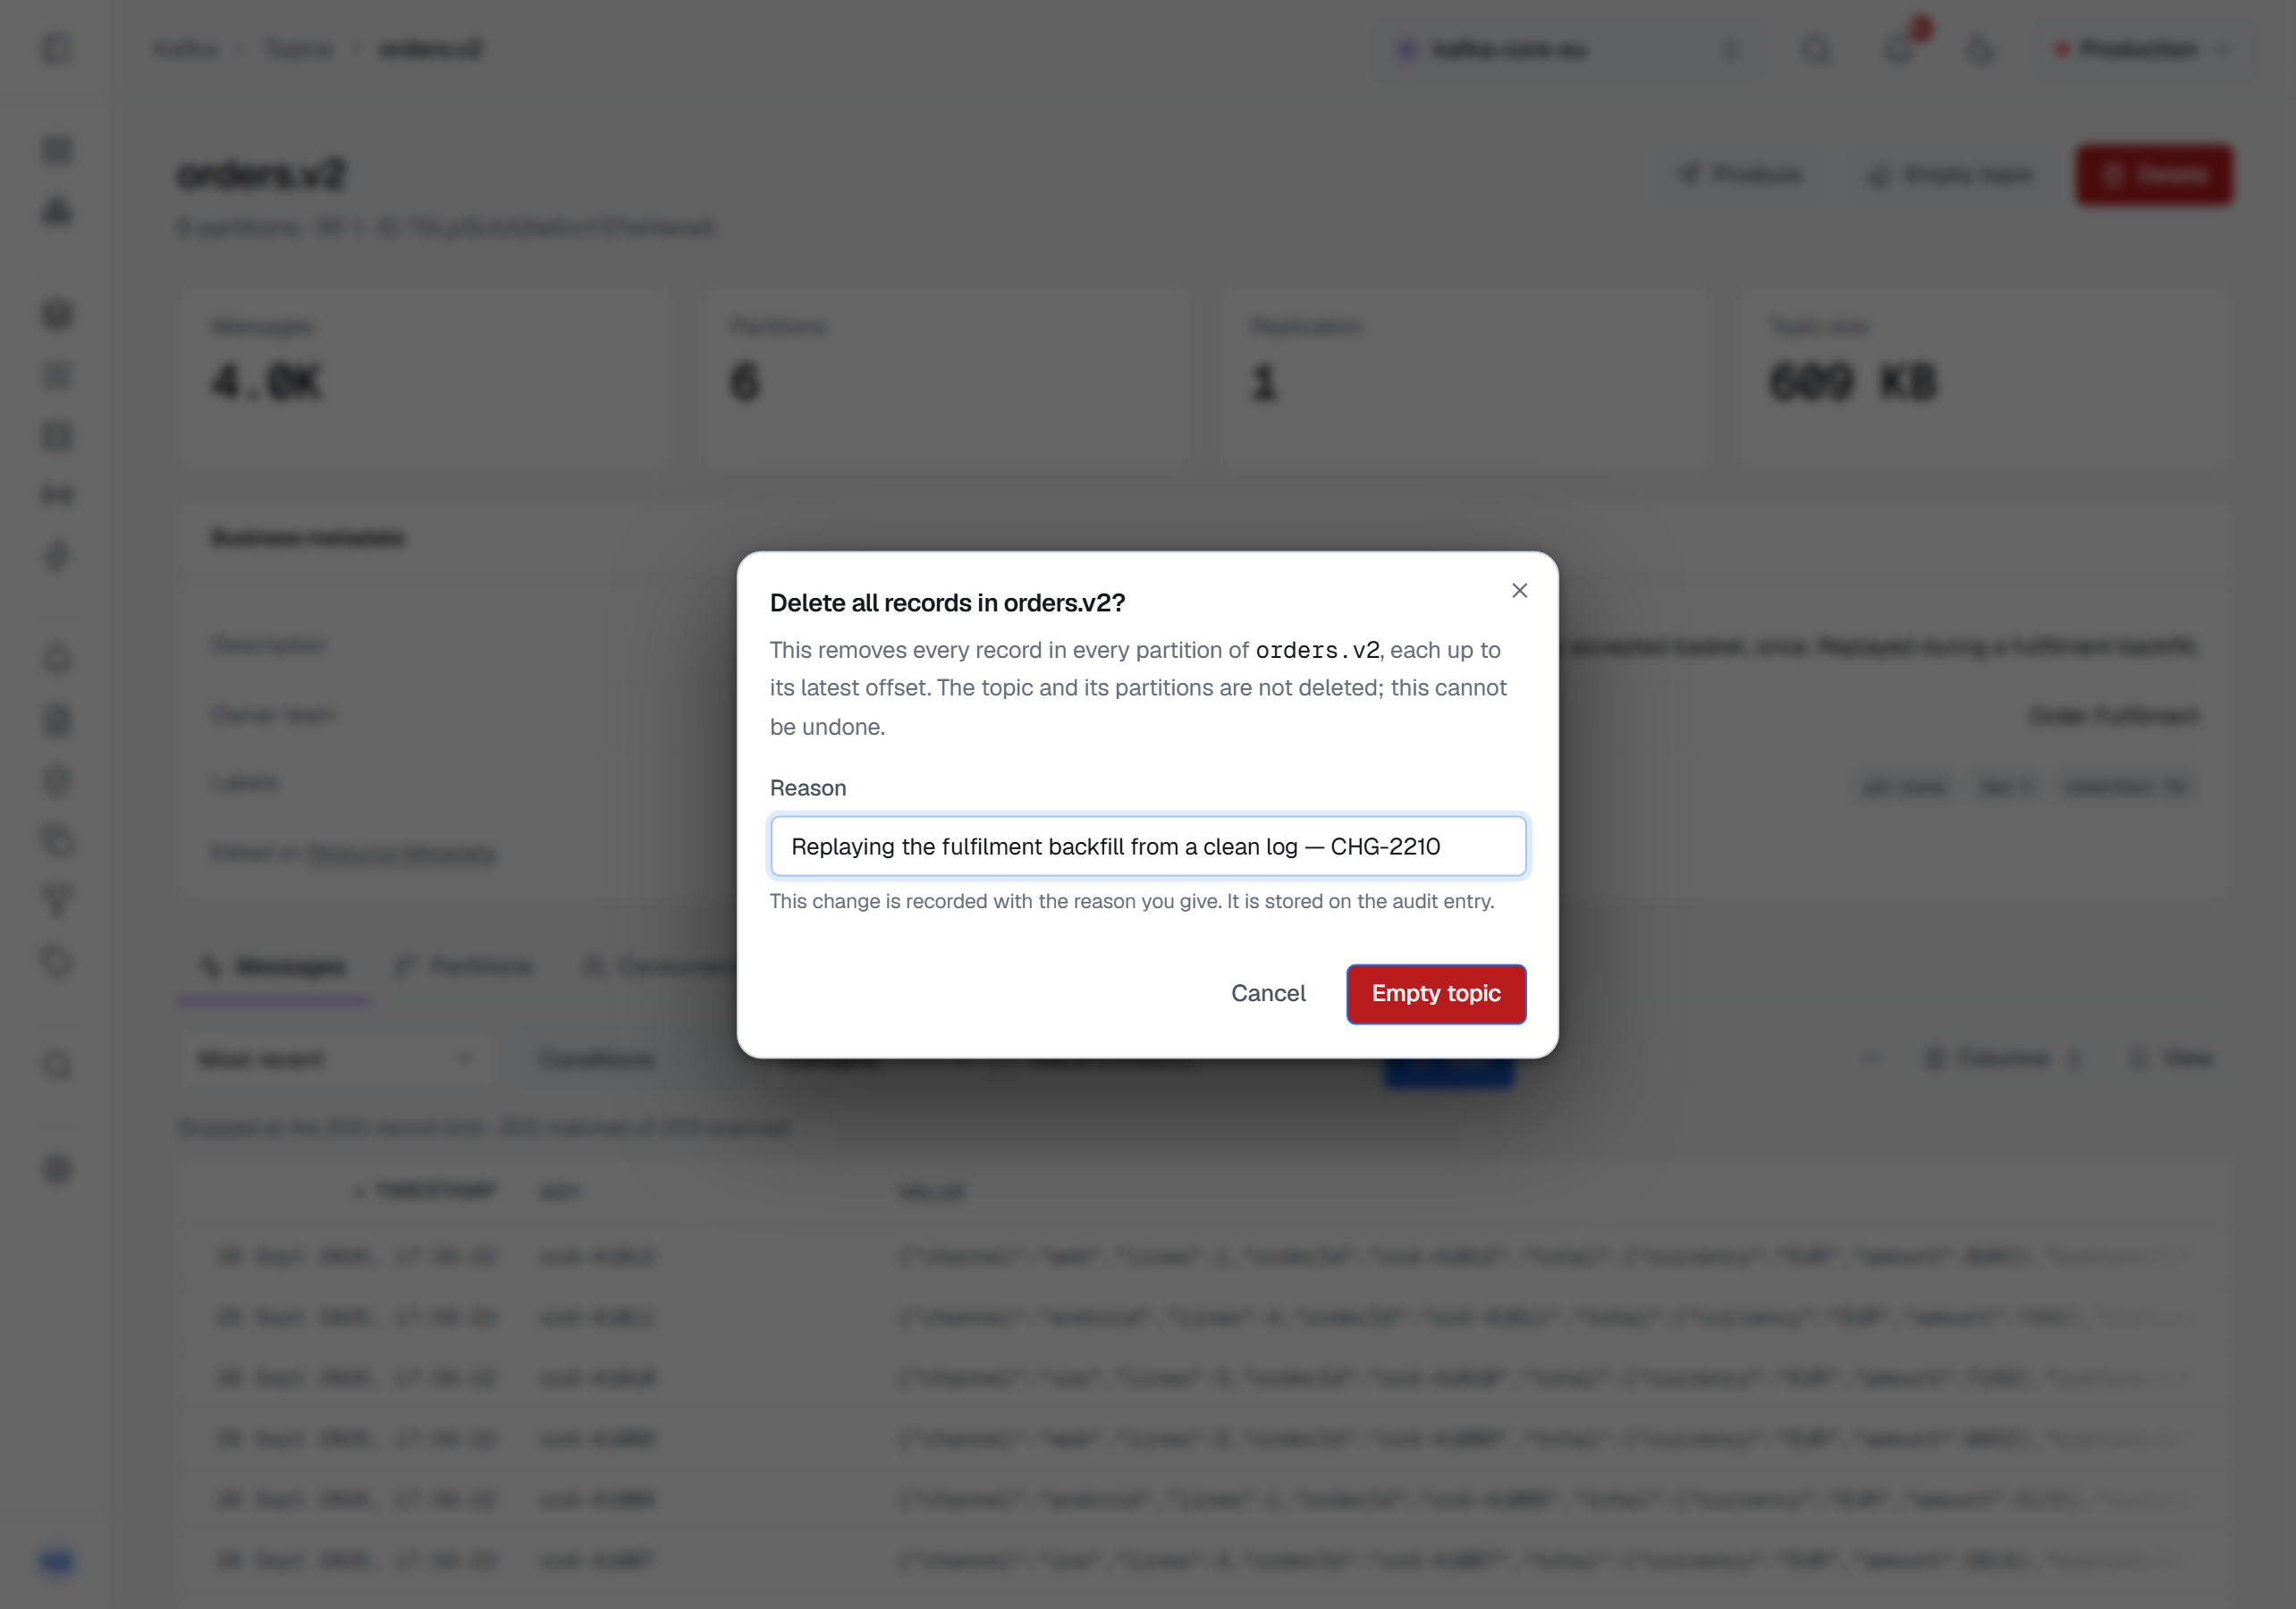
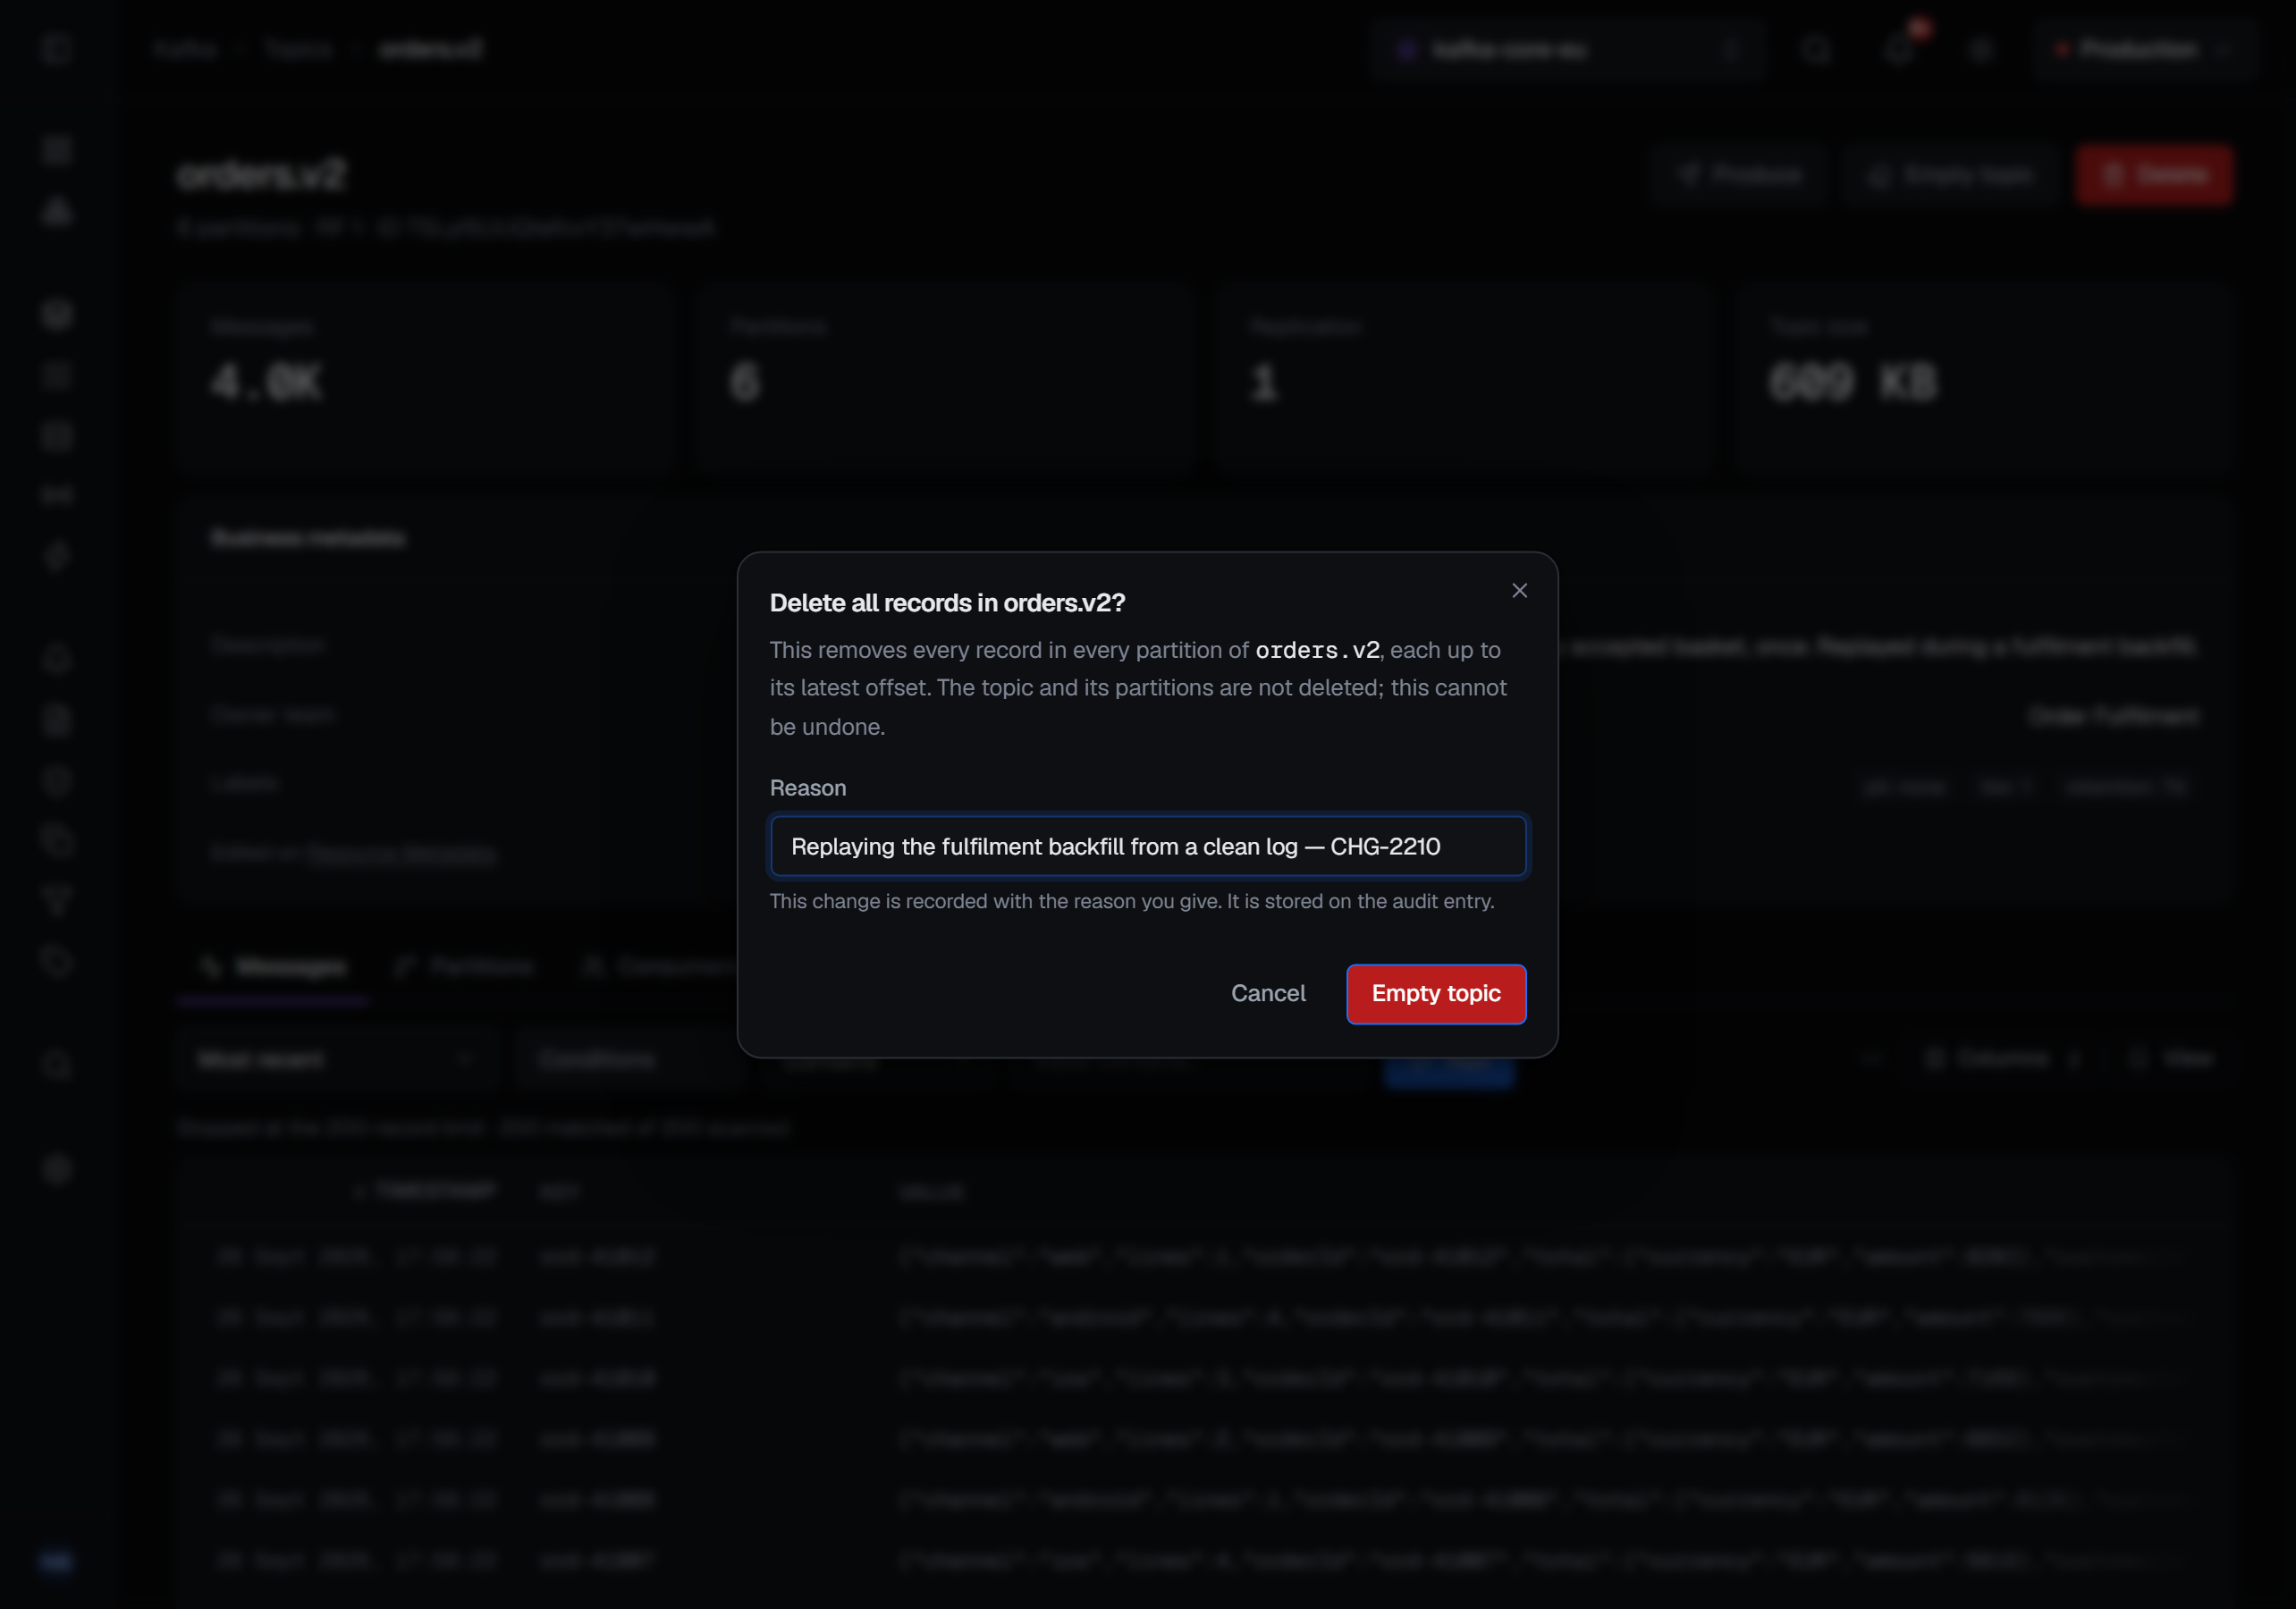
Emptying removes records and keeps the topic. A partition's own row empties that partition — the start of its log moves forward, discarding what is behind it and leaving the partition in place. Empty topic, in the header between Produce and Delete, does the same to every partition at once, each up to its latest offset, in one request. Both ask for a reason in every environment, and neither can be undone. A run that empties only some partitions names the ones it could not, rather than reporting the topic empty.
A compacted topic needs one more step, because Kafka deletes records only from a topic whose
cleanup policy includes delete. On such a topic both dialogs say so and ask for an extra
confirmation — a box you tick to say you understand what happens next — and BROKA then switches the
topic's cleanup.policy to compact,delete for as long as the deletion takes, deletes the records,
and puts the policy back to compact.
Either dialog closes once the attempt is over, and the notification carries the broker's own answer — how many partitions were emptied, or the sentence Kafka refused with.
Deleting requires typing the topic's name exactly, and the dialog tells you how many messages that will destroy before you type it.
ACLs
The ACL tab shows every rule that applies to this topic — matched properly, so a prefixed rule
covering orders.* appears on orders.v2 rather than only on an exact-name match. It is a read-only
view here: it answers "who can reach this topic". Rules are edited from the other direction, per
principal, under Service accounts.
The tab is shown to anyone who may view the cluster's ACLs; someone without that permission is told so rather than shown an empty list. An empty tab means no rules match, not an error — a cluster with no authorizer configured simply has none. When the connection's own identity may not read the ACLs, the tab says the cluster did not allow it, in Kafka's words — not that signing in failed — and the rest of the page carries on.
What gets recorded
Creating a topic, changing its configuration, emptying a partition or the whole topic and deleting a topic are each written to the audit trail with the connection, the topic and what changed. A configuration preview is not: it changes nothing. Those records are written in a way a disconnecting client cannot cancel — an irreversible action on your broker does not get to lose its only trace because a browser tab closed. What the Partitions, Consumers and Producers tabs record is on Partitions and leaders and Producers and open transactions.